TCI
Equity Metrics
October 23, 2026
Transport Corporation of India Limited
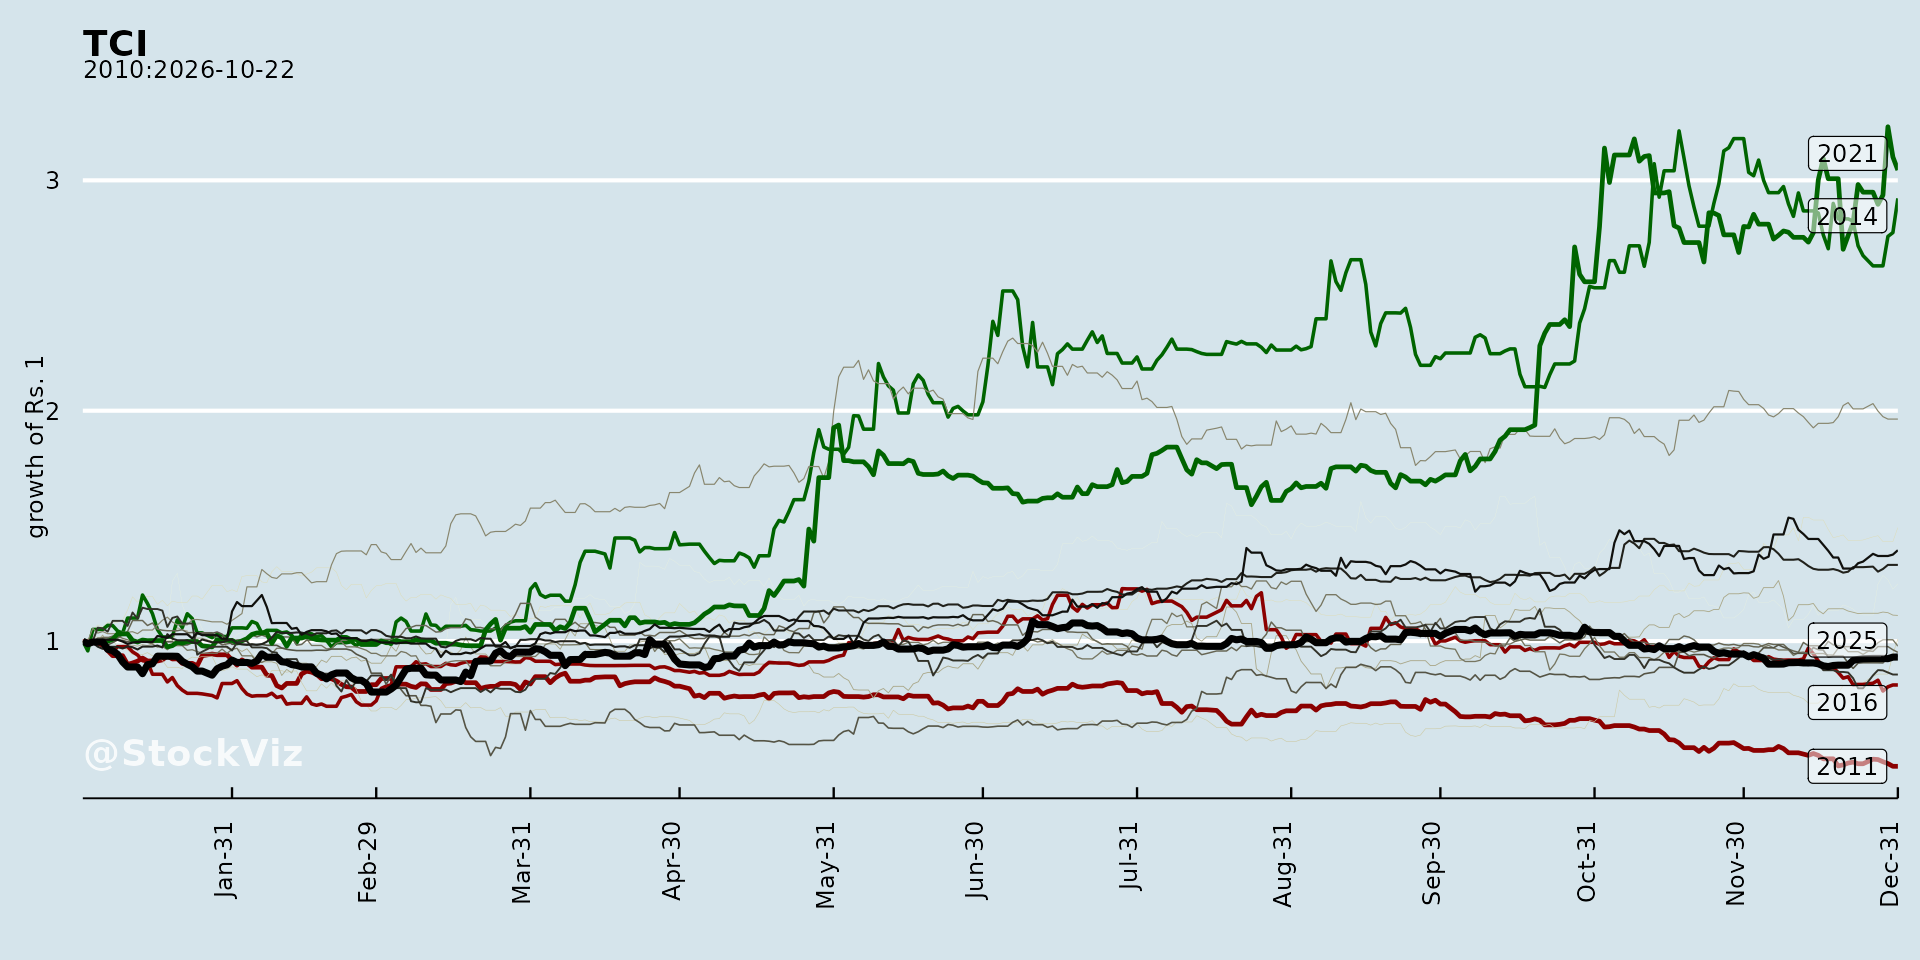
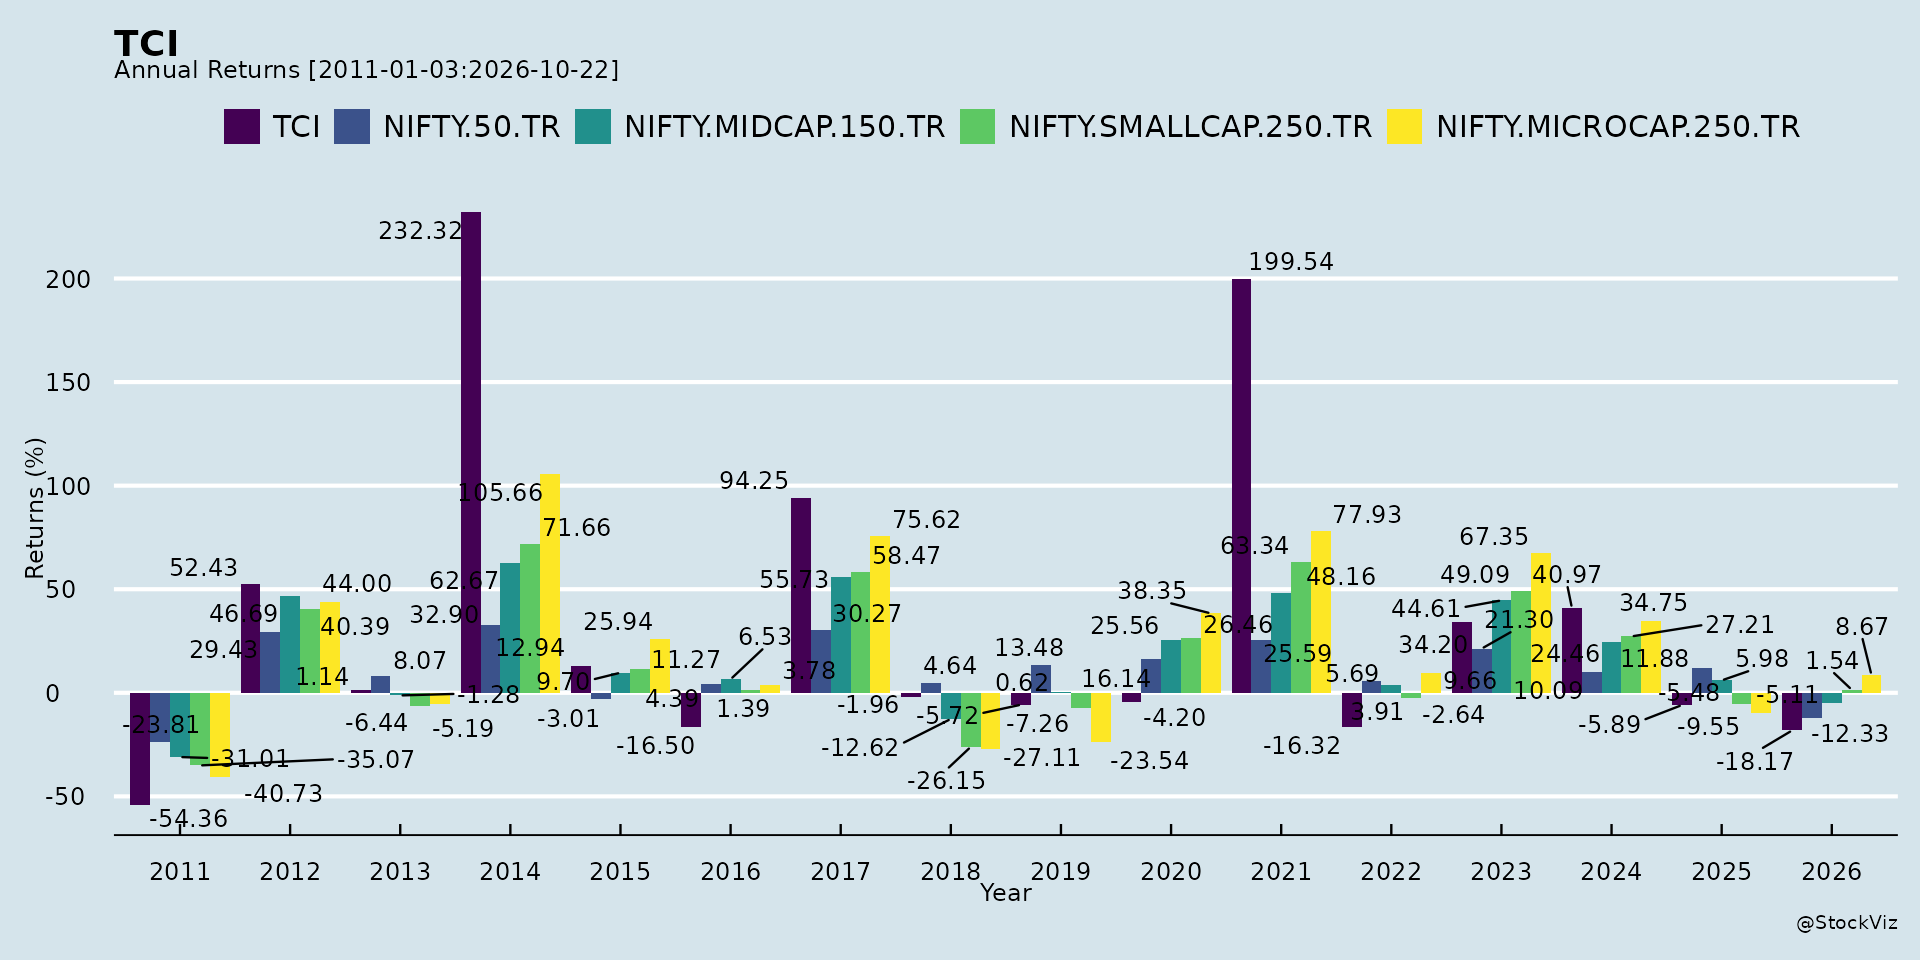
Annual Returns
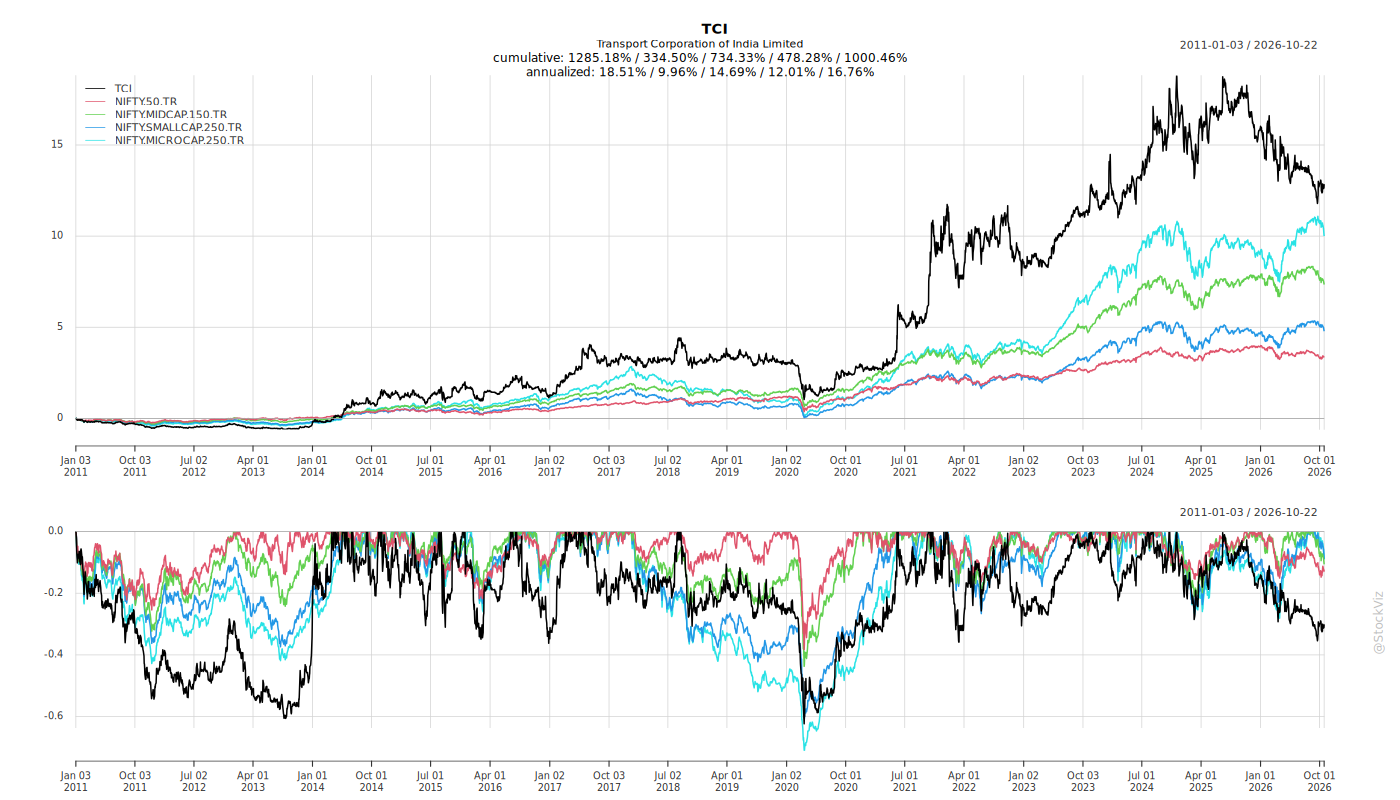
Cumulative Returns and Drawdowns
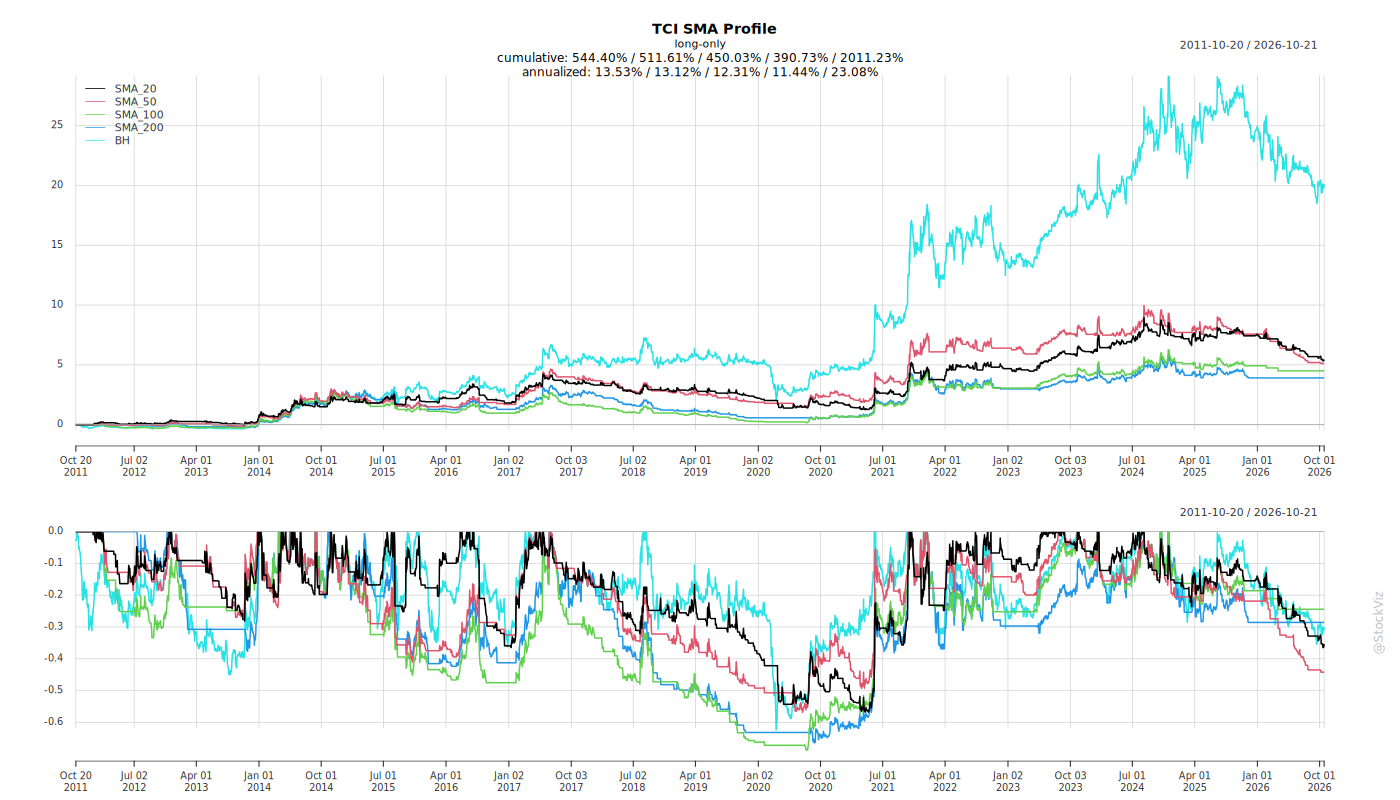
Fundamentals
Ownership
Margined
AI Summary
asof: 2026-09-17
TCI Q1 FY2027: Headwinds, Tailwinds, Risks, and Guidance vs. Performance
1. Headwinds and Challenges
West Asia crisis and fuel costs. The quarter was dominated by the impact of the West Asia crisis. Diesel prices rose, and although they eased when hostilities paused, they accelerated again. Bunker prices followed a similar volatile path: they spiked in late February–March, eased in the first few months, then climbed back to roughly Rs. 86,000 per ton by late July. Bunker prices have ranged widely—touching about Rs. 1,05,000 and falling to about Rs. 72,000—and fuel-company discounts that existed previously have been withdrawn.
Container and rail congestion. A large backlog of containers built up at JNPT and Mundra, reported at almost 10,000–12,000 containers at JNPT. Rail movements were slow across the country, with congestion especially high in the east, and rakes and engines standing idle. Container repositioning was also a challenge, and international container prices rose substantially, pressuring exports.
Monsoon and seasonality. The monsoon slowed rail movements and typically reduces voyages in the seaways business. Q1 was described as a lean season on the logistics side.
Customer and sector pressures. Companies affected by a gas shortage restarted in June, but management feared some might shut down in the coming weeks if prices remained high. Export production was affected in pockets, including some engine manufacturers supplying West Asia. In the Trans System business, margins declined from around 14–15% to about 12% and then around 9%, with production cuts, pricing pressure, and some business not renewed because prices were too low.
Supply chain growth moderation. Supply chain growth was moderate, coming off a higher base, with a lag between continuous investment in warehouses and equipment and the returns from it. Manpower availability was a challenge, as labour moved out of cities and towns amid an LPG shortage, forcing hiring at higher cost.
Working capital. Management noted possible pressure on working capital days (55–56 days) because of rate hikes, though credit policies were fully implemented and no real challenge was seen so far.
2. Tailwinds and Growth Prospects
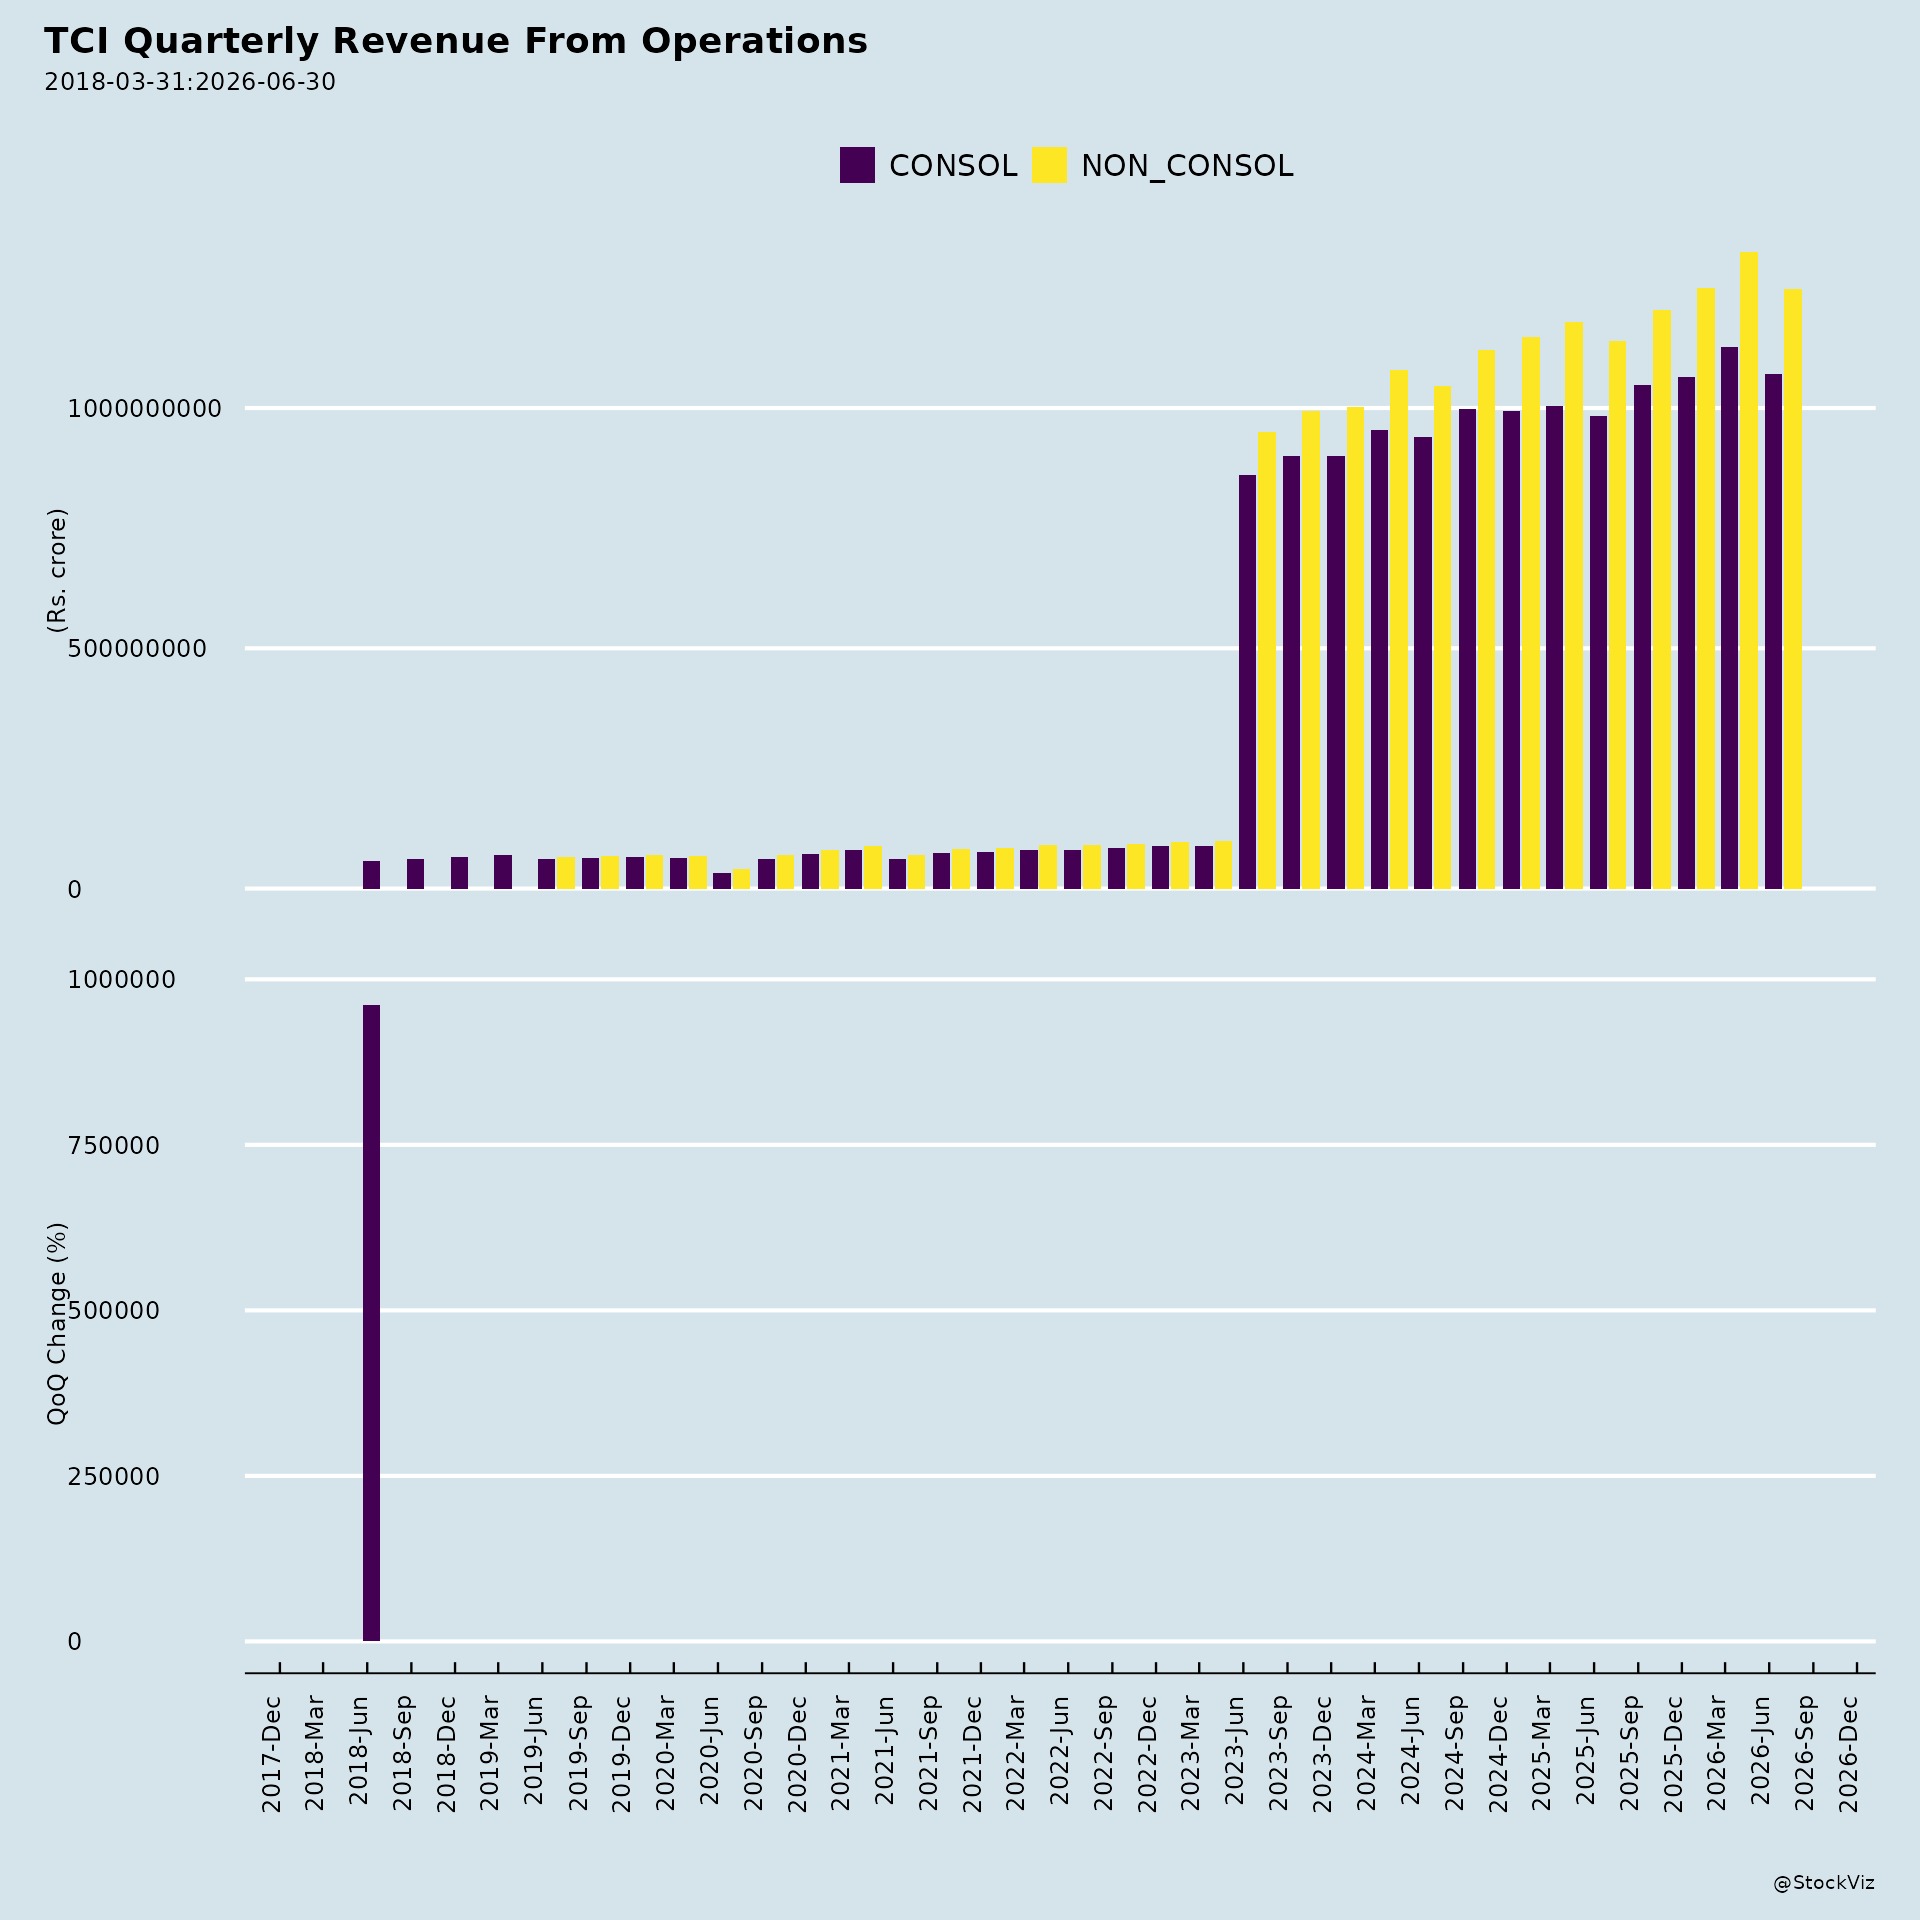
Consecutive growth and balance sheet strength. Q1 FY27 marked the 24th consecutive quarter of growth, with top-line growth of about 9% at the consolidated level. The company held close to Rs. 160 crores in cash, invested about Rs. 167 crores in Q1 (against about Rs. 370 crores last year), and its CARE rating was enhanced to AA+.
Freight business. Top line grew about 10–11%, with some volume growth and some value growth. The FTL-to-LTL mix remained the same, but traction and pipeline in LTL were described as good. Ten of 30 planned new branches were opened in the quarter. LTL carries roughly double the gross margin of FTL (about 20% versus 10%), so mix shift supports gradual margin improvement.
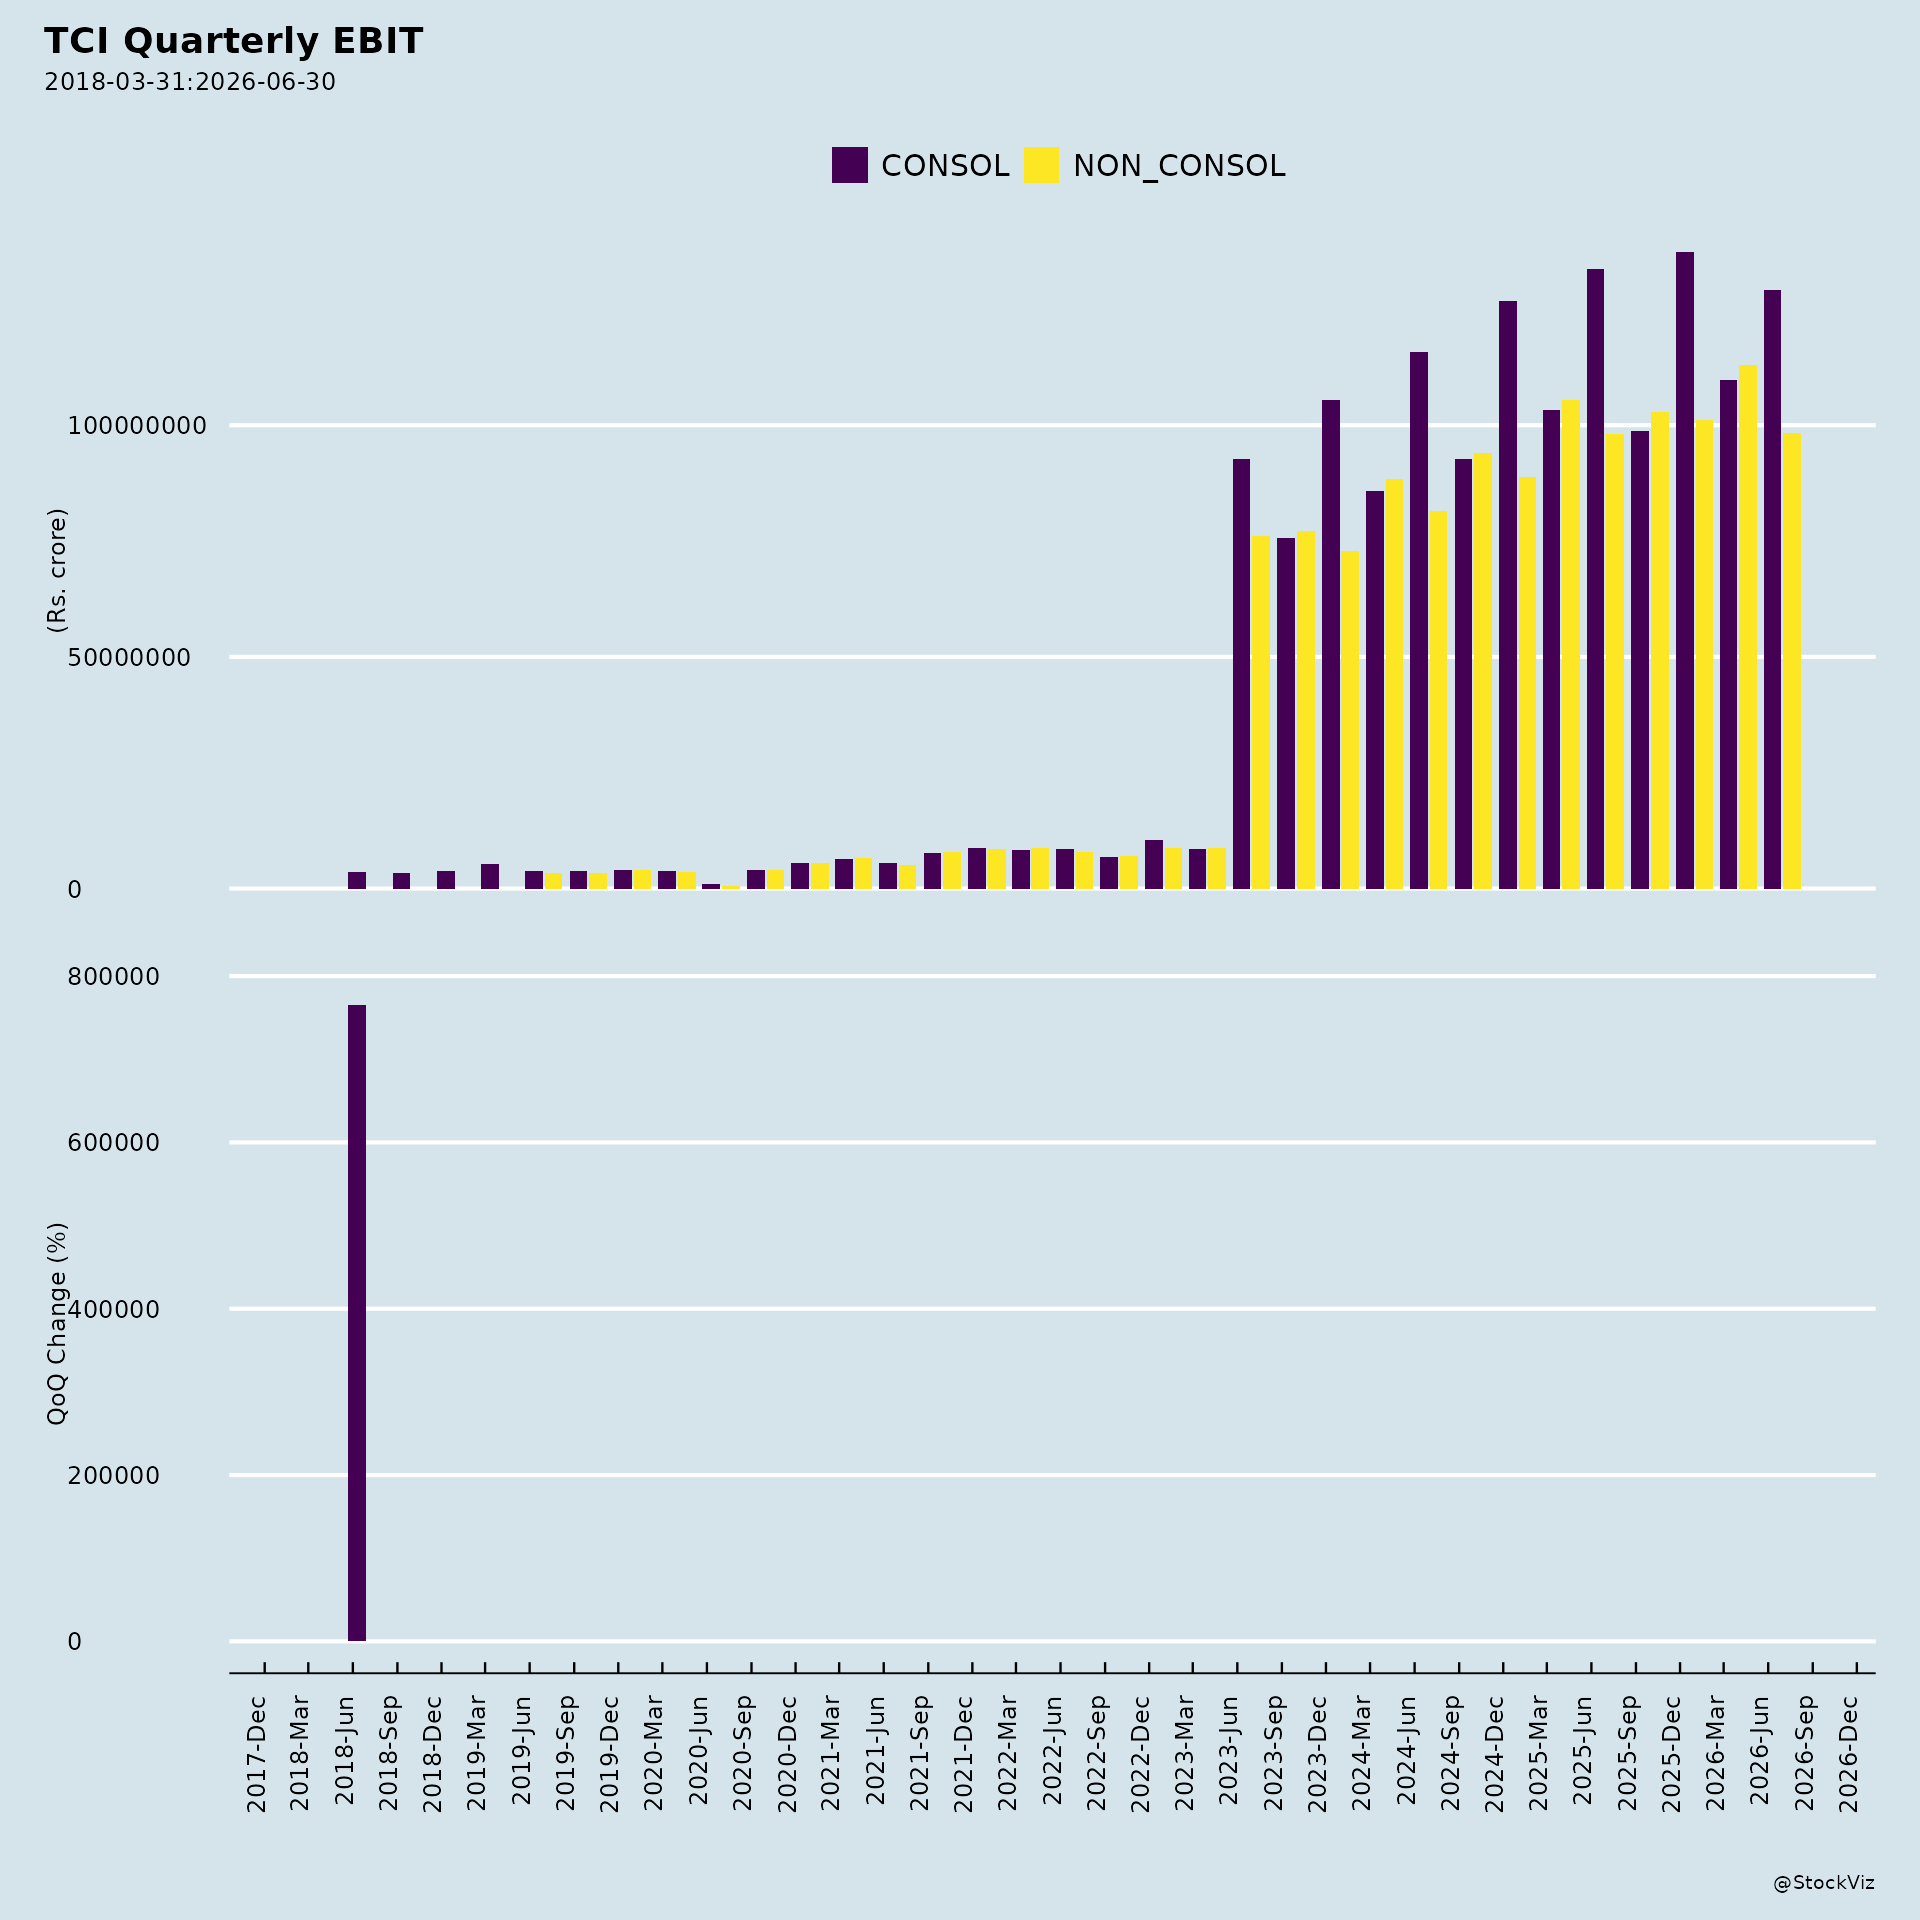
Supply chain. Margins improved at the EBITDA level because of investments, though EBIT was almost the same. Management pointed to a strong pipeline of contracts, new trucks added for new contracts, and supplementary bills submitted to clients for diesel price increases, expected to flow through in Q2 and subsequent quarters. Growth is expected in the higher teens, 12–15%.
Seaways. Rate increases were implemented with customers. Two new new-build ships are expected, with induction around Q3; the first around September–October and the second around October–November. Management is also exploring a third new ship and keeping an eye on second-hand vessels. New ships typically reach full utilization within four to six months.
Joint ventures and cold chain. The Concor joint venture grew about 88%, and Cold Chain grew about 48%. Cold Chain contracts acquired in Q3–Q4 of last year began playing out this year. Trans System grew about 11.5% on the top line, with similar growth expected alongside growth of Japanese clients.
Sector demand. The auto sector showed robust growth. There was some positive impact on the MSME side. Quick commerce is accelerating and rejigging supply chains. Deep capabilities were built in renewables, including bulk movement of solar products by road and rail and kitting facilities tied to the Pradhan Mantri solar power scheme. Restocking ahead of the festival season was beginning, with inventory replenishment expected to drive longer-distance revenues in subsequent quarters.
Capex. The FY27 budget is Rs. 550–600 crores, of which about Rs. 167 crores was spent in Q1. Of the FY27 budget, about Rs. 237 crores is for ships, about Rs. 100 crores for warehouses, about Rs. 120 crores for trucks and new rakes, and about Rs. 100 crores for warehousing equipment and IT services. Management estimated Rs. 500–600 crores for the year.
3. Key Risks
- Fuel price volatility. Bunker prices are dynamic and can move either way depending on Middle East hostilities; management said it is difficult to predict and margins compress when prices rise. Diesel price hikes of about 6–7% were noted, with an estimated 1–3% impact, of which 1–2% may be recoverable.
- Geopolitical uncertainty. The Middle East situation was described as the top-of-mind uncertainty, with a direct impact on fuel prices and potential customer shutdowns if gas prices remain high.
- Execution and timing risk on capex. Returns on supply chain investments lag, and new ships will add depreciation, which may subdue profitability for one or two quarters even as revenues rise.
- Rail shift not materializing. Despite higher diesel and road freight rates, the expected shift toward rail did not occur meaningfully, partly due to the lean season and railway congestion.
- Concor partnership execution. Benefits depend on action on the ground, which takes longer given Concor is a PSU; a leadership change at Concor may take a few months to settle.
- JV dividend dependence. Lower dividend income from JVs in Q1 affected profitability, and JV capex (including for Toyota’s new Aurangabad plant next fiscal) means dividend income may not increase for a year or two.
- Manpower cost pressure in large warehouse operations, expected to ease as the LPG situation improves and automation is deployed.
4. Management Guidance vs. Observed Performance
Freight. Guidance of about 10–12% top-line growth for the year, with profitability improving from last year. Observed: top line grew about 10–11% in Q1, with slight margin improvement. Drivers cited were volume growth, mix change, network expansion, and a leadership change described as a slow process.
Supply chain. Guidance of 12–15% top-line growth for the year. Observed: growth was moderate in Q1, coming off a higher base, with EBITDA margins slightly improved but EBIT almost the same. Management maintained the 12–15% full-year guidance and expected growth to pick up in the latter half and already in Q2, supported by pipeline contracts, new trucks, and diesel-related supplementary bills. On the standalone side, growth was lower; consolidated supply chain growth was higher due to the chemical logistics and cold chain businesses.
Seaways. No specific margin prediction was given for Q2 because of bunker price unpredictability. Management indicated a 25–30% EBITDA profile is achievable irrespective of cost absorption and revenue increases, and separately described 40%-plus EBITDA as decent but likely to moderate toward 30–40% if fuel prices stay high. Observed: voyages were almost similar to last year because of a dry dock on one ship; the top-line increase came from pricing rather than more voyages, and margins were flat. Two dry docks were planned—one already completed and one at the end of the fiscal year in March—with each dry dock lasting roughly 25–35 days.
Trans System. Guidance of similar profitability and similar dividend payout as last year, with no increase expected for a year or two because of capex. Observed: margins declined to around 9%, and management said a return to the 11–12% range is unlikely, with about 10% seen as more reasonable.
JV line item. Observed JV run rate fell to about Rs. 18 crores from the usual Rs. 20–22 crores, attributed to moderation on the Concor side and lower dividend income, partly offset by faster growth in the smaller cold chain business.
Capex. Guidance of Rs. 550–600 crores for FY27, with about Rs. 167 crores spent in Q1; management estimated Rs. 500–600 crores for the year depending on how things progress.
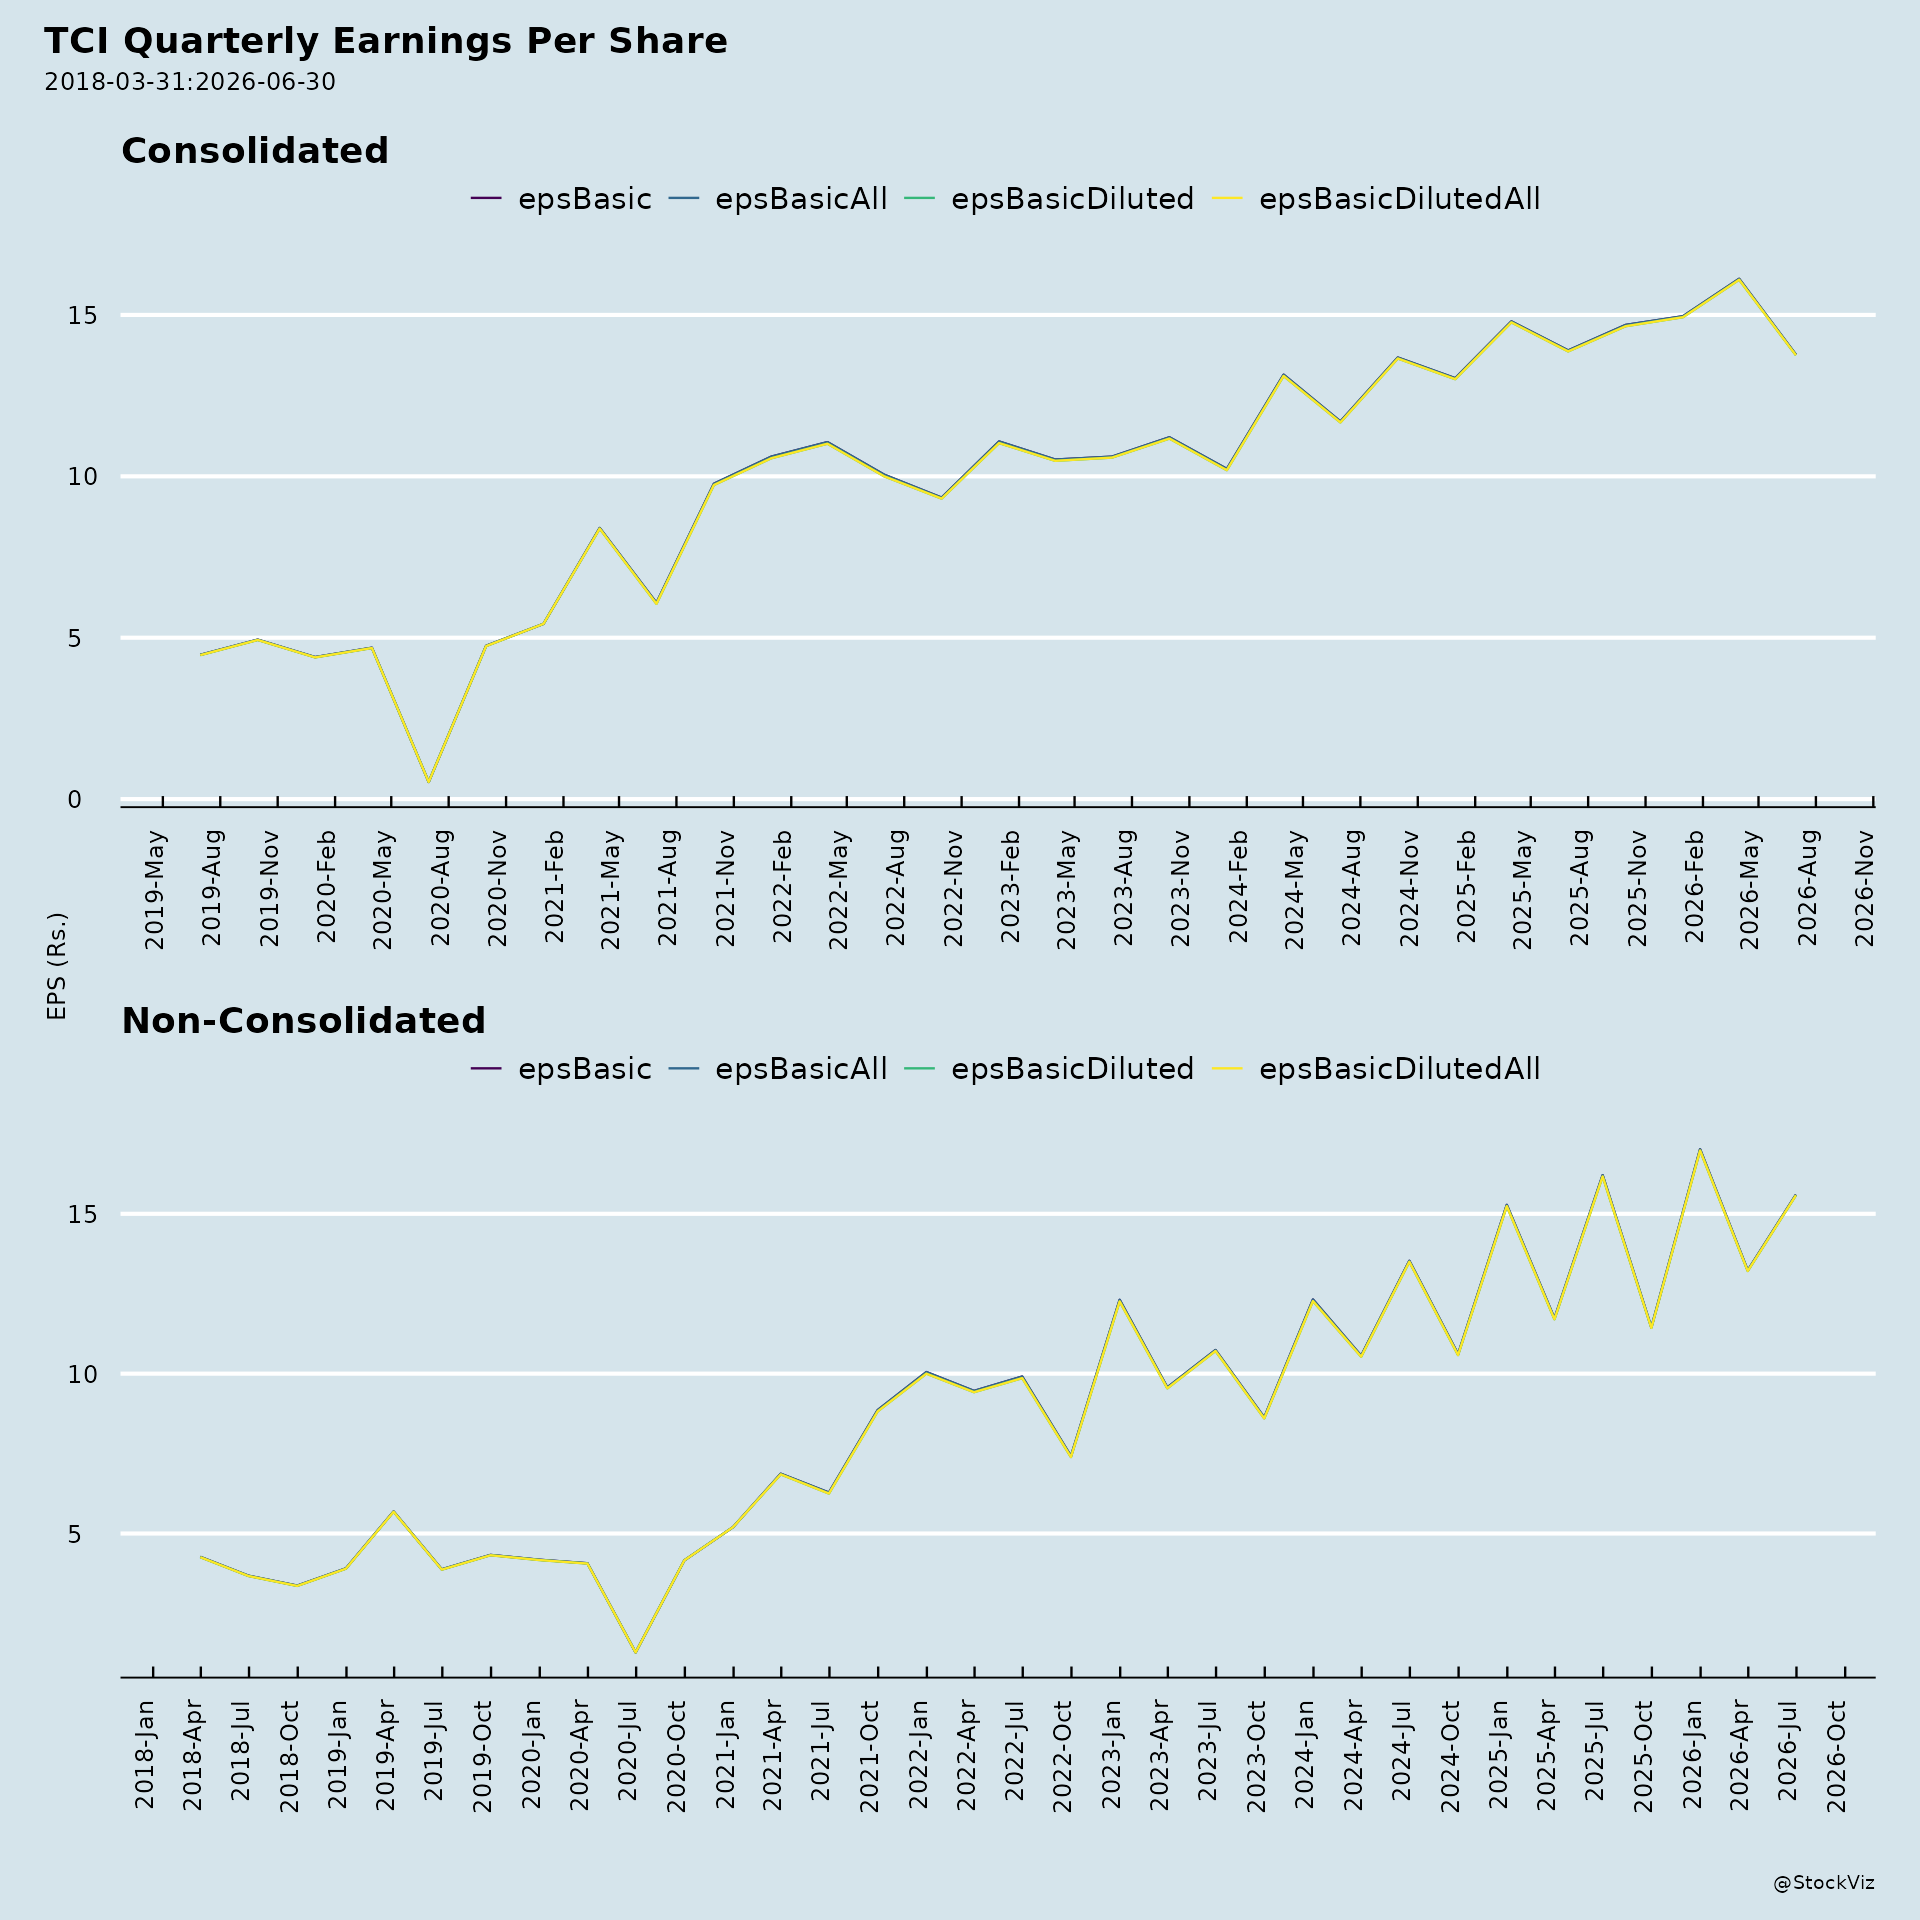
Returns. ROCE was about 23% and RONW about 20%, described as unchanged. Consolidated PAT was almost the same as last year, while standalone PAT was slightly negative in Q1, partly due to lower JV dividend receipts.
Broker Narrative
The narrative remained anchored on structural logistics growth, LTL/freight mix improvement, seaways as the highest-margin vertical, and supply chain auto recovery throughout. However, the tone shifted from early enthusiasm about capacity expansion and margin upside to late-cycle caution around margin contraction from external cost shocks (bunker, diesel, inflation) and moderated growth on high bases. Persistent themes included government infrastructure push (Sagarmala, waterways), green logistics, and technology integration, while new concerns like the West Asia crisis and fuel price volatility emerged later.
Fears that came true
- Low international freight rates and high bunker prices led to seaways margin contraction (EBIT margin fell 220bp YoY to 34.7%), contributing to multiple DISAPPOINTMENT outcomes from mid-2024 onward.
- Elevated operating costs and lag in passing on higher diesel/bunker costs caused freight segment margin pressure, aligning with DISAPPOINTMENT outcomes after July 2024.
- Supply Chain margins/RoCE remained subdued due to continued investments in warehouses and trucks, failing to deliver expected margin expansion.
- Broader inflationary pressures and the West Asia crisis weighed on margins and demand, correlating with the cluster of DISAPPOINTMENT calls from late 2024 to mid-2025.
Optimism that failed
- The expected seaways EBITDA margin of 38–40% was not achieved in the near term, with margins contracting instead to 34.7% due to higher bunker prices.
- Supply Chain revenue growth moderated on a high base, failing to sustain the prior growth momentum despite expectations of fresh auto inventory replenishment aiding recovery.
- The LTL mix improvement and freight margin improvement via multimodal adoption did not translate into EBIT margin expansion, as margins contracted 20bp YoY instead.
- Capacity expansion and new vessel additions in seaways were delayed by high ship purchase costs and dry-dock constraints, limiting the expected margin and revenue uplift.
Broker Timeline
22 broker calls · 2023-07-26 to 2026-08-03
Copyright © 2023 SAS Data Analytics Pvt. Ltd. All rights reserved.