SMARTWORKS
Equity Metrics
May 8, 2026
Smartworks Coworking Spaces Limited
Diversified Commercial Services
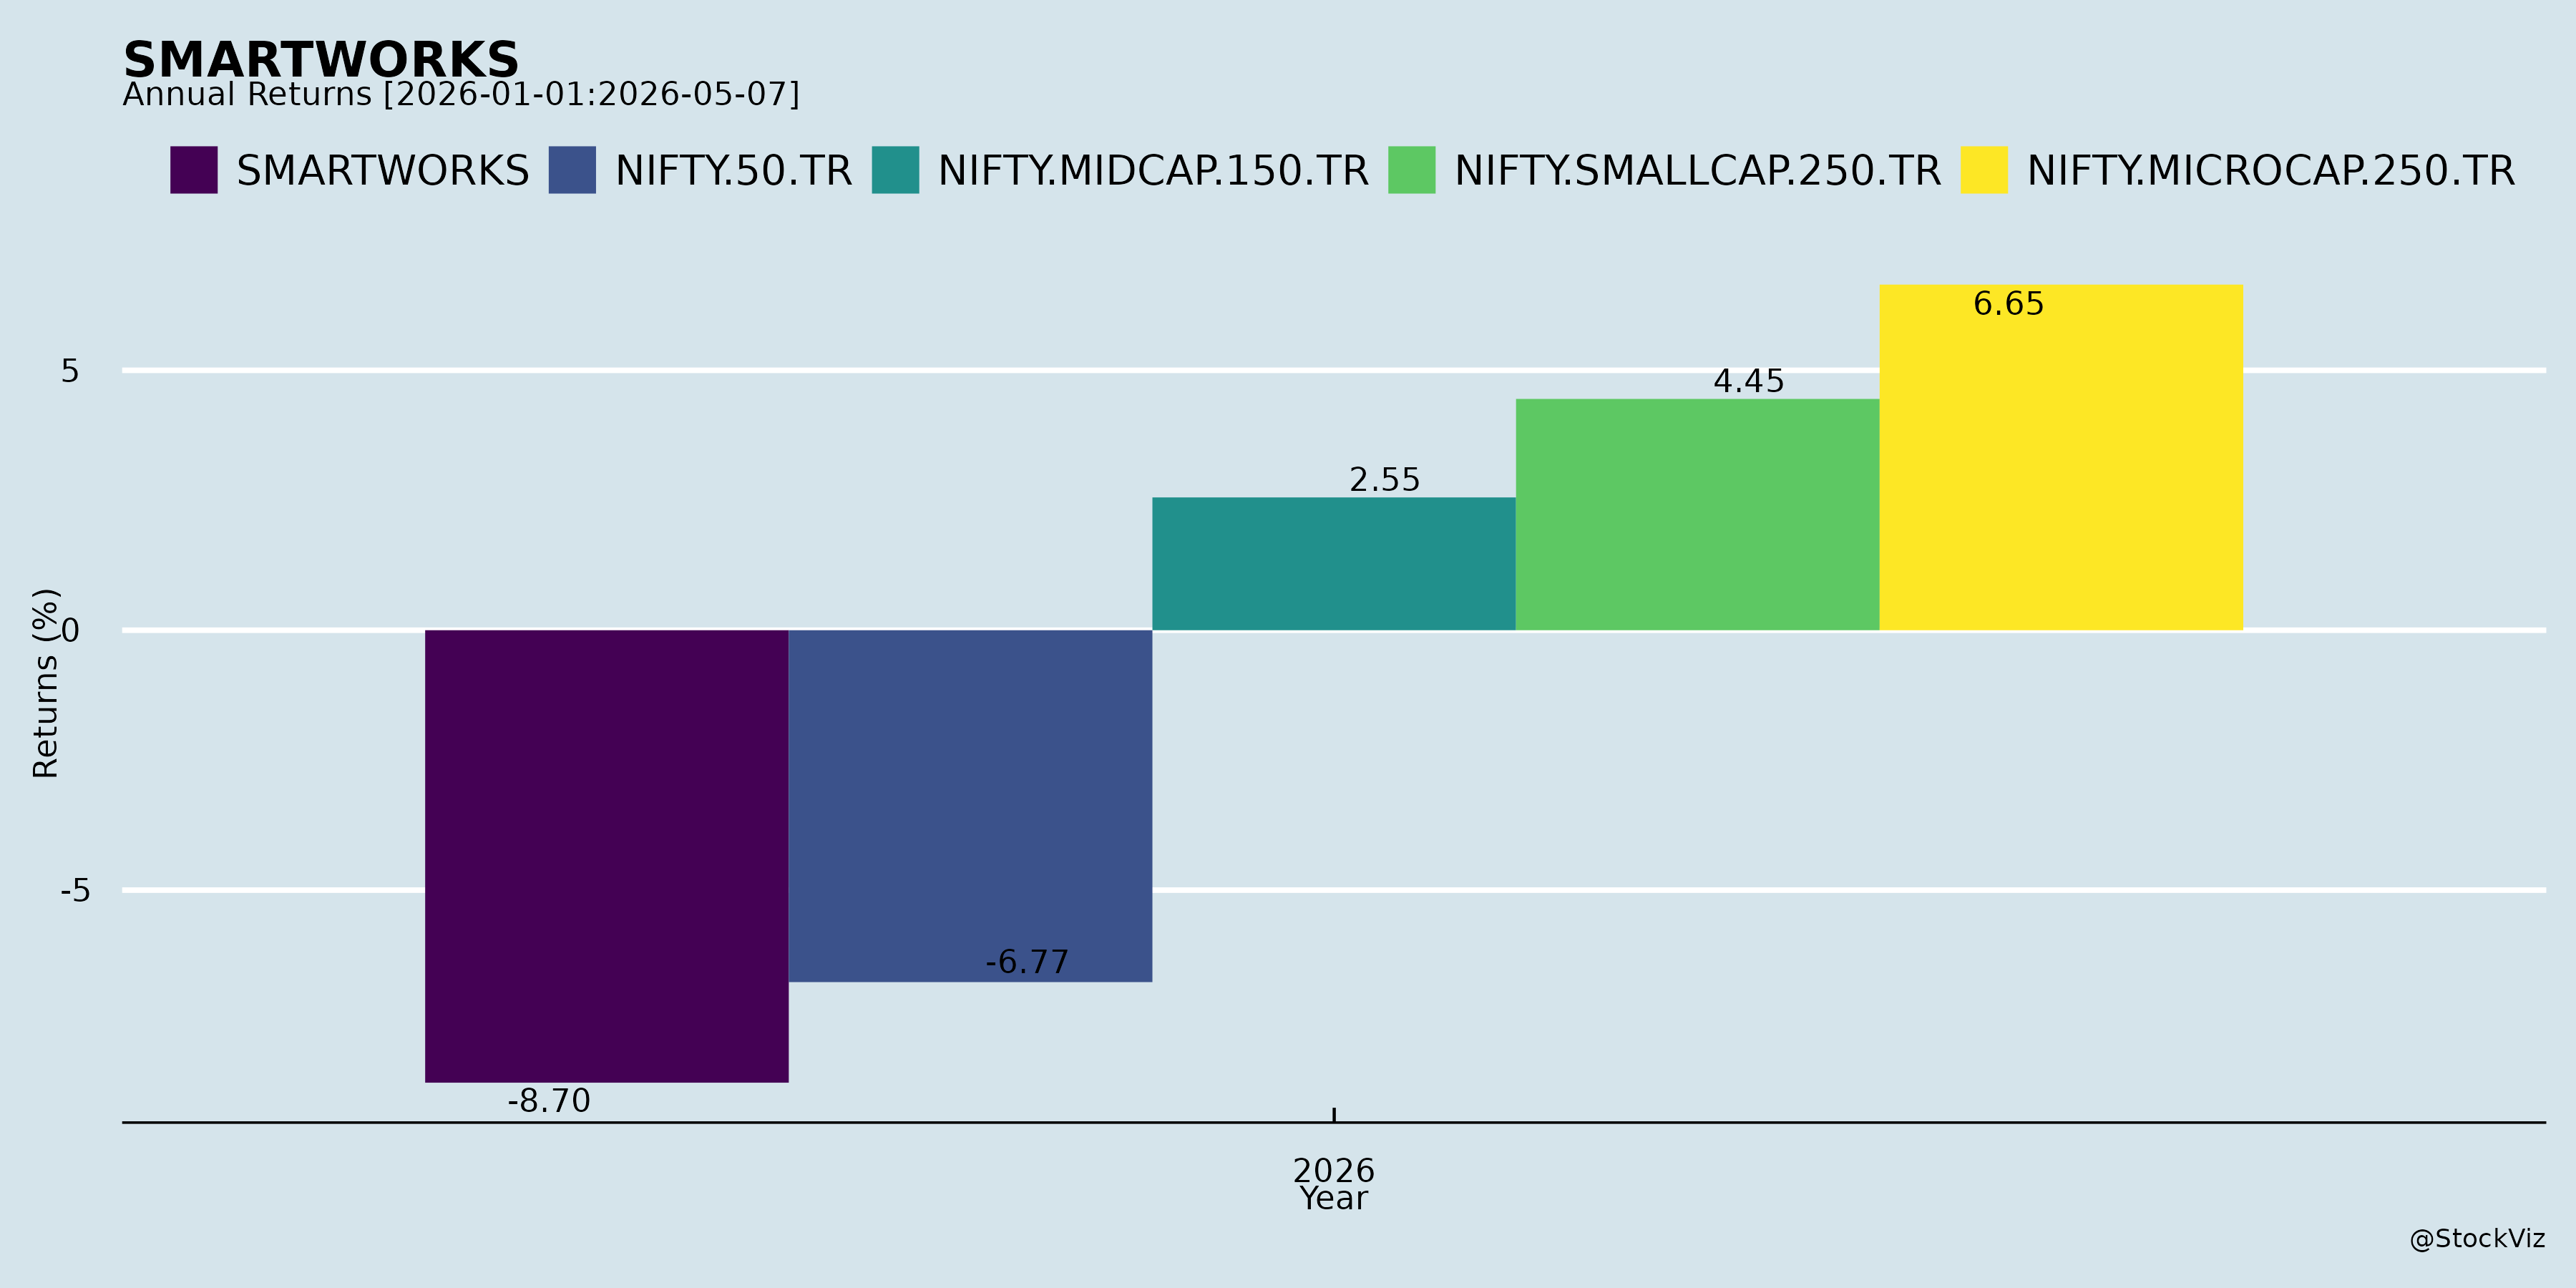
Annual Returns

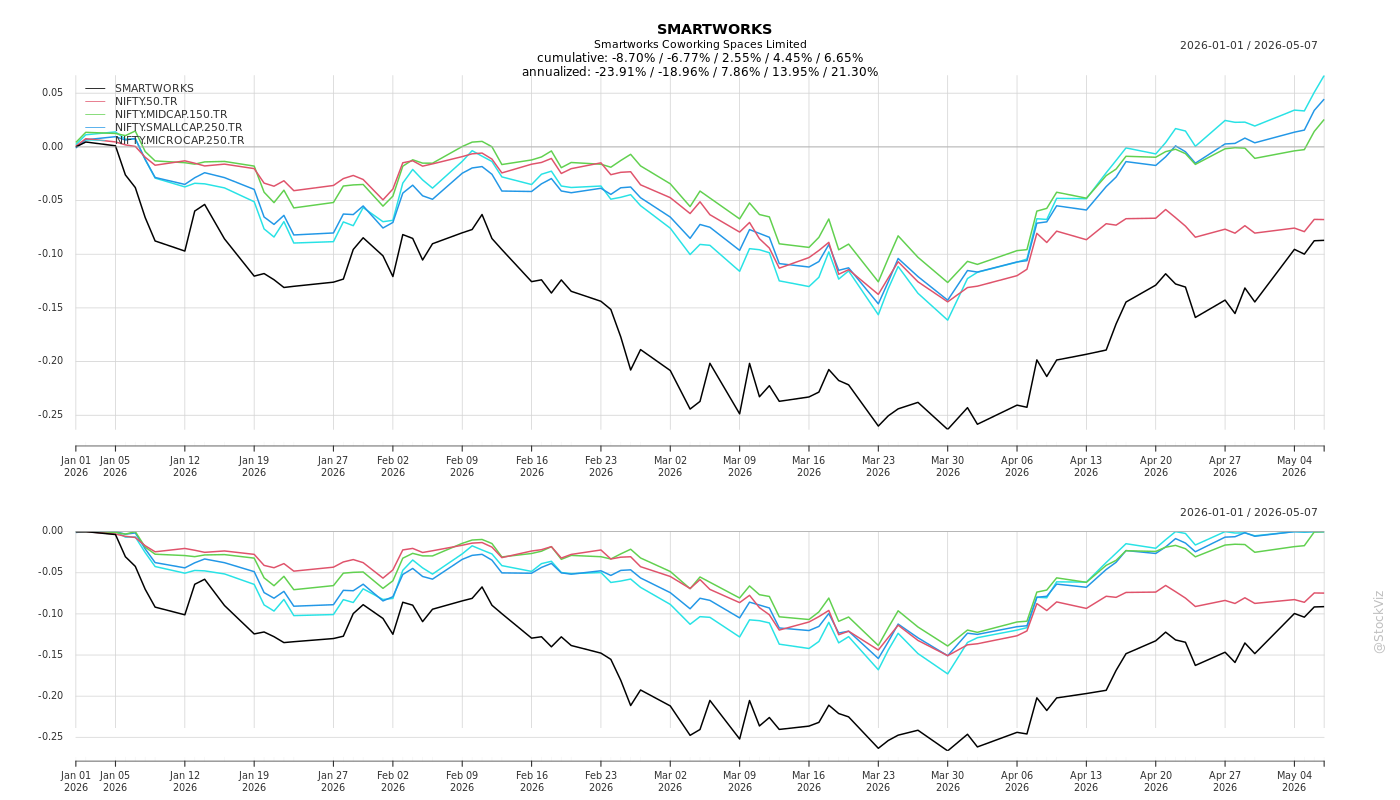
Cumulative Returns and Drawdowns
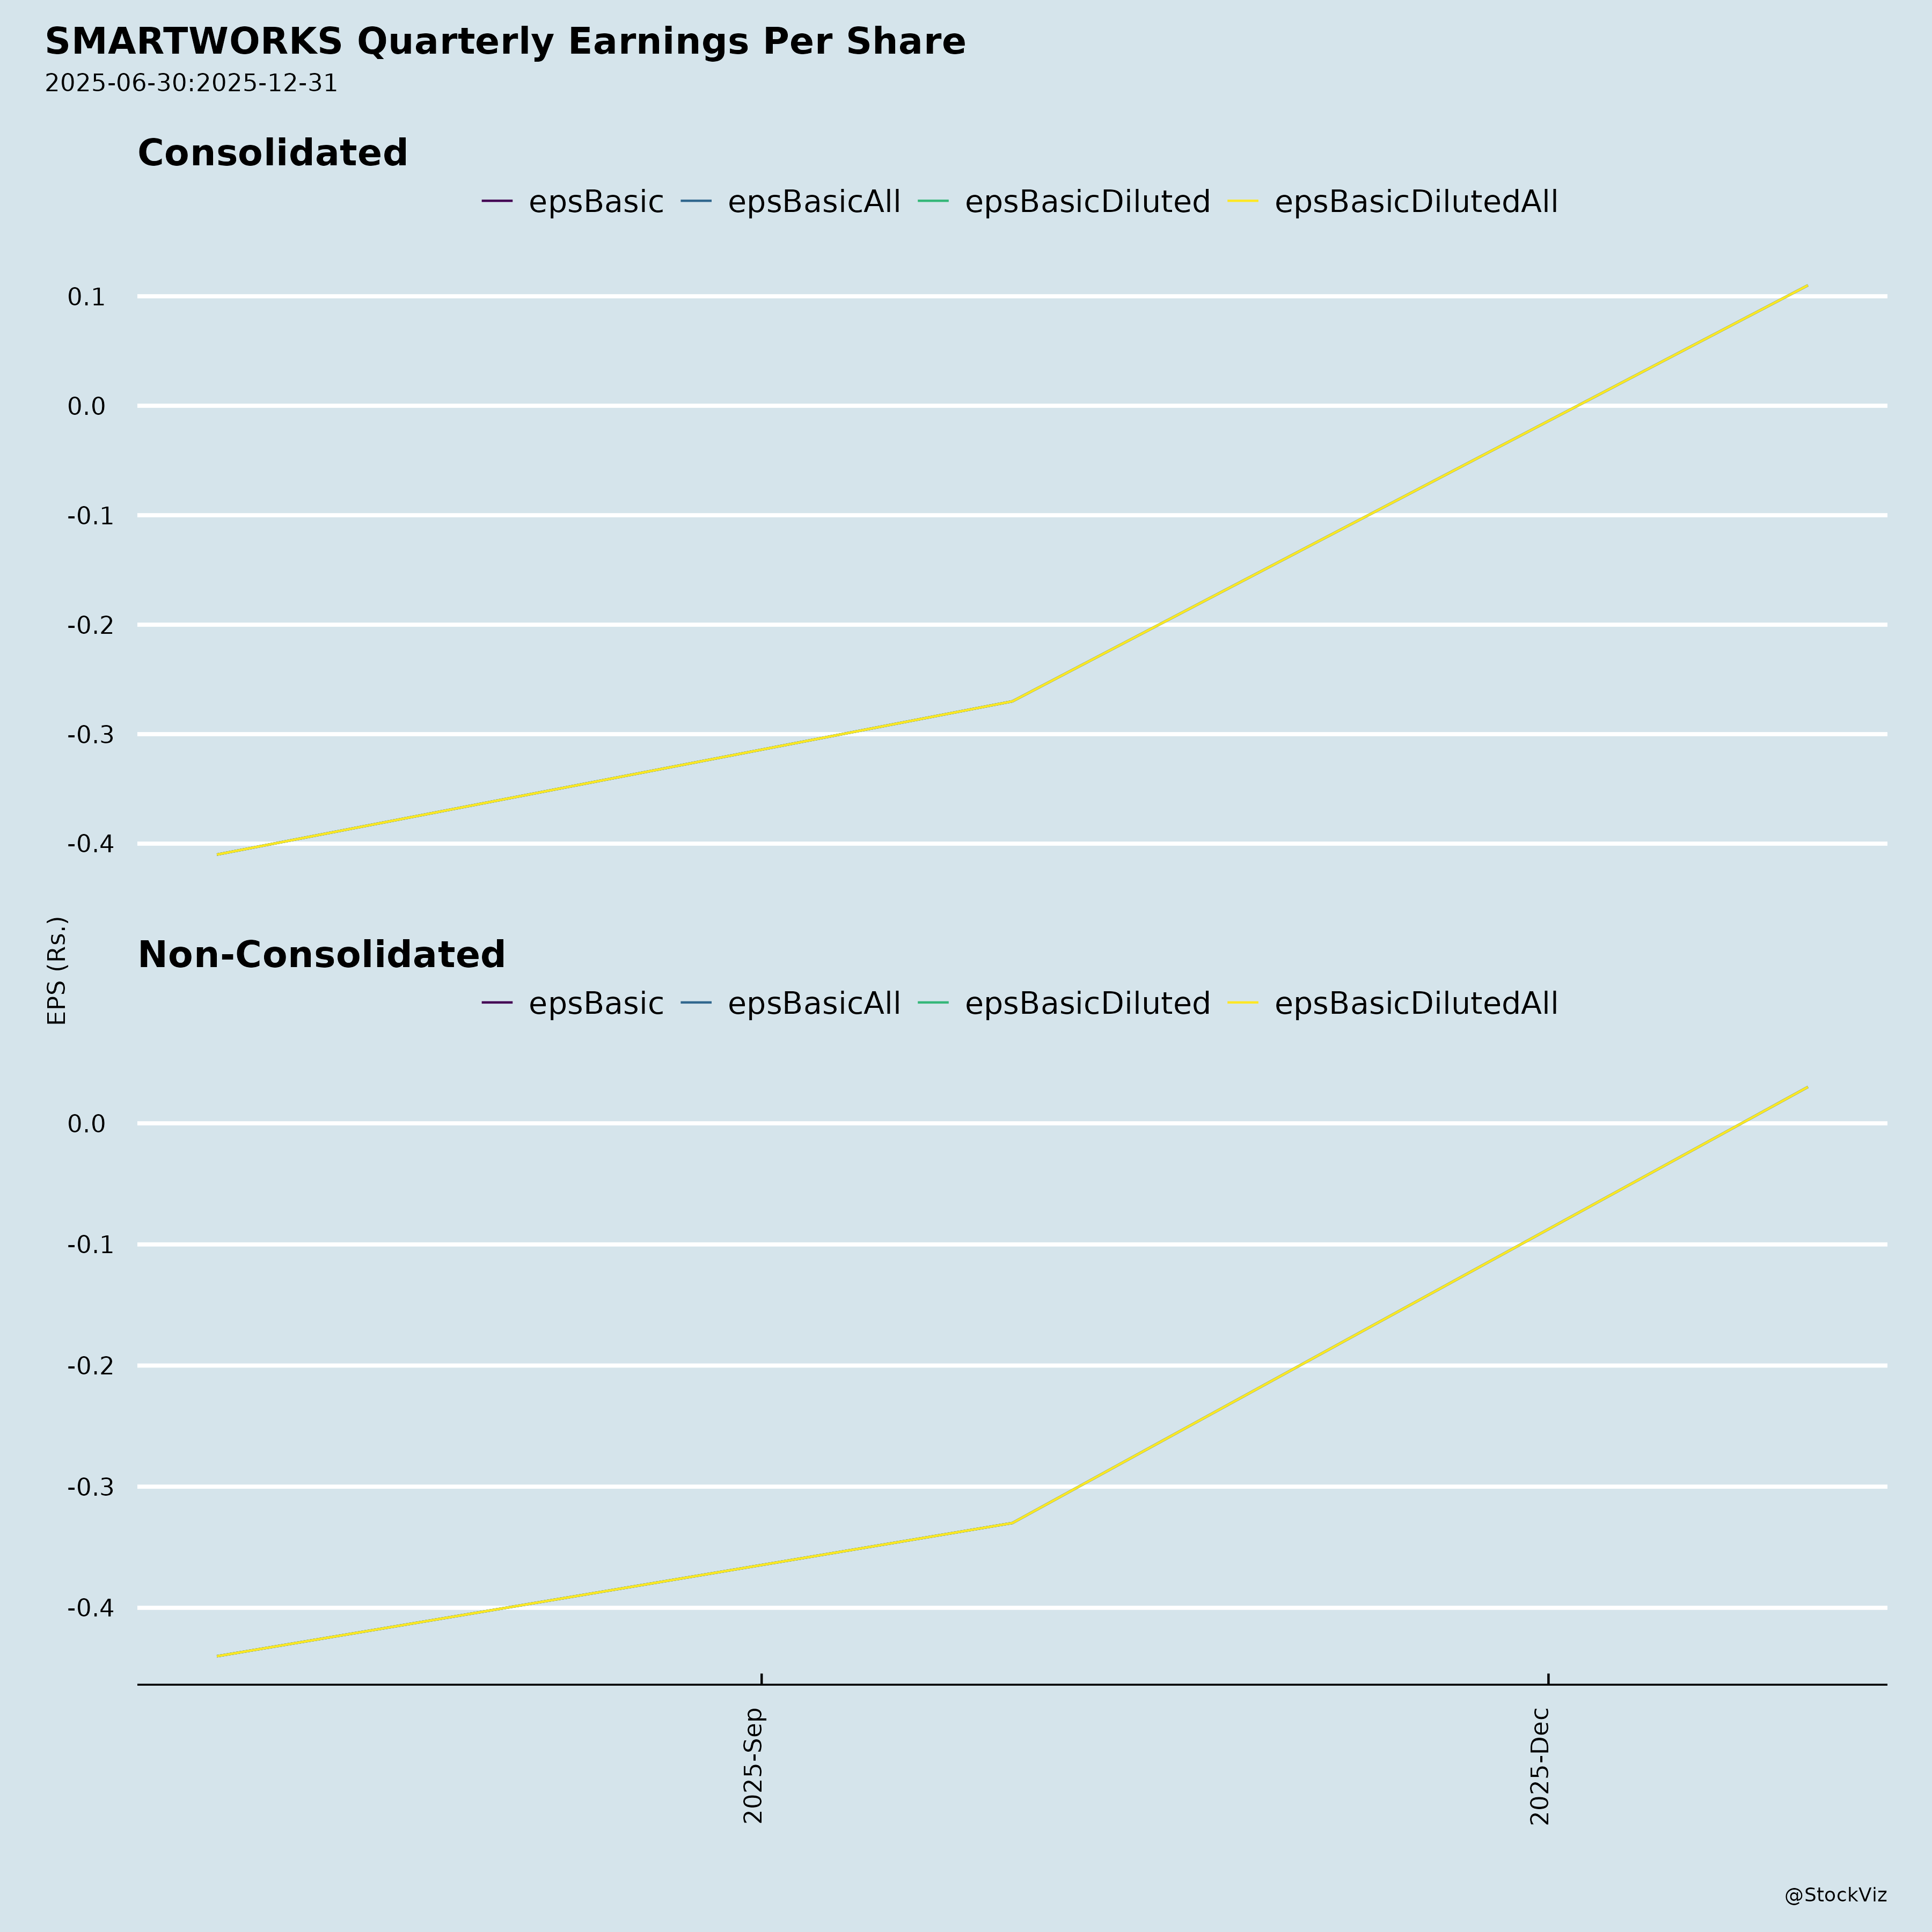
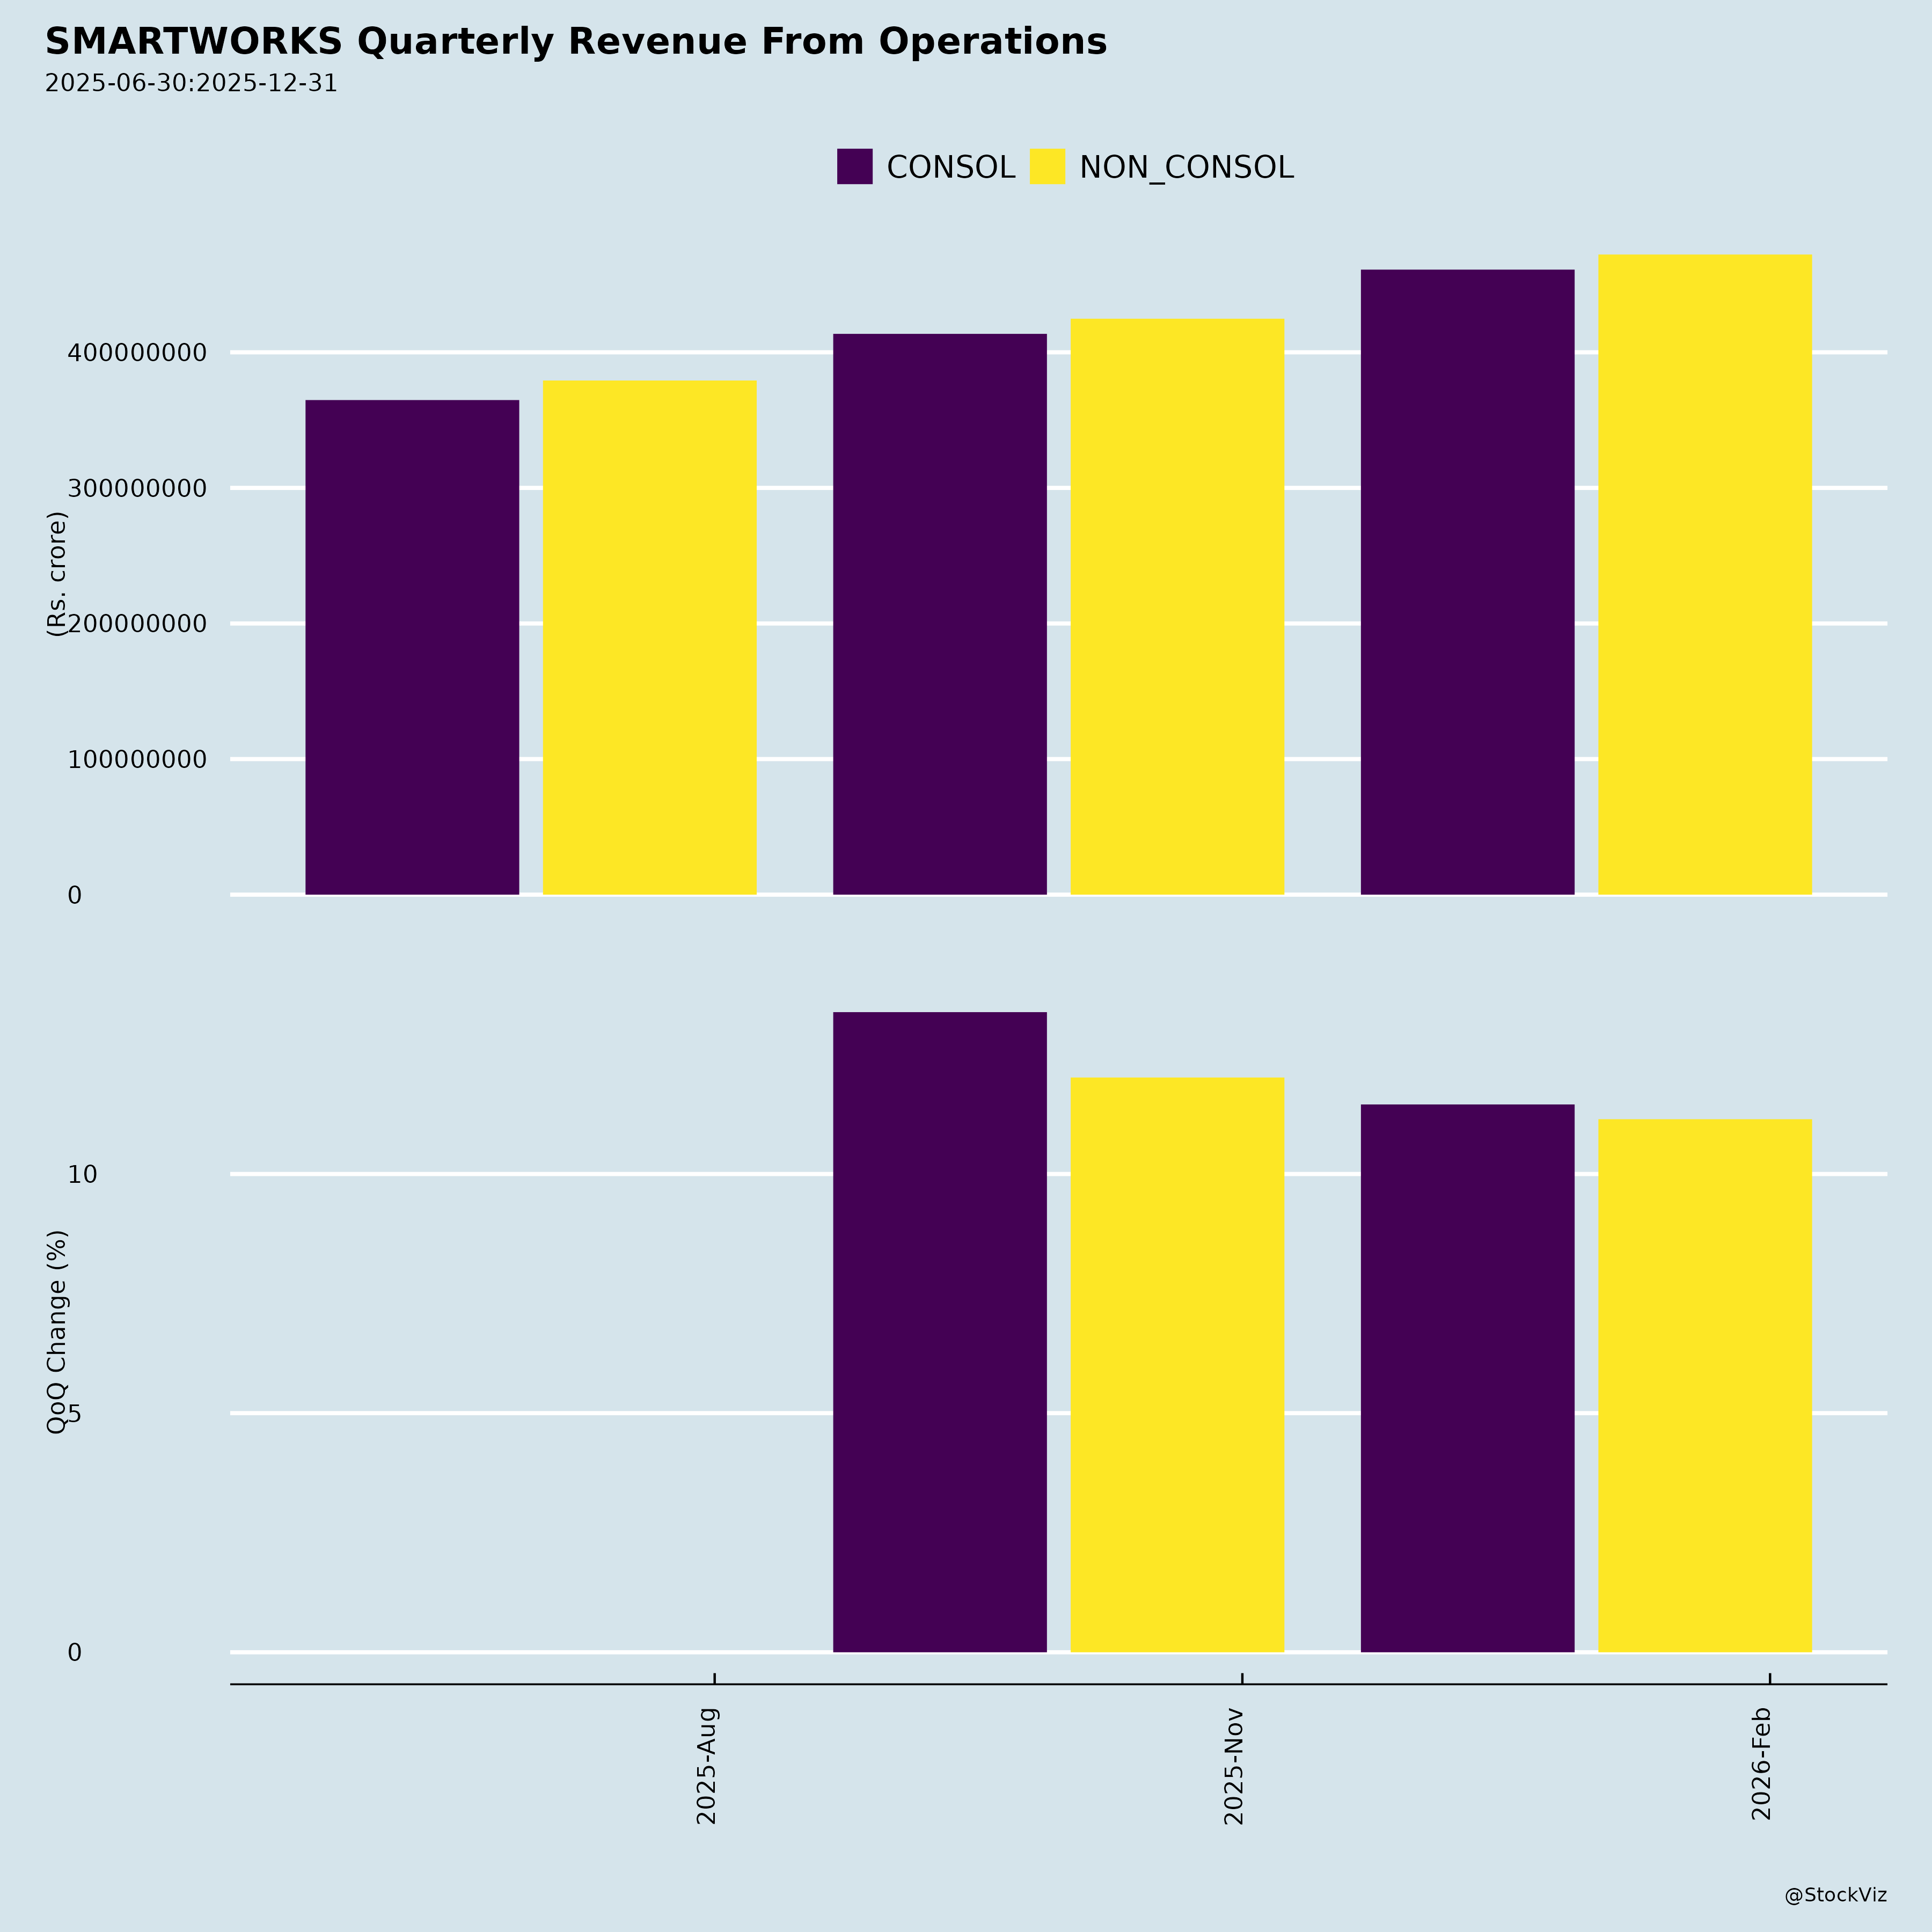
Fundamentals
Ownership
Margined
AI Summary
asof: 2025-12-08
Smartworks Coworking Spaces Limited (SMARTWORKS) – Investment Thesis & Business Analysis
As of Q2 FY26 Conference Call – November 7, 2025
Company Overview
Smartworks is India’s largest pan-India managed office platform, operating over 12.7 million sq. ft. across 14 cities and serving 760+ enterprise clients. The company operates through a standardized, tech-enabled, campus-style managed workspace model, targeting large enterprises and Global Capability Centers (GCCs). It transitioned to being a publicly listed company in FY26, with strong growth dynamics and self-sustaining operating cash flows.
1. Tailwinds (Growth Drivers)
1.1 Structural Shift in Office Demand Toward Flexibility
- Flexible workspace penetration in Grade-A offices has increased from 10% → 25% (Cushman & Wakefield), indicating a structural behavioral shift.
- Enterprises are prioritizing flexibility, speed-to-market, experience, and technology-enabled solutions over traditional long-term leases.
- Smartworks is positioned at the gold standard of managed campuses, blending design, tech, and scale.
1.2 Surge in GCC (Global Capability Center) Demand
- GCCs to drive ~40–45 million sq. ft. of new office demand in FY26–FY27.
- Smartworks sees 15% of rental revenue from GCCs today, with expectations of doubling this in 2–3 years.
- Launched SmartVantage, a dedicated platform offering workspace + staffing, compliance, legal, tax, and onboarding—making it a one-stop partner for GCCs.
1.3 High Retention of Enterprise Clients & Scaling Client Sizes
- 35% of rental revenue now comes from clients with >1,000 seats, up from 12% three years ago.
- Average tenure for large clients > 50 months, showing high client stickiness.
- Enterprises view Smartworks as a Pan-India infrastructure partner—not just a short-term office provider.
1.4 Strong Pre-fill Demand & Client-Led Expansion
- Over 30% of new capacity is pre-filled by existing clients.
- Expansion decisions are often driven by demand signals from existing clients, reducing market risk.
- Example: Vikhroli campus (815,000 sq. ft.) has 30–35% demand visibility even before handover.
1.5 Improving Unit Economics and Scalability
- Blended center-level EBITDA margin: ~23–24% (excluding corporate costs).
- Normalized EBITDA margin (after corporate): 16.4%, up from 13.4% YoY.
- CAPEX is kept low (~₹1,300/sq. ft.) due to asset-light, build-outs on demand.
- Operating leverage increasing as mature centers (>7.5M sq. ft. at 88% occupancy) become profitability engines.
1.6 Favorable Landlord Dynamics
- 24% of portfolio now from institutional landlords (DLF, Hiranandani, Tata, Panchsheel), up from 18%.
- Strong brand recognition enables securing entire buildings rather than fragmented floors, improving campus integrity and pricing power.
1.7 Net Debt Negative & Strong Cash Generation
- Net debt negative ₹59 crores, reducing gross debt by ~45% post-IPO.
- Normalized operating cash flow: ₹62 crores, OCF/EBITDA ~1x.
- Security deposit arbitrage: Clients pay deposits upfront, offsetting landlord deposits and funding CAPEX.
1.8 Capacity Visibility and Long-Term Supply Pipeline
- 14 million sq. ft. signed and in pipeline, with 100% FY26/FY27 supply visibility.
- FY28 sourcing already underway.
- 1M sq. ft. of new supply + 1.4M sq. ft. of existing centers maturing in H2 FY26, driving revenue growth and margin expansion.
2. Headwinds (Challenges & Near-Term Concerns)
2.1 Decline in Retention Rate (from 94.5% → 74%)
- Due to expiration of low-rent, long-term contracts signed during 2020–21 (COVID phase).
- Management calls this “healthy churn” – exiting below-market deals and re-leasing at higher rates.
- However, such churn could persist over next 2–3 quarters as more legacy contracts expire, potentially pressuring reported retention.
- Commitment occupancy (88%) remains strong, mitigating revenue risk.
2.2 Blended Occupancy Below Mature Centers
- Blended occupancy: ~81%, vs. mature centers: 88%.
- Expansion into new and under-construction centers has diluted the overall figure.
- The gap is temporary but will drag center-level margins until ramp-up completes (~12–14 months typical maturity cycle).
2.3 CAPEX and Cash Flow Mismatch in Near Term
- Heavy security deposit outflows (~2M sq. ft. secured in Q2) for centers that will hand over in FY27.
- This creates negative OCF impact in the short term, though it’s strategic and reversed as client deposits come in.
- Risk: Working capital strain if ramp-up delays occur due to macro or demand shocks.
2.4 Regional Supply Constraints in Mature Markets
- Bombay, Gurgaon, Delhi have limited availability of large-format, stand-alone buildings.
- Demand exists, but execution depends on finding suitable mega-campuses.
- However, management believes their model mitigates this by converting smaller clusters into large centers.
2.5 Decline in City Count (15 → 14)
- Withdrew from Jaipur (49,000 sq. ft.) due to scalability constraints of existing facility.
- Indicates selective exit when asset size doesn’t support long-term growth targets.
- Not a major headwind, but underlines barrier in smaller cities without large assets.
3. Growth Prospects
| Metric | Current | Near-Term Outlook |
|---|---|---|
| Revenue Growth | ₹425 crores (Q2 FY26, +21% YoY, +12% QoQ) | Aiming for >30% annual growth; strong tailwinds support acceleration in H2 FY26 |
| Capacity Growth | 12.7M sq. ft. | +2.4M sq. ft. in H2 FY26, with full visibility |
| GCC Revenue | 15% of rental | Expected to double in 2–3 years; SmartVantage to drive this |
| EBITDA Margin | 16.4% | Set to expand due to operating leverage, center maturity, lower corporate costs |
| ROCE | 14.3% | Expected to double in 2 years; industry-leading efficiency |
| City Expansion | 14 cities | Focused on Tier-1 cities with large buildings, with targeted entry into new Tier-2 markets |
Long-Term Vision
- Scale to ~15–16M sq. ft. with 12M+ sq. ft. in mature centers (~80%+ occupancy).
- Self-sustaining CAPEX model: No external funding needed for 25–30% growth.
- Transition from growth phase to sustainable high-margin scale profitability.
4. Key Risks (Forward-Looking)
| Risk | Nature | Mitigation |
|---|---|---|
| Macro demand slowdown | Economic downturn could delay GCC expansions or corporates downsizing real estate | High committed occupancy (88%) provides buffer; clients stick long-term |
| Competition from traditional landlords or other operators | Rivals offering flex services or landlords offering managed spaces | Smartworks’ large campus model, tech, pan-India scale, and GCC partnerships create high entry barriers |
| Ramp-up delays in new centers | Construction delays, slower leasing than expected | Leasing begins pre-handover; 30–35% pre-fill reduces risk |
| Overestimation of GCC growth | If foreign investment into India slows | Diversified across BFSI, IT, healthcare; GCC penetration still early stage |
| IND AS 116 accounting impact | Leases create non-cash provisions, depressing reported PBT | Management expects normalized and reported profits to converge over time |
| Dependence on large corporate clients | Concentration risk in top clients | Portfolio diversified across sectors; clients are sticky and long-term |
5. Summary (Investment Perspective)
✅ Strengths & Why Invest
- Market leader in institutional-grade flexible office space with strong ESG and scalability.
- Structural tailwinds: GCC boom, hybrid work, corporates shifting to managed models.
- High predictability: 88% committed occupancy, long leases, enterprise base.
- Asset-light and capital-efficient: High ROCE (14.3%), net debt negative, strong OCF.
- Margin expansion path through operating leverage and scale.
- Strategic product innovation via SmartVantage positions it as a GCC ecosystem enabler.
⚠️ Concerns & Watch-Outs
- Temporary suppression of retention rates and blended occupancy due to legacy contract churn.
- Short-term cash outflows for deposits may pressure net cash, despite being strategic.
- Geographic concentration in Tier-1 cities limits diversification.
- Need to secure large-format buildings consistently to sustain exponential growth.
Final Verdict: Bullish Long-Term, with Near-Term Inflation of Costs and Churn
Rating: BUY
Target Horizon: 2–3 Years
Smartworks is at an inflection point—leveraging its scale, brand, and institutional credibility post-listing to capture the transformation of India’s office ecosystem. While near-term metrics like retention and cash flow may be subdued, the core demand strength, GCC focus, and margin trajectory support a multi-year growth story. The company is well-positioned to become the default Pan-India infrastructure provider for enterprise and GCCs, with a path to sustainable double-digit ROCE and EBITDA margins >20%.
Data Sources: Q2 FY26 Earnings Transcript, Investor Presentation, Shareholder Letter (implied), Management Commentary
Last Updated: November 12, 2025
Copyright © 2023 SAS Data Analytics Pvt. Ltd. All rights reserved.