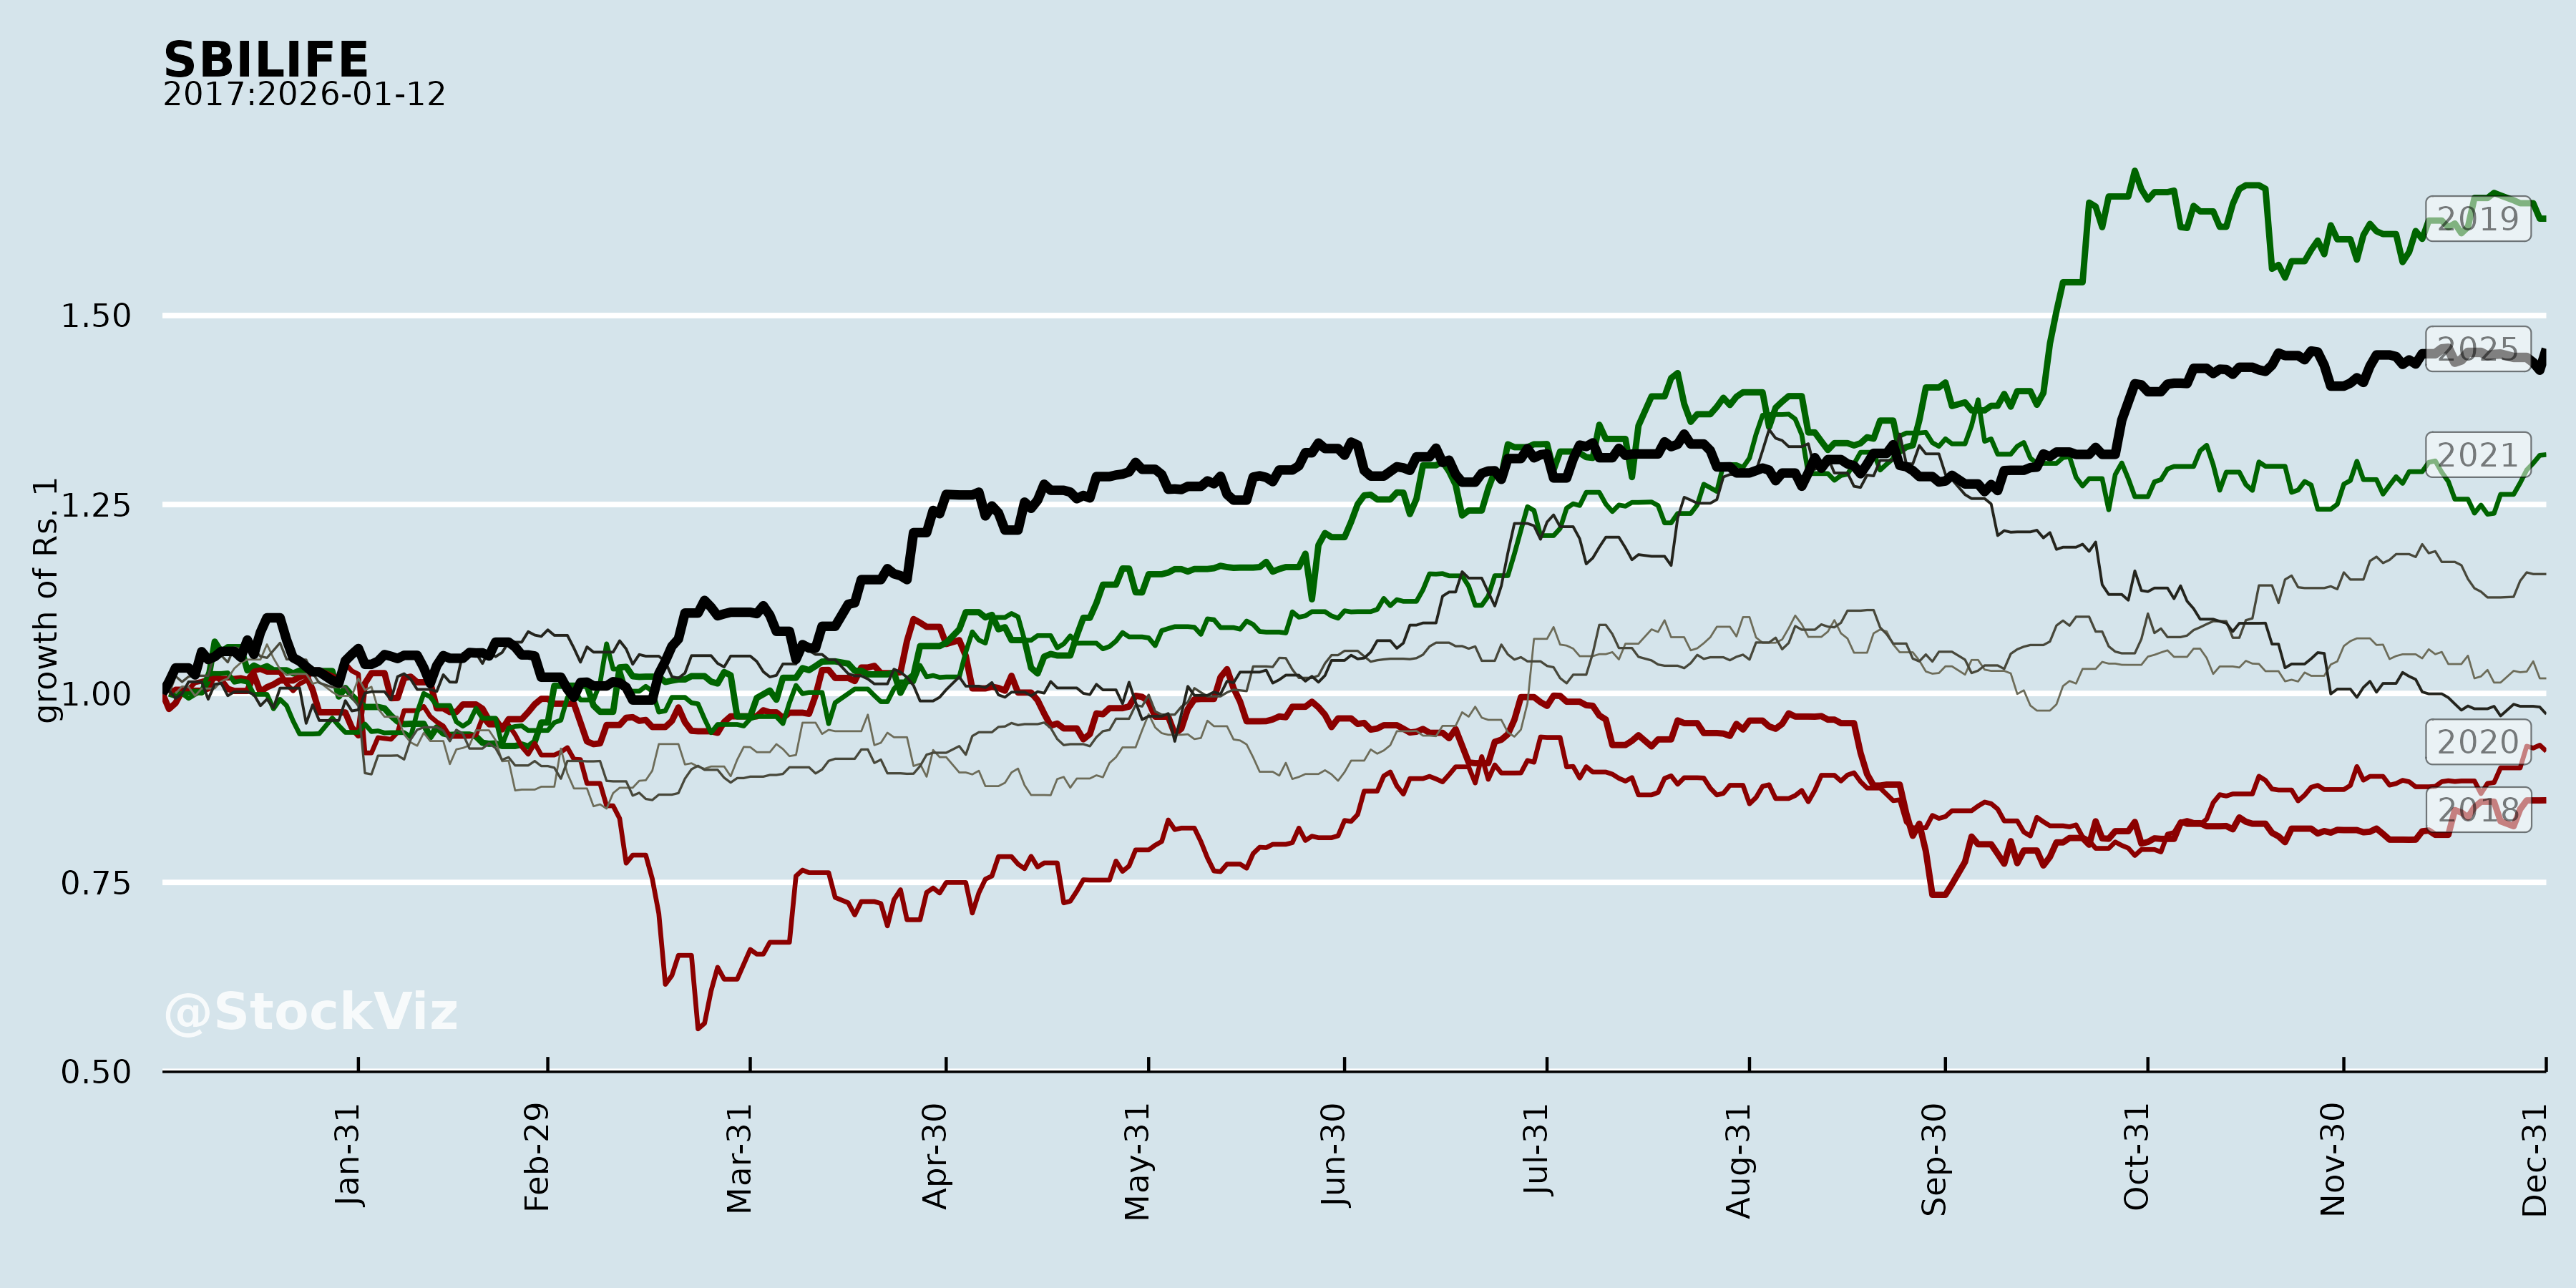
SBILIFE
Equity Metrics
January 13, 2026
SBI Life Insurance Company Limited
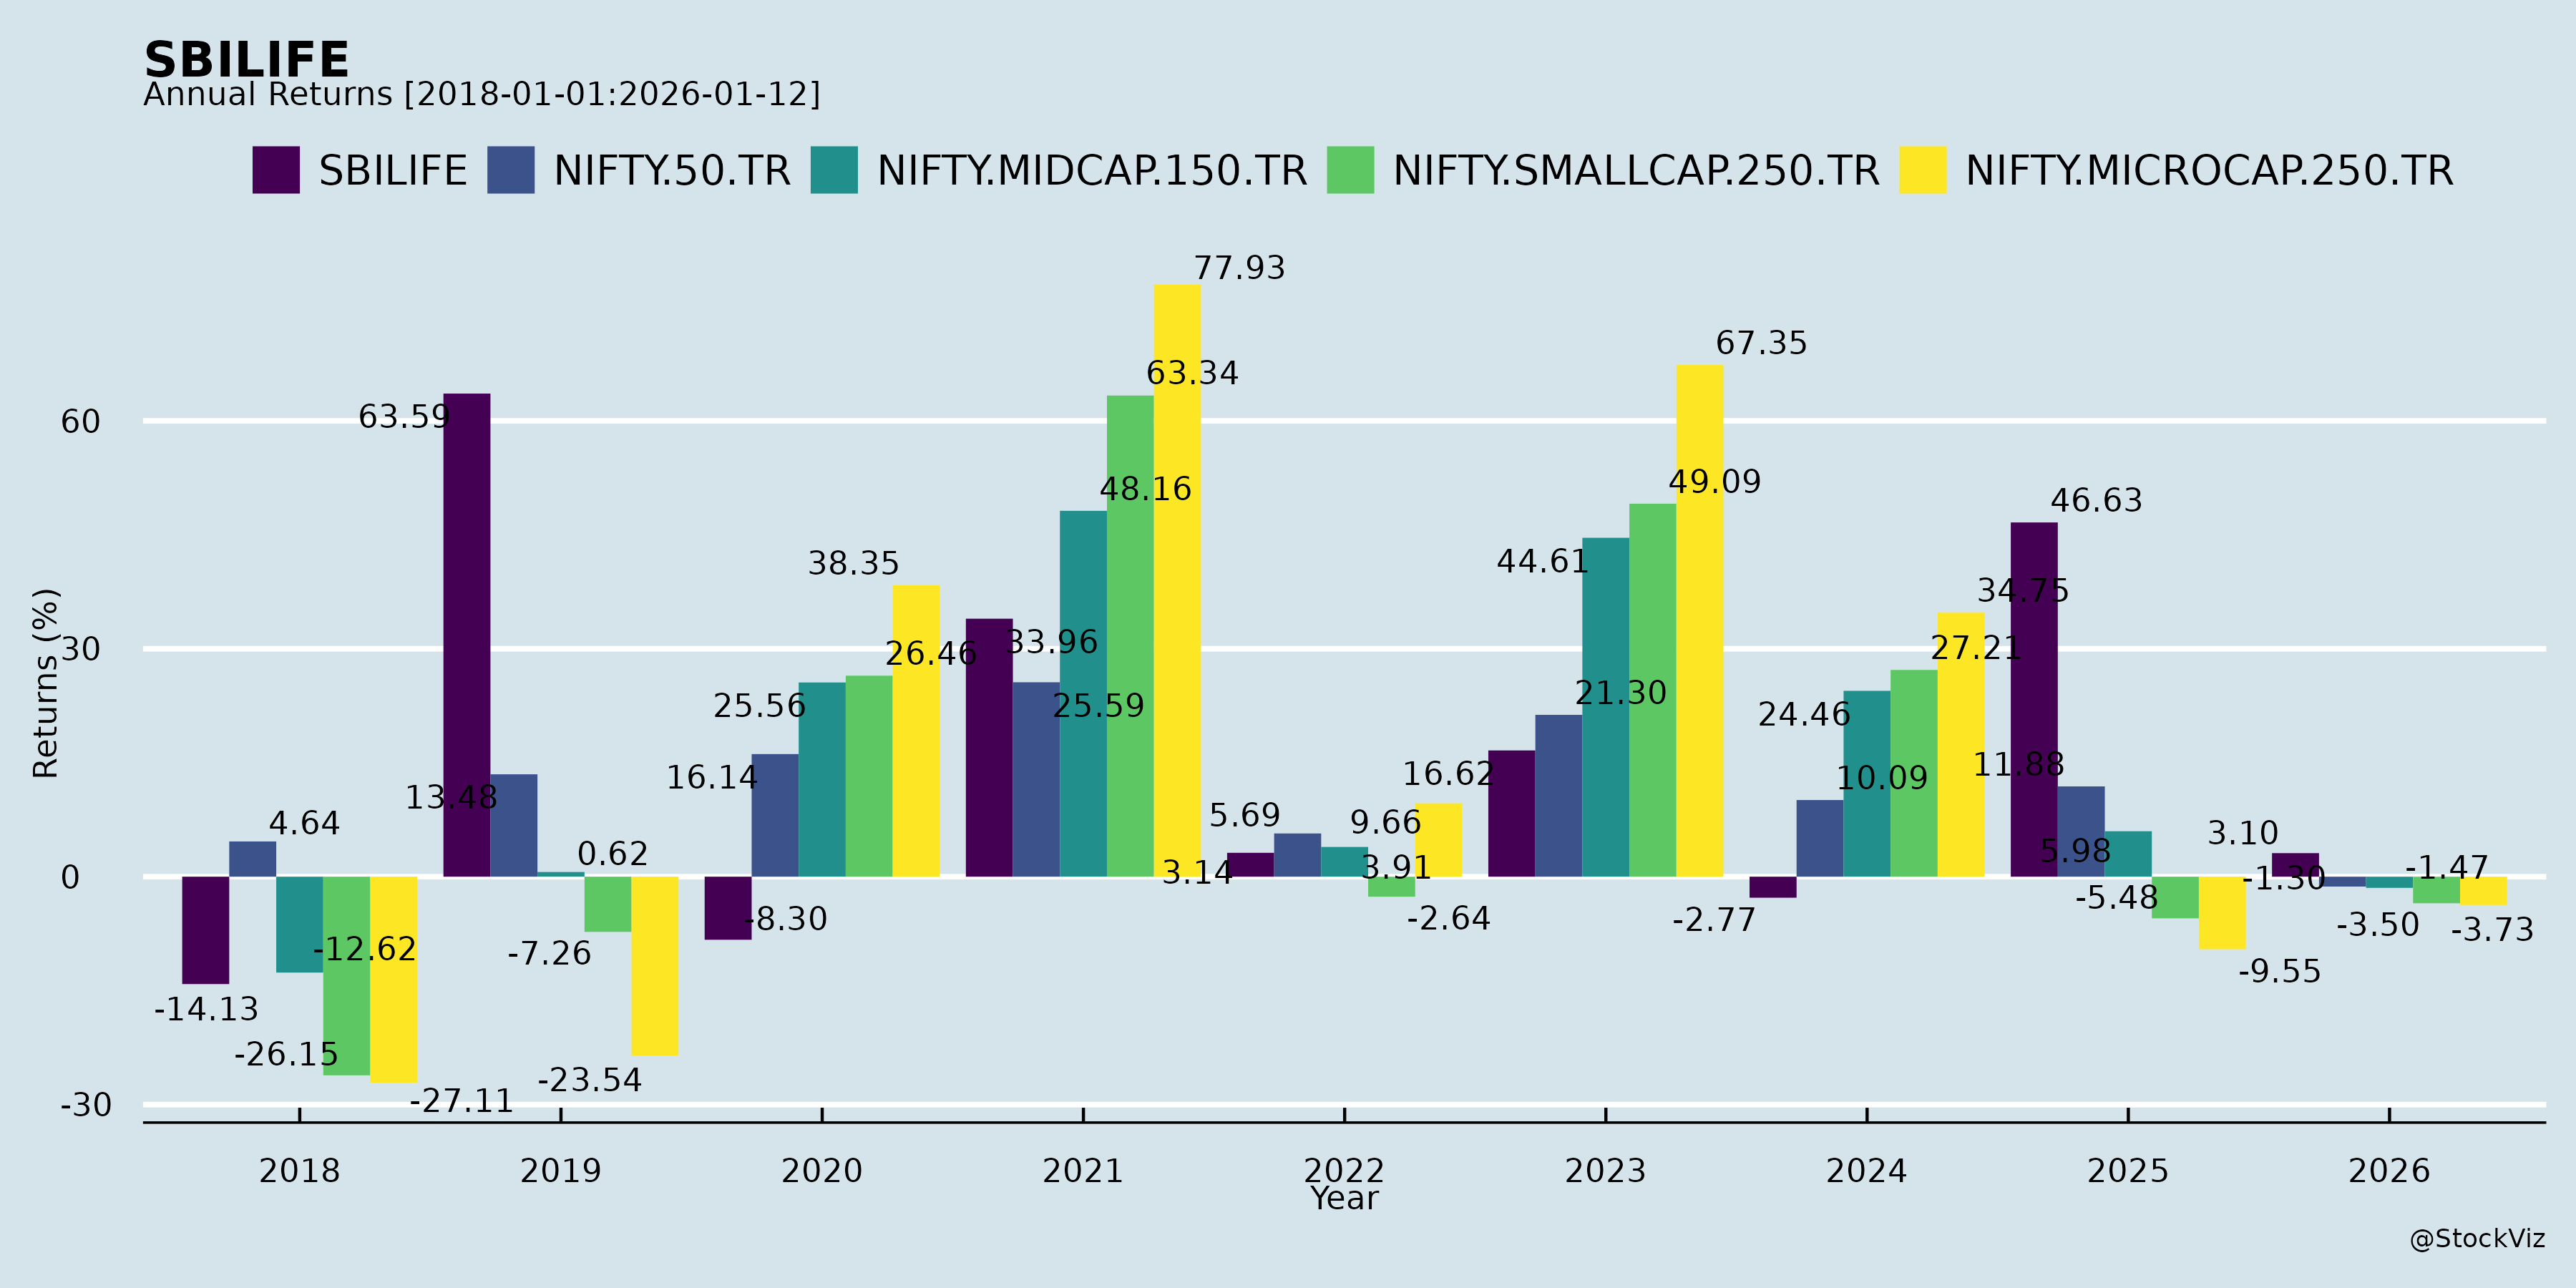
Annual Returns
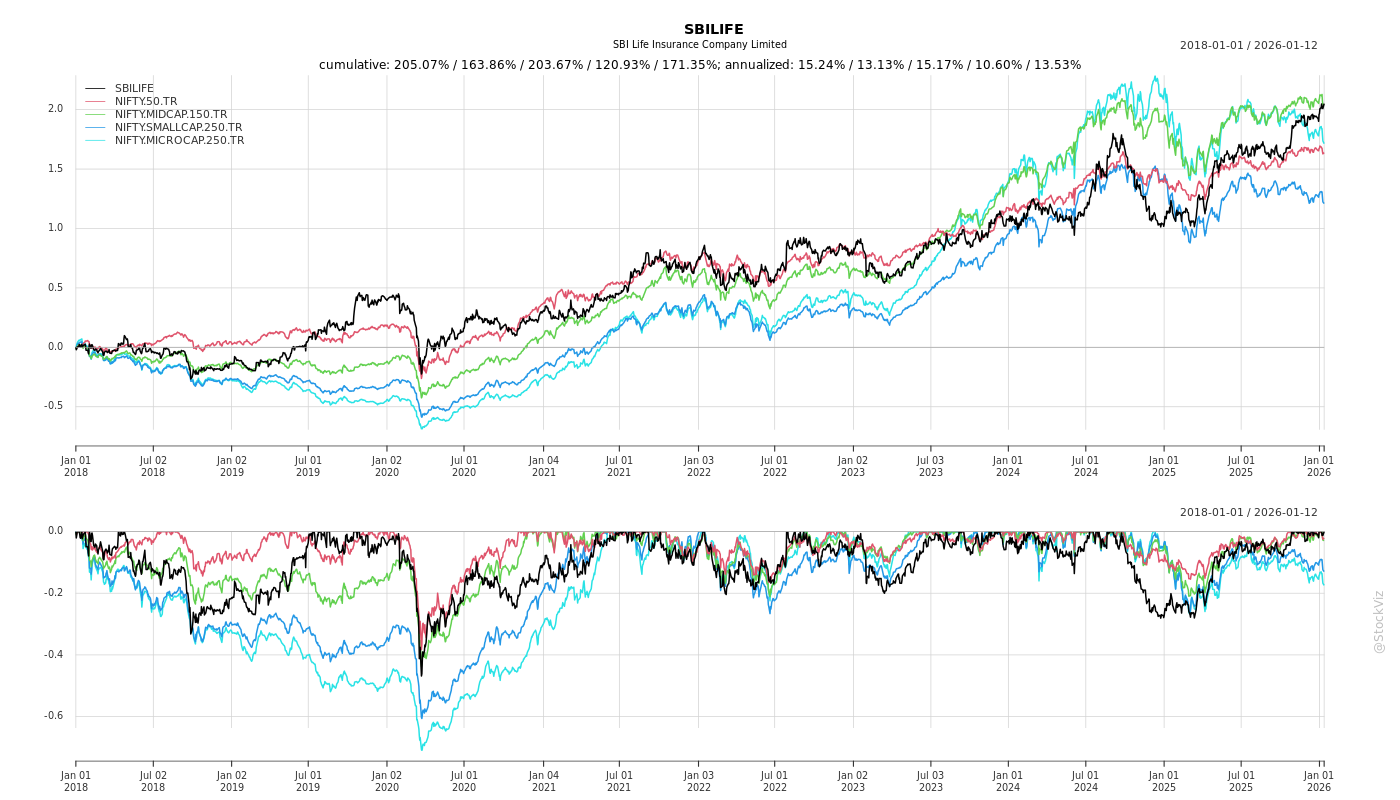
Cumulative Returns and Drawdowns
Fundamentals

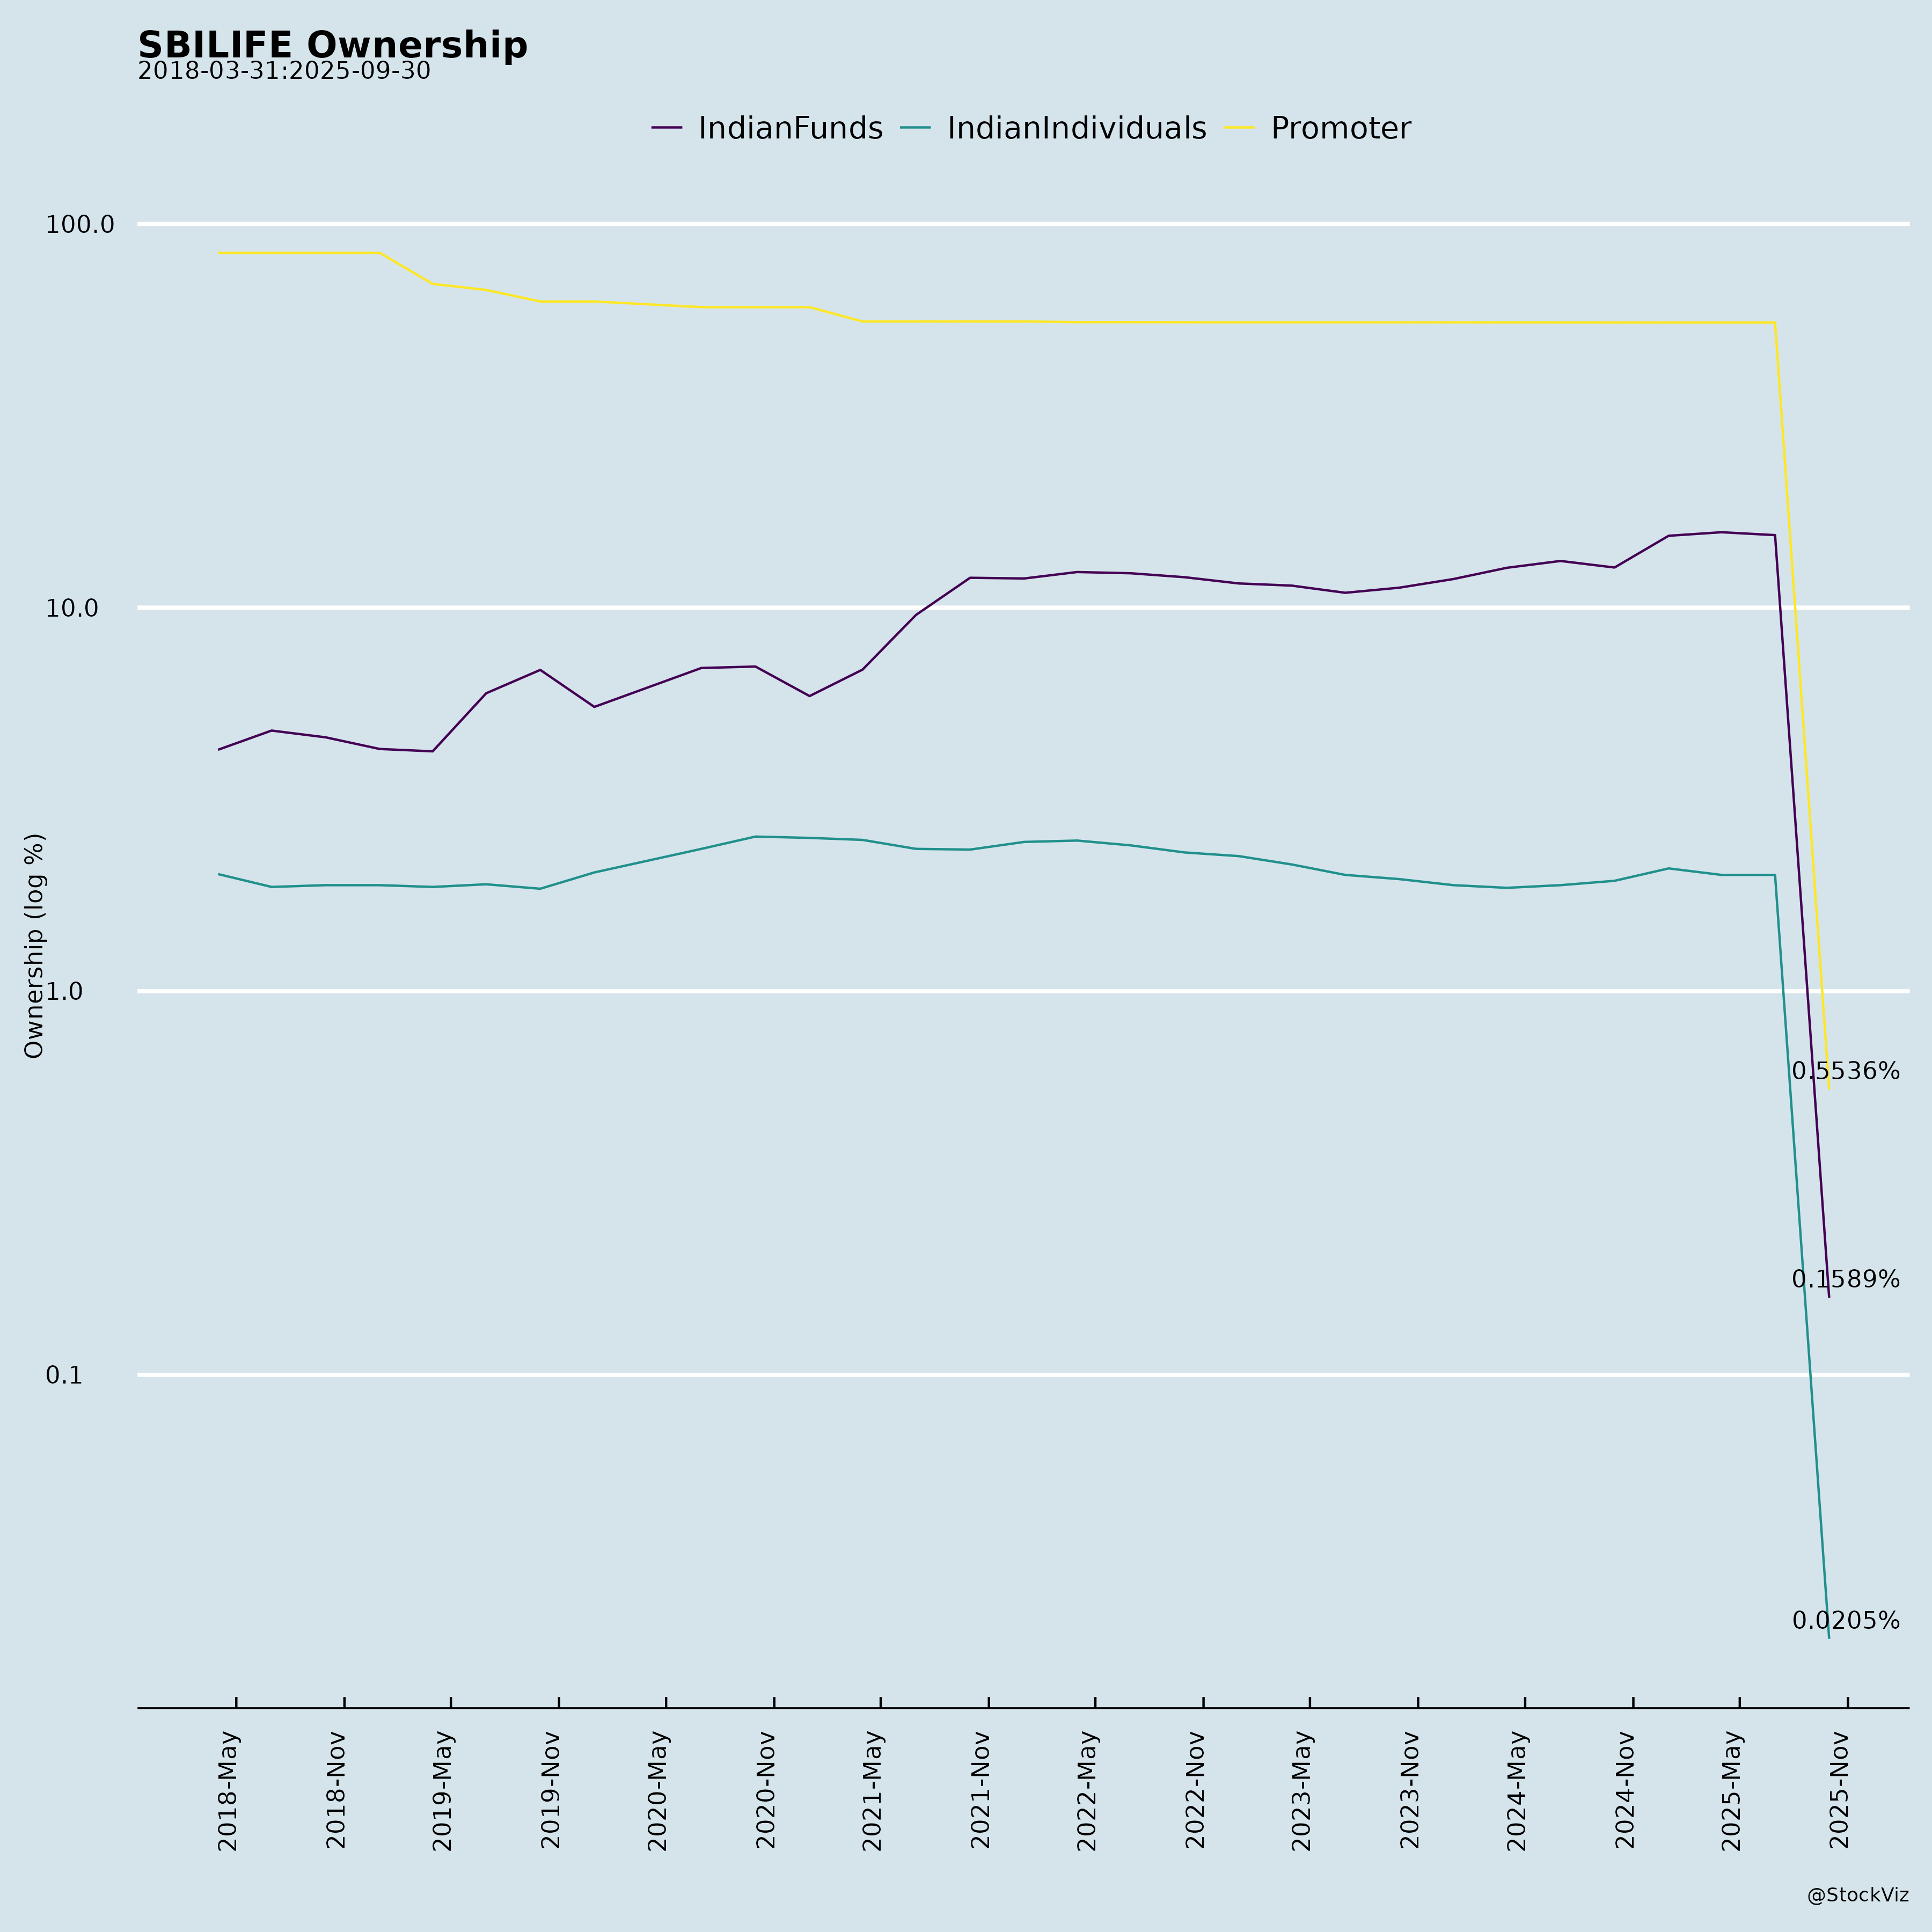
Ownership
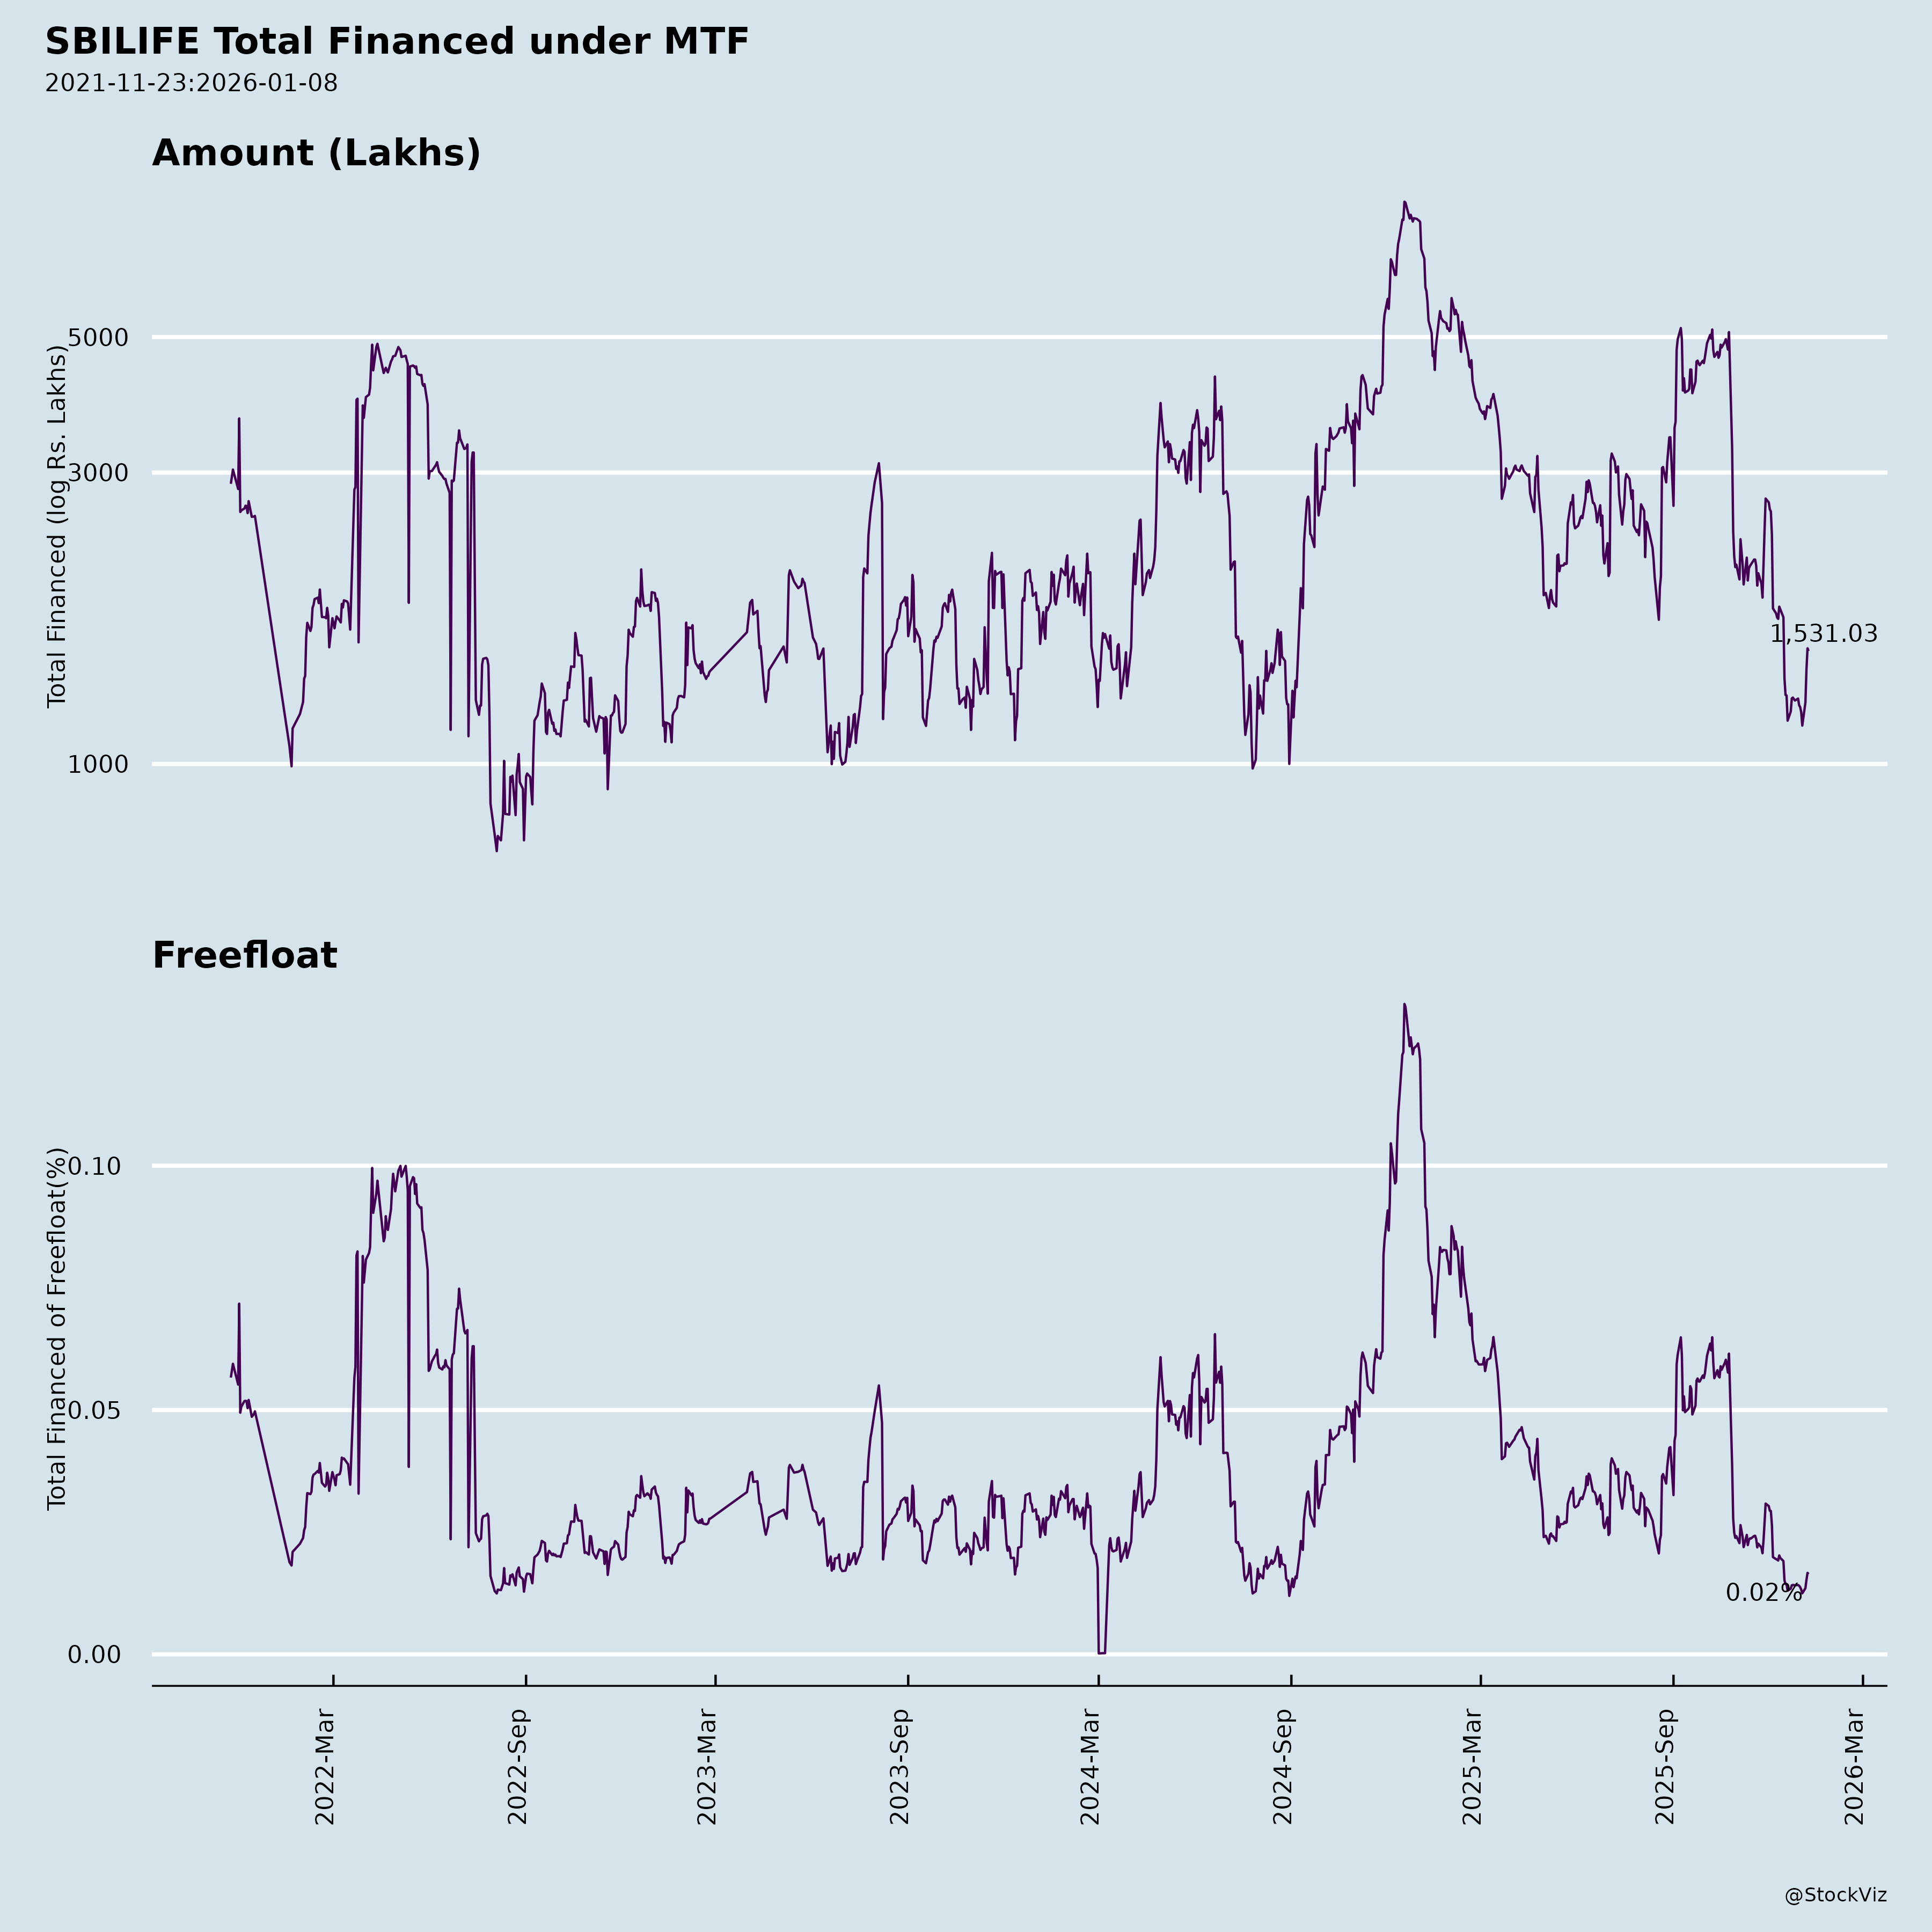
Margined
AI Summary
asof: 2025-12-03
SBILIFE Analysis: Headwinds, Tailwinds, Growth Prospects, and Key Risks
SBI Life Insurance Company Limited (SBILIFE), a leading private life insurer in India, demonstrated resilient H1 FY26 performance amid a competitive and regulatory environment. Key metrics include GWP up 19% YoY to ₹429 Bn, APE up 10% to ₹99.2 Bn, PAT up 4% to ₹10.9 Bn, VoNB up 14% to ₹27.5 Bn (27.8% margin), IEV up 15% to ₹760 Bn, and AUM up 10% to ₹4.8 Tn. It maintains 22.6% private market share in Individual Rated Premium (IRP) and robust solvency of 1.94x. Below is a structured summary based on the provided documents (financial results, disclosures, press release, investor presentation).
Tailwinds (Positive Drivers)
- Market Leadership & Premium Growth: Dominant position (22.6% private IRP share) with balanced growth across segments—Protection NBP +29%, Annuity +29%, Non-Par Savings +27%. Individual NBP +6% YoY; diversified product mix (Protection 12%, Annuity 17%).
- Distribution Strength: Multi-channel ecosystem (Banca 57%, Agency 29%, Others 14% of APE); 1,154 offices, 343K trained professionals, 40K+ partner branches. Digital sourcing at 99.6%.
- Operational Efficiency & Customer Metrics: Persistency improved (13M: 87.1%, +70 bps); Claim settlement 99%; low grievances (6/10K policies). Cost discipline (Opex 6.2%, Commission 4.7%).
- Financial Health: Strong balance sheet (Net Worth +13% YoY to ₹183 Bn, zero debt); high-quality AUM (95% AAA/Sovereign debt, 60:40 debt-equity); EVOP 17.6%.
- Digital & Sustainability Edge: 99.6% digital apps, RPA (356 bots), 30+ self-services; ESG focus (100% renewable energy, 53K CSR beneficiaries).
Headwinds (Challenges)
- Regulatory/Tax Pressures: GST demand of ₹68.8 Cr (Tax ₹62.3 Cr + Penalty ₹6.5 Cr) for FY18-24; company to appeal. Pending Sahara Life transfer (IRDAI order stayed, Supreme Court intervention).
- Margin & Cost Pressures: Total cost ratio up to 10.9% (from 10.6%); investment income volatile (H1 down due to mark-to-market losses). ULIP mix (57%) sensitive to equity markets.
- Macro/Industry Slowdown: Single premium +24% drove GWP growth, but regular premium softer; industry facing surrender reg changes, tax tweaks on ULIPs/Non-ULIPs.
- Competition: Private players gaining share (39% industry NBP); shift to guaranteed products may compress margins.
Growth Prospects (Opportunities)
- Underpenetrated Market: India life insurance penetration ~3% GDP (vs. 4-5% peers); 9% CAGR projected (Swiss Re). Protection gap (₹50 Tn), annuity demand (rising NPS AUM, life expectancy).
- Demographic Tailwinds: Young population (median age 28), urbanization, rising incomes; target “Insurance for All by 2047” via GST reforms.
- Strategic Levers: Product innovation (25 individual products); digital expansion (68K monthly RIA users); bancassurance leverage (SBI synergy); annuity/group growth (55% YoY).
- Embedded Value Momentum: VoNB sensitivity positive on lower lapses/mortality/expenses; EV growth supports dividends/ESOPs.
- Long-Term: 15-20% APE CAGR potential; EV target ₹1 Tn+ by FY27; rural penetration (31% policies).
Key Risks (Threats)
| Risk Category | Description | Mitigants |
|---|---|---|
| Regulatory | GST appeal loss (₹69 Cr impact); IRDAI changes (surrender norms, Sahara transfer); tax volatility (VoNB -9.2% on 25% tax rate). | Strong solvency (1.94x); appeals filed; compliance framework. |
| Market/Investment | Equity downside (IEV -2.4% on 10% drop); rate sensitivity (IEV -3.4% on +100 bps). | 95% high-quality debt; 60:40 portfolio; RI framework (60 engagements). |
| Operational/Underwriting | Lapse (+10%: VoNB -4.6%); mortality (+10%: -6.1%); cyber/data breaches. | Persistency tools; ISO certifications (27001, 22301); low surrender (0.5%). |
| Credit/Concentration | Counterparty exposure; single-premium reliance (volatile). | Diversified AUM; low NPAs (zero reported). |
| Macro | Slowdown/inflation eroding savings shift to insurance. | Resilient model (15% 5Y GWP CAGR through cycles). |
Overall Outlook: Positive. Tailwinds from market leadership, digital prowess, and demographics outweigh headwinds. Growth prospects strong in a 9% industry CAGR market, with EV/VoNB as value creation proxies. Risks manageable via buffers (solvency, quality AUM). Target 15-20% earnings CAGR feasible; stock likely to benefit from rerating on profitability/digital execution. Monitor GST/Sahara resolutions.
Copyright © 2023 SAS Data Analytics Pvt. Ltd. All rights reserved.