RAMRAT
Equity Metrics
September 24, 2026
Ram Ratna Wires Limited
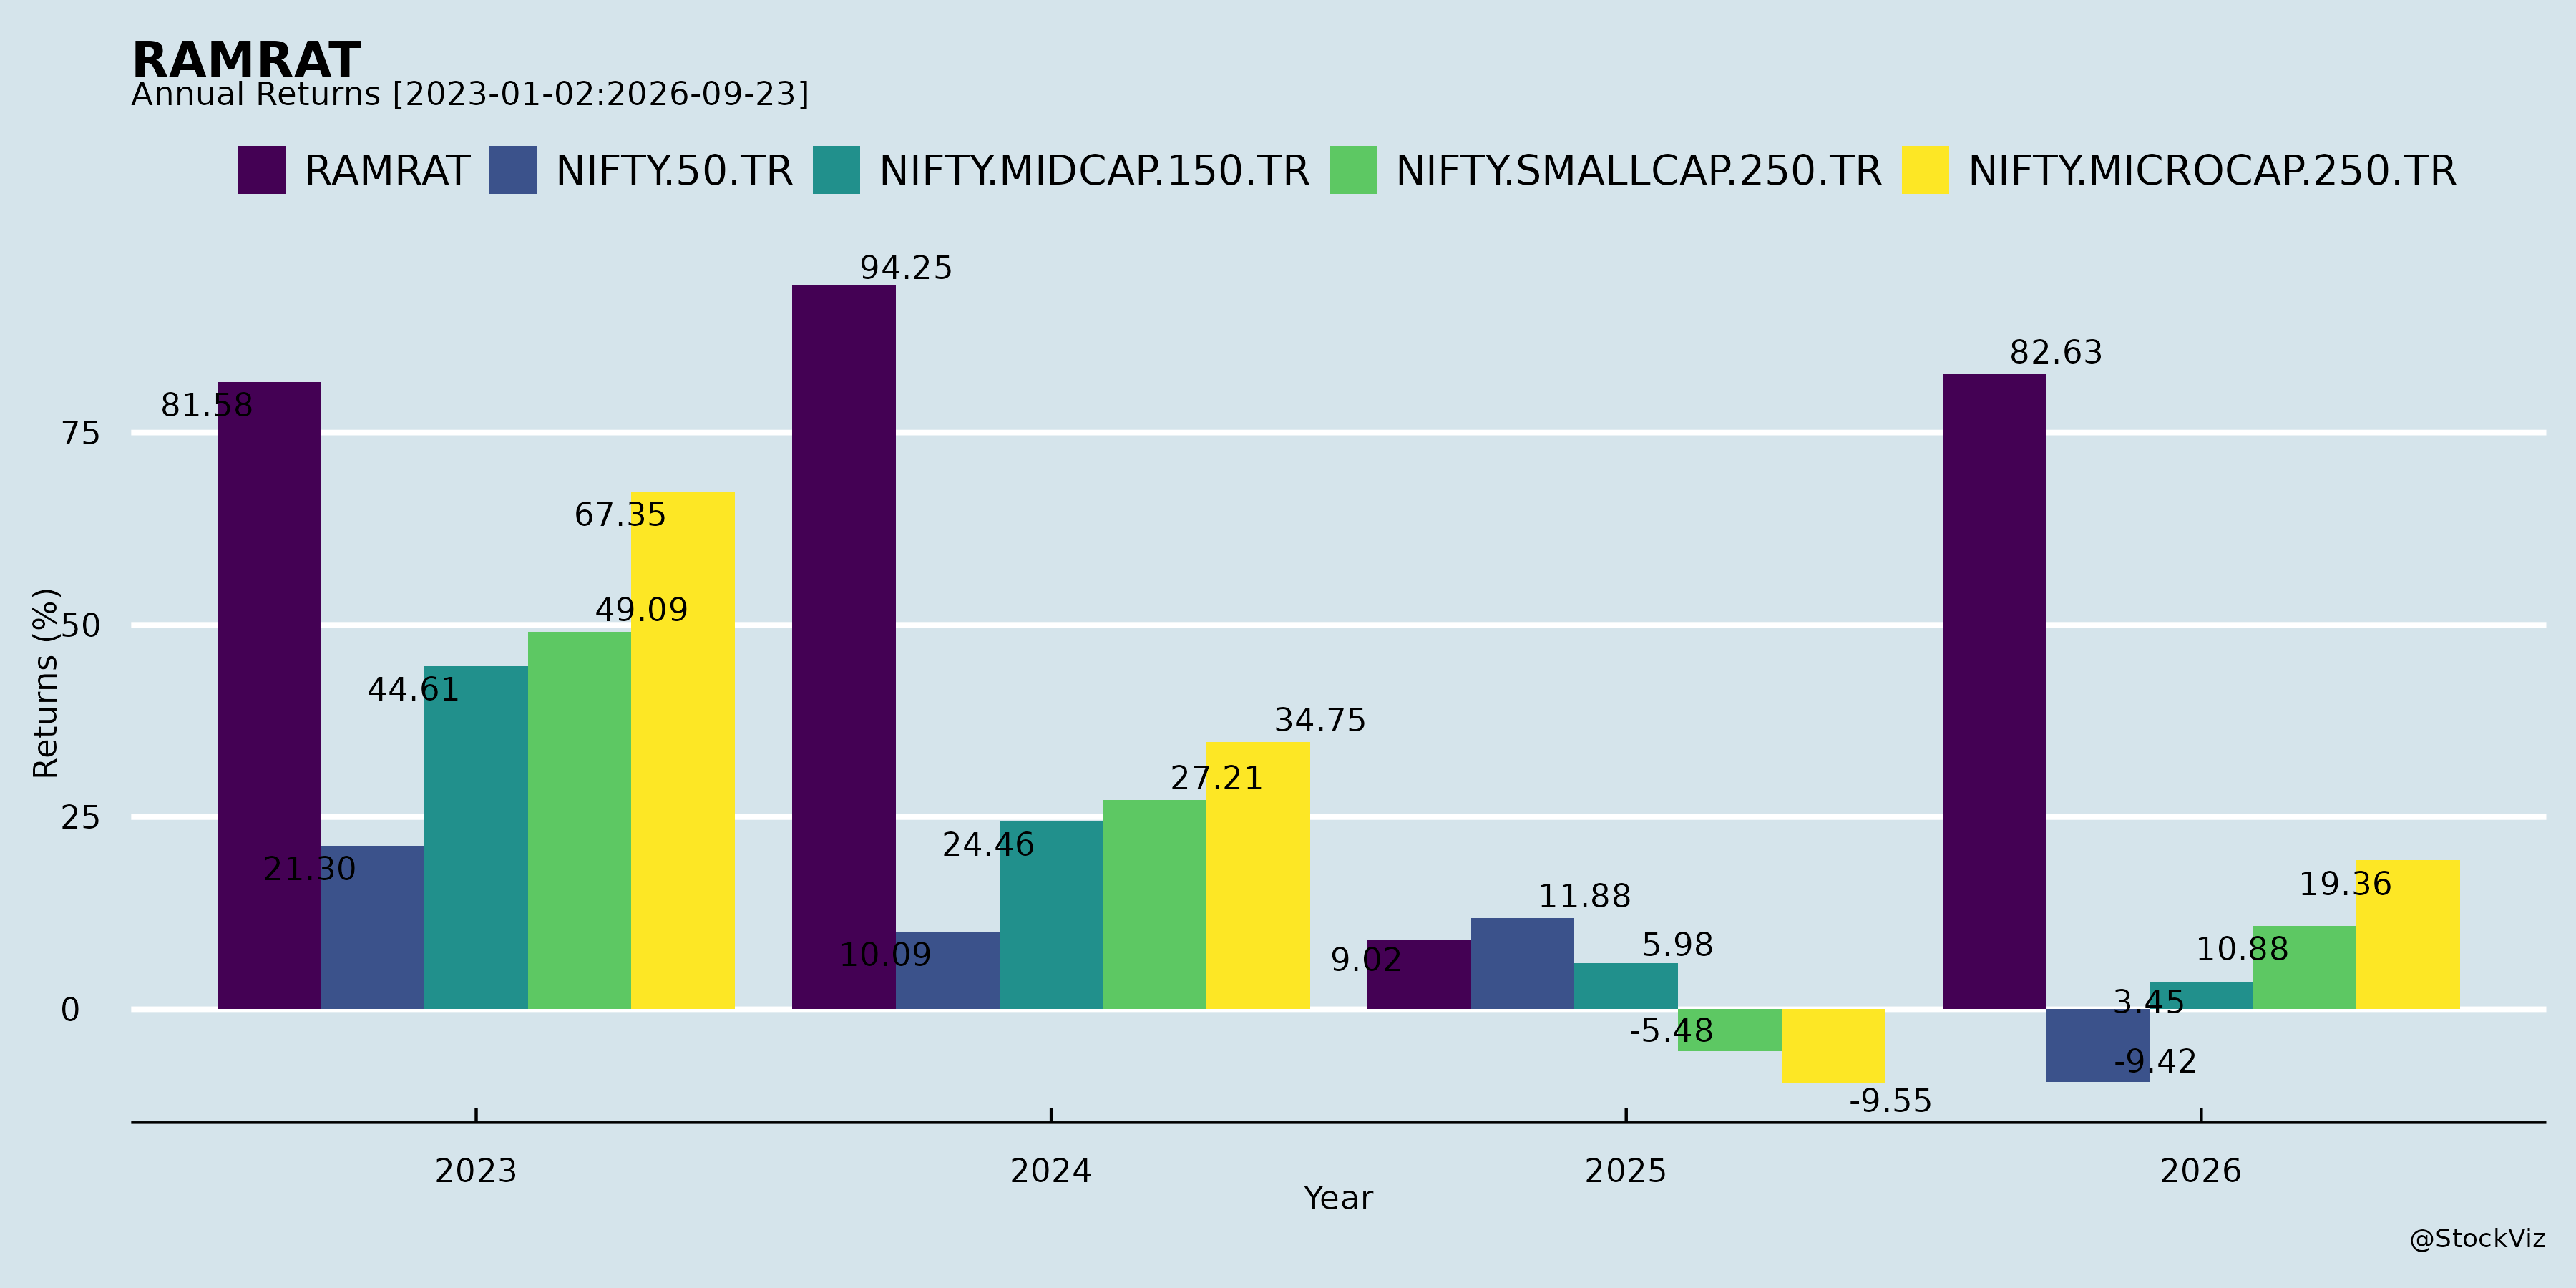
Annual Returns
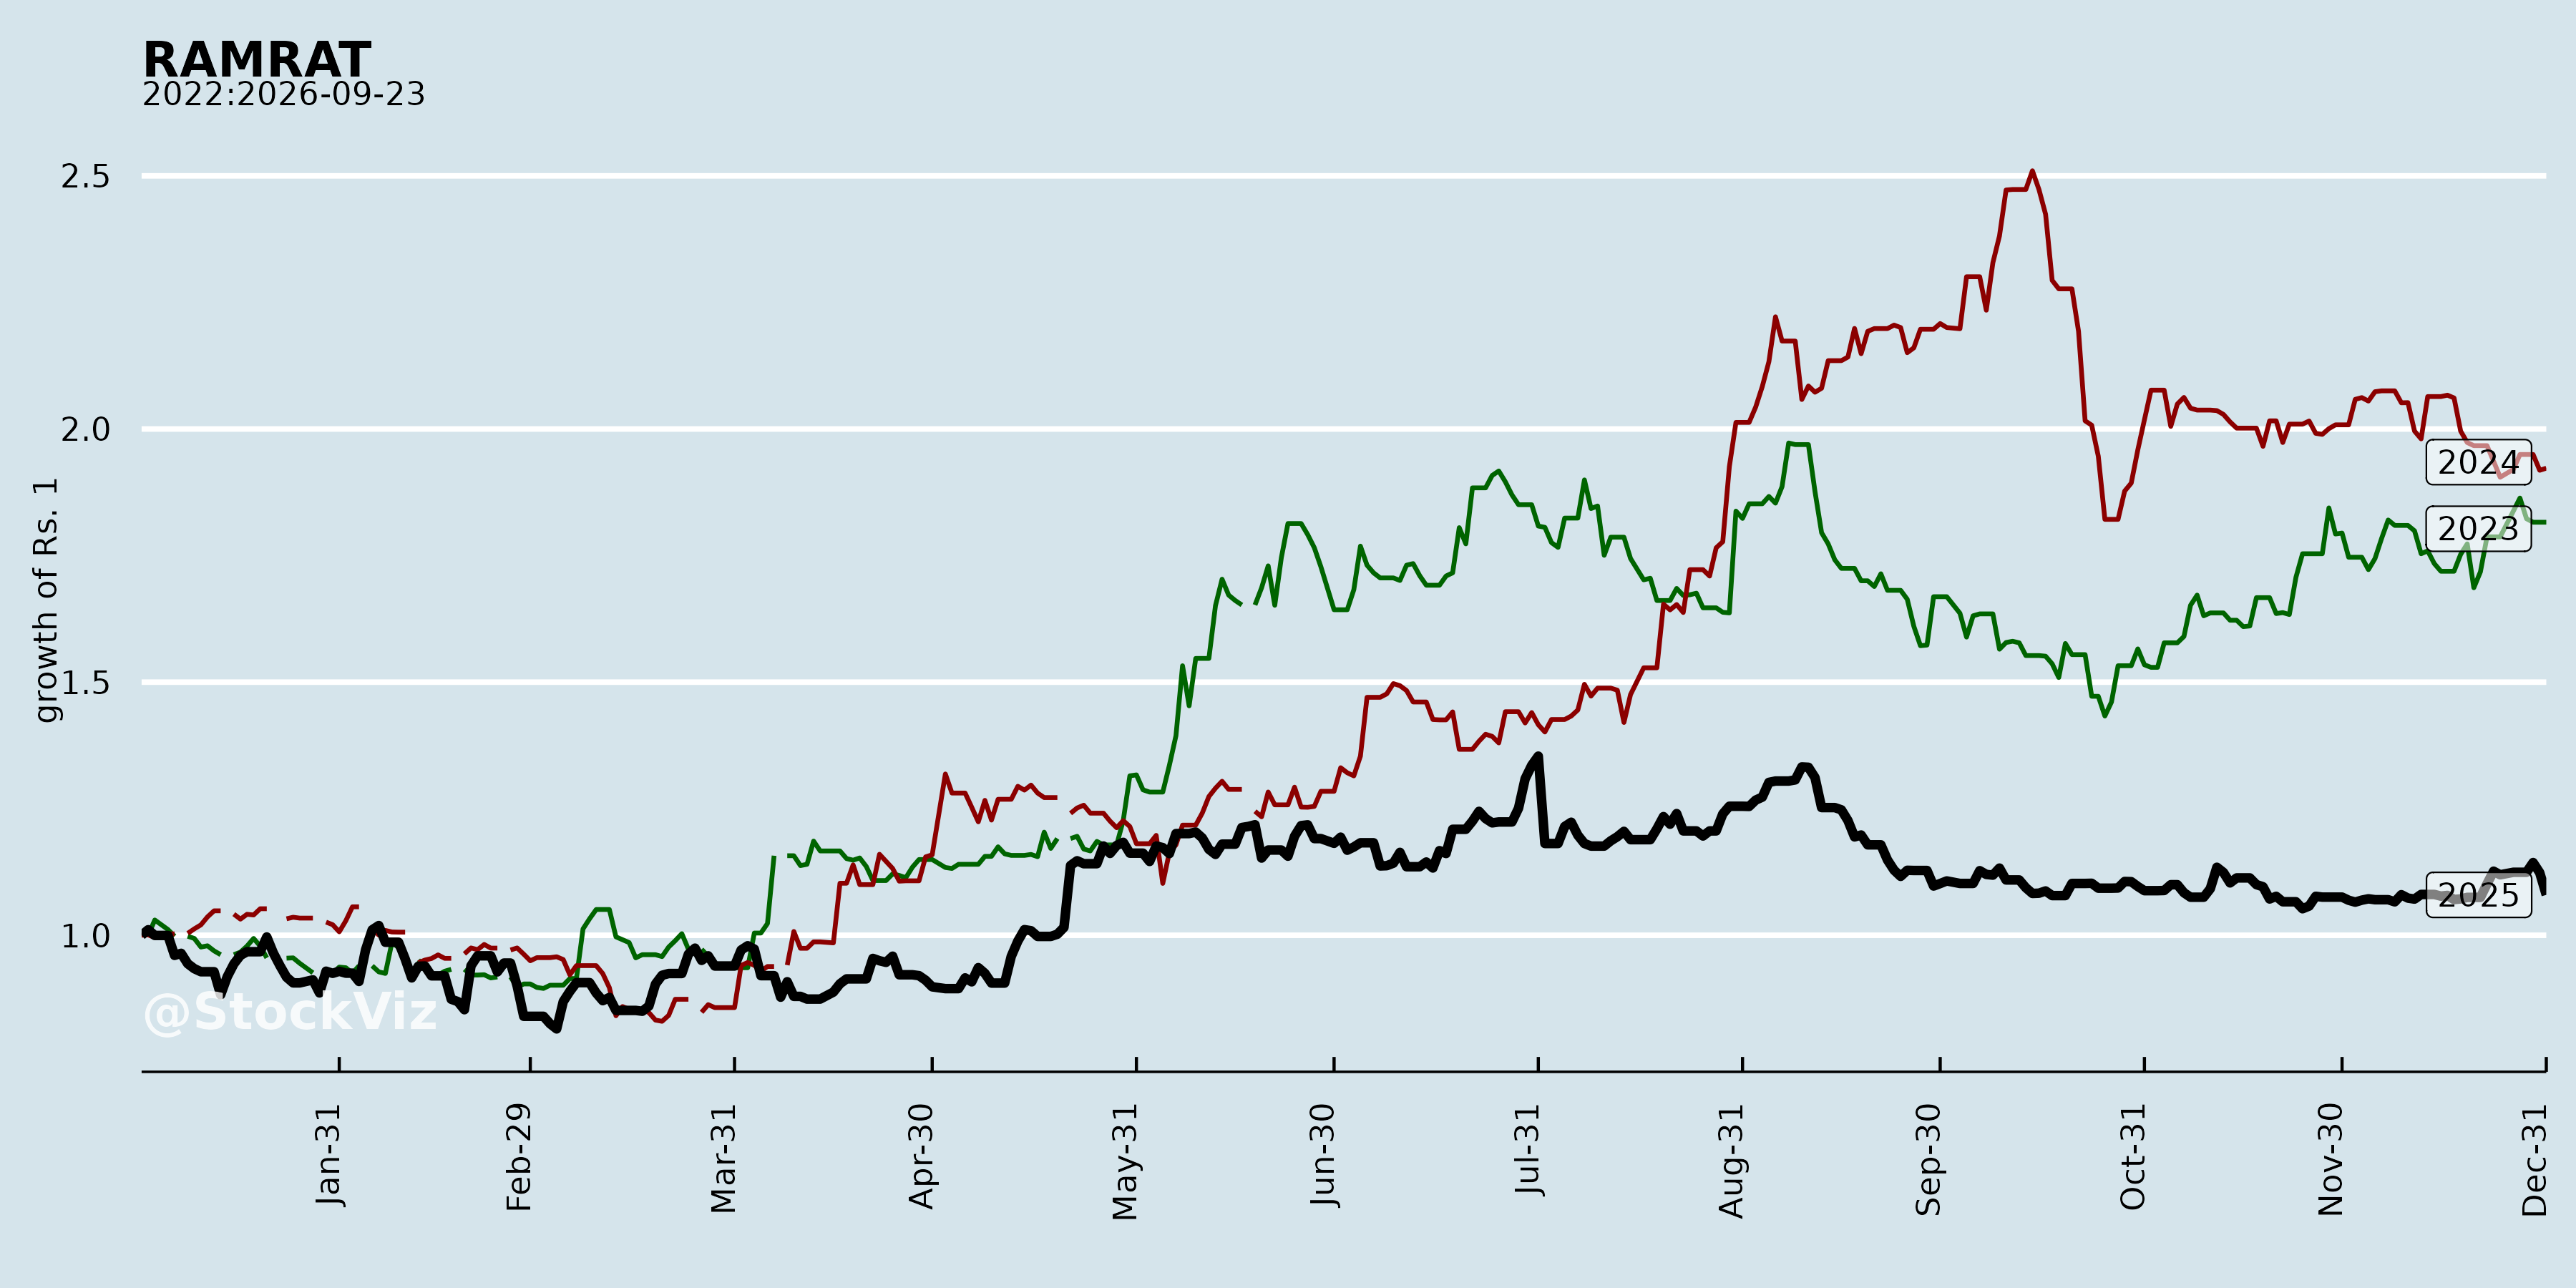
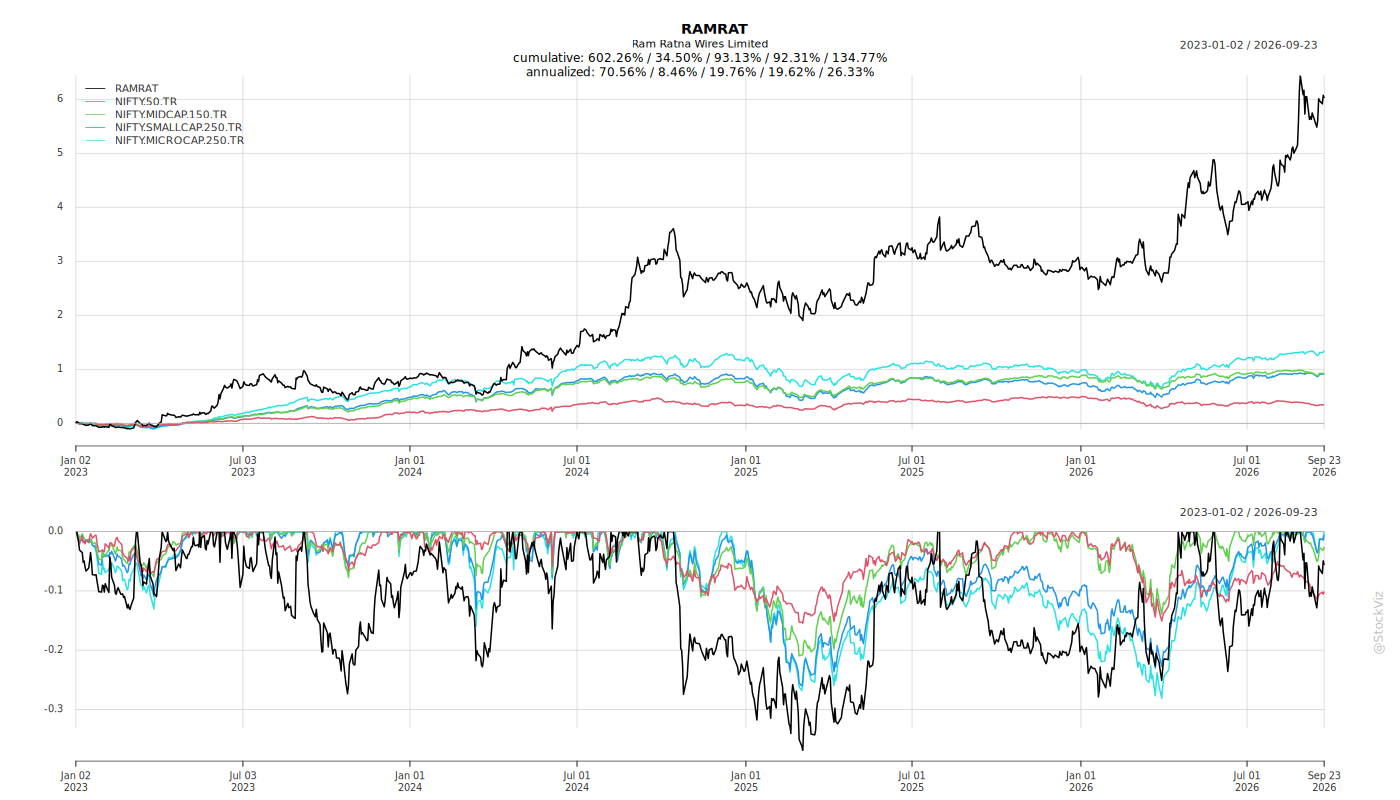
Cumulative Returns and Drawdowns
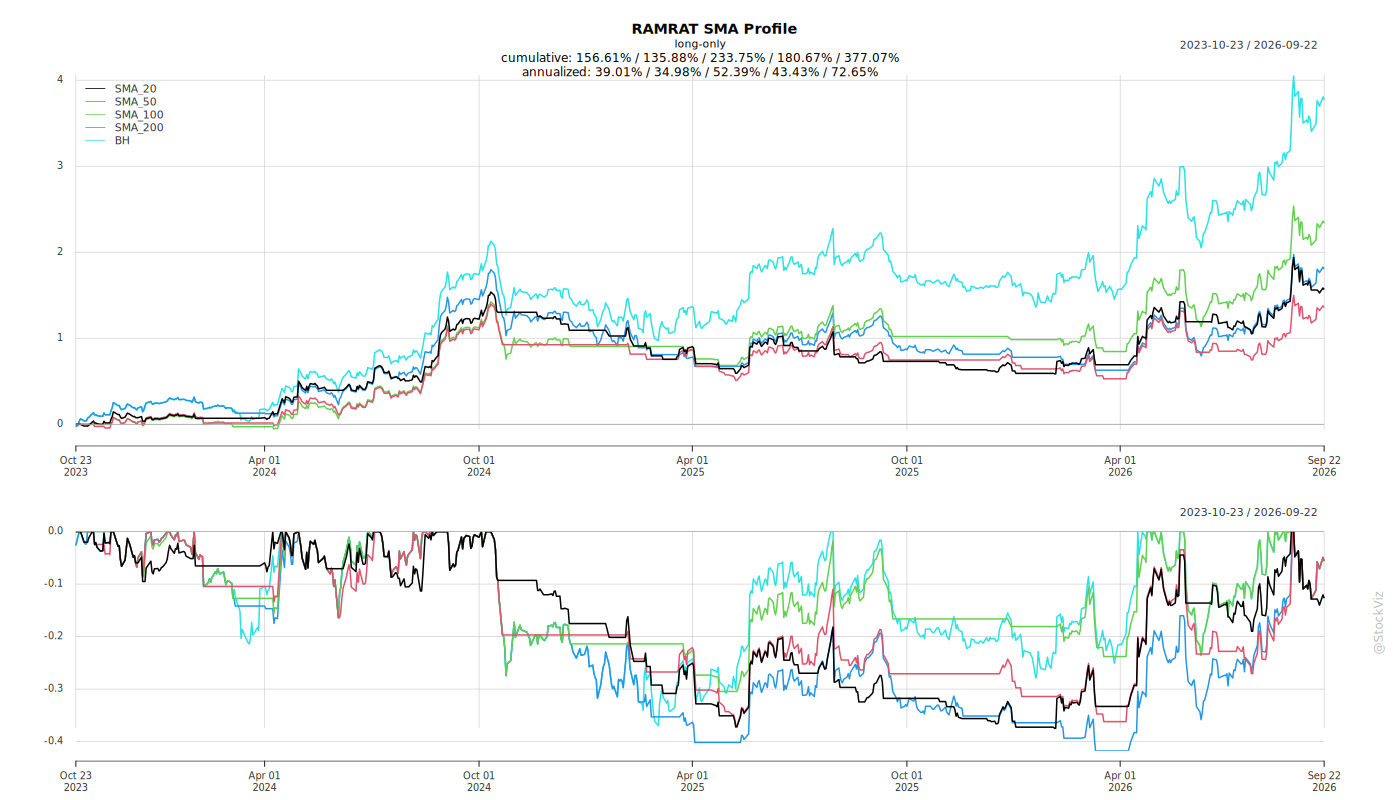
Fundamentals
Ownership
Margined
AI Summary
asof: 2026-09-17
Ram Ratna Wires — Recent Corporate Announcements
1. Headwinds and Challenges
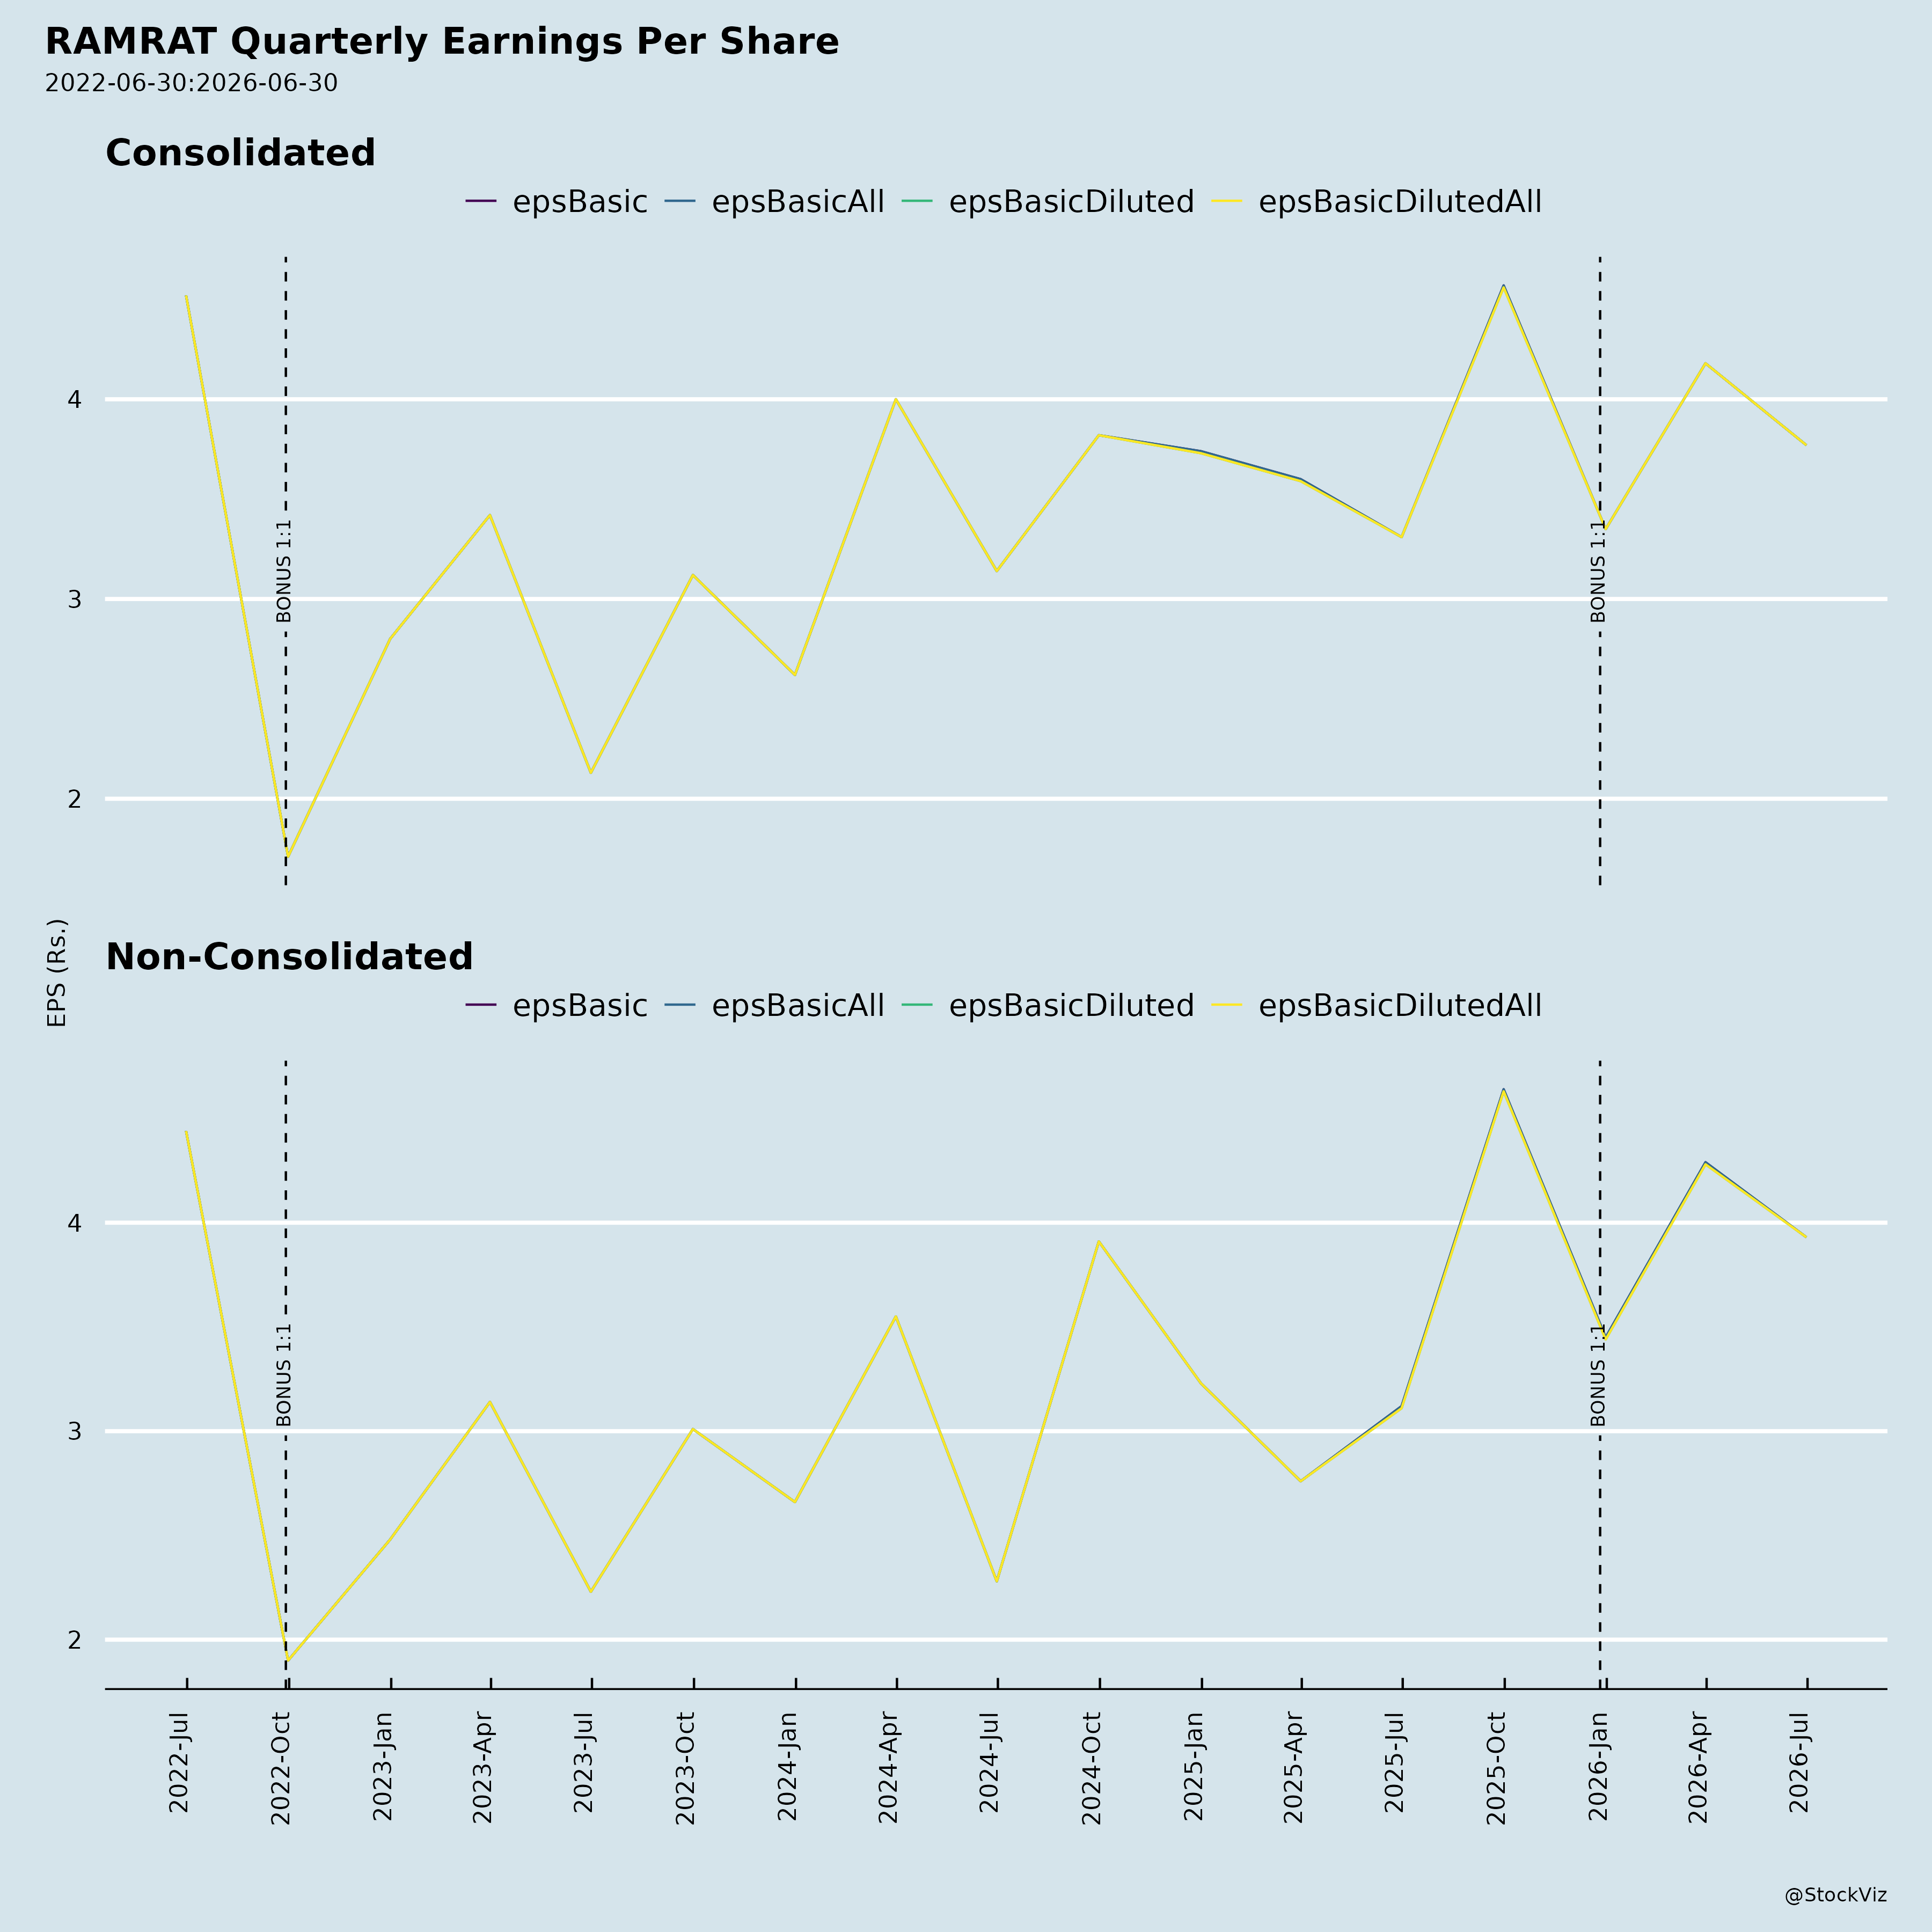
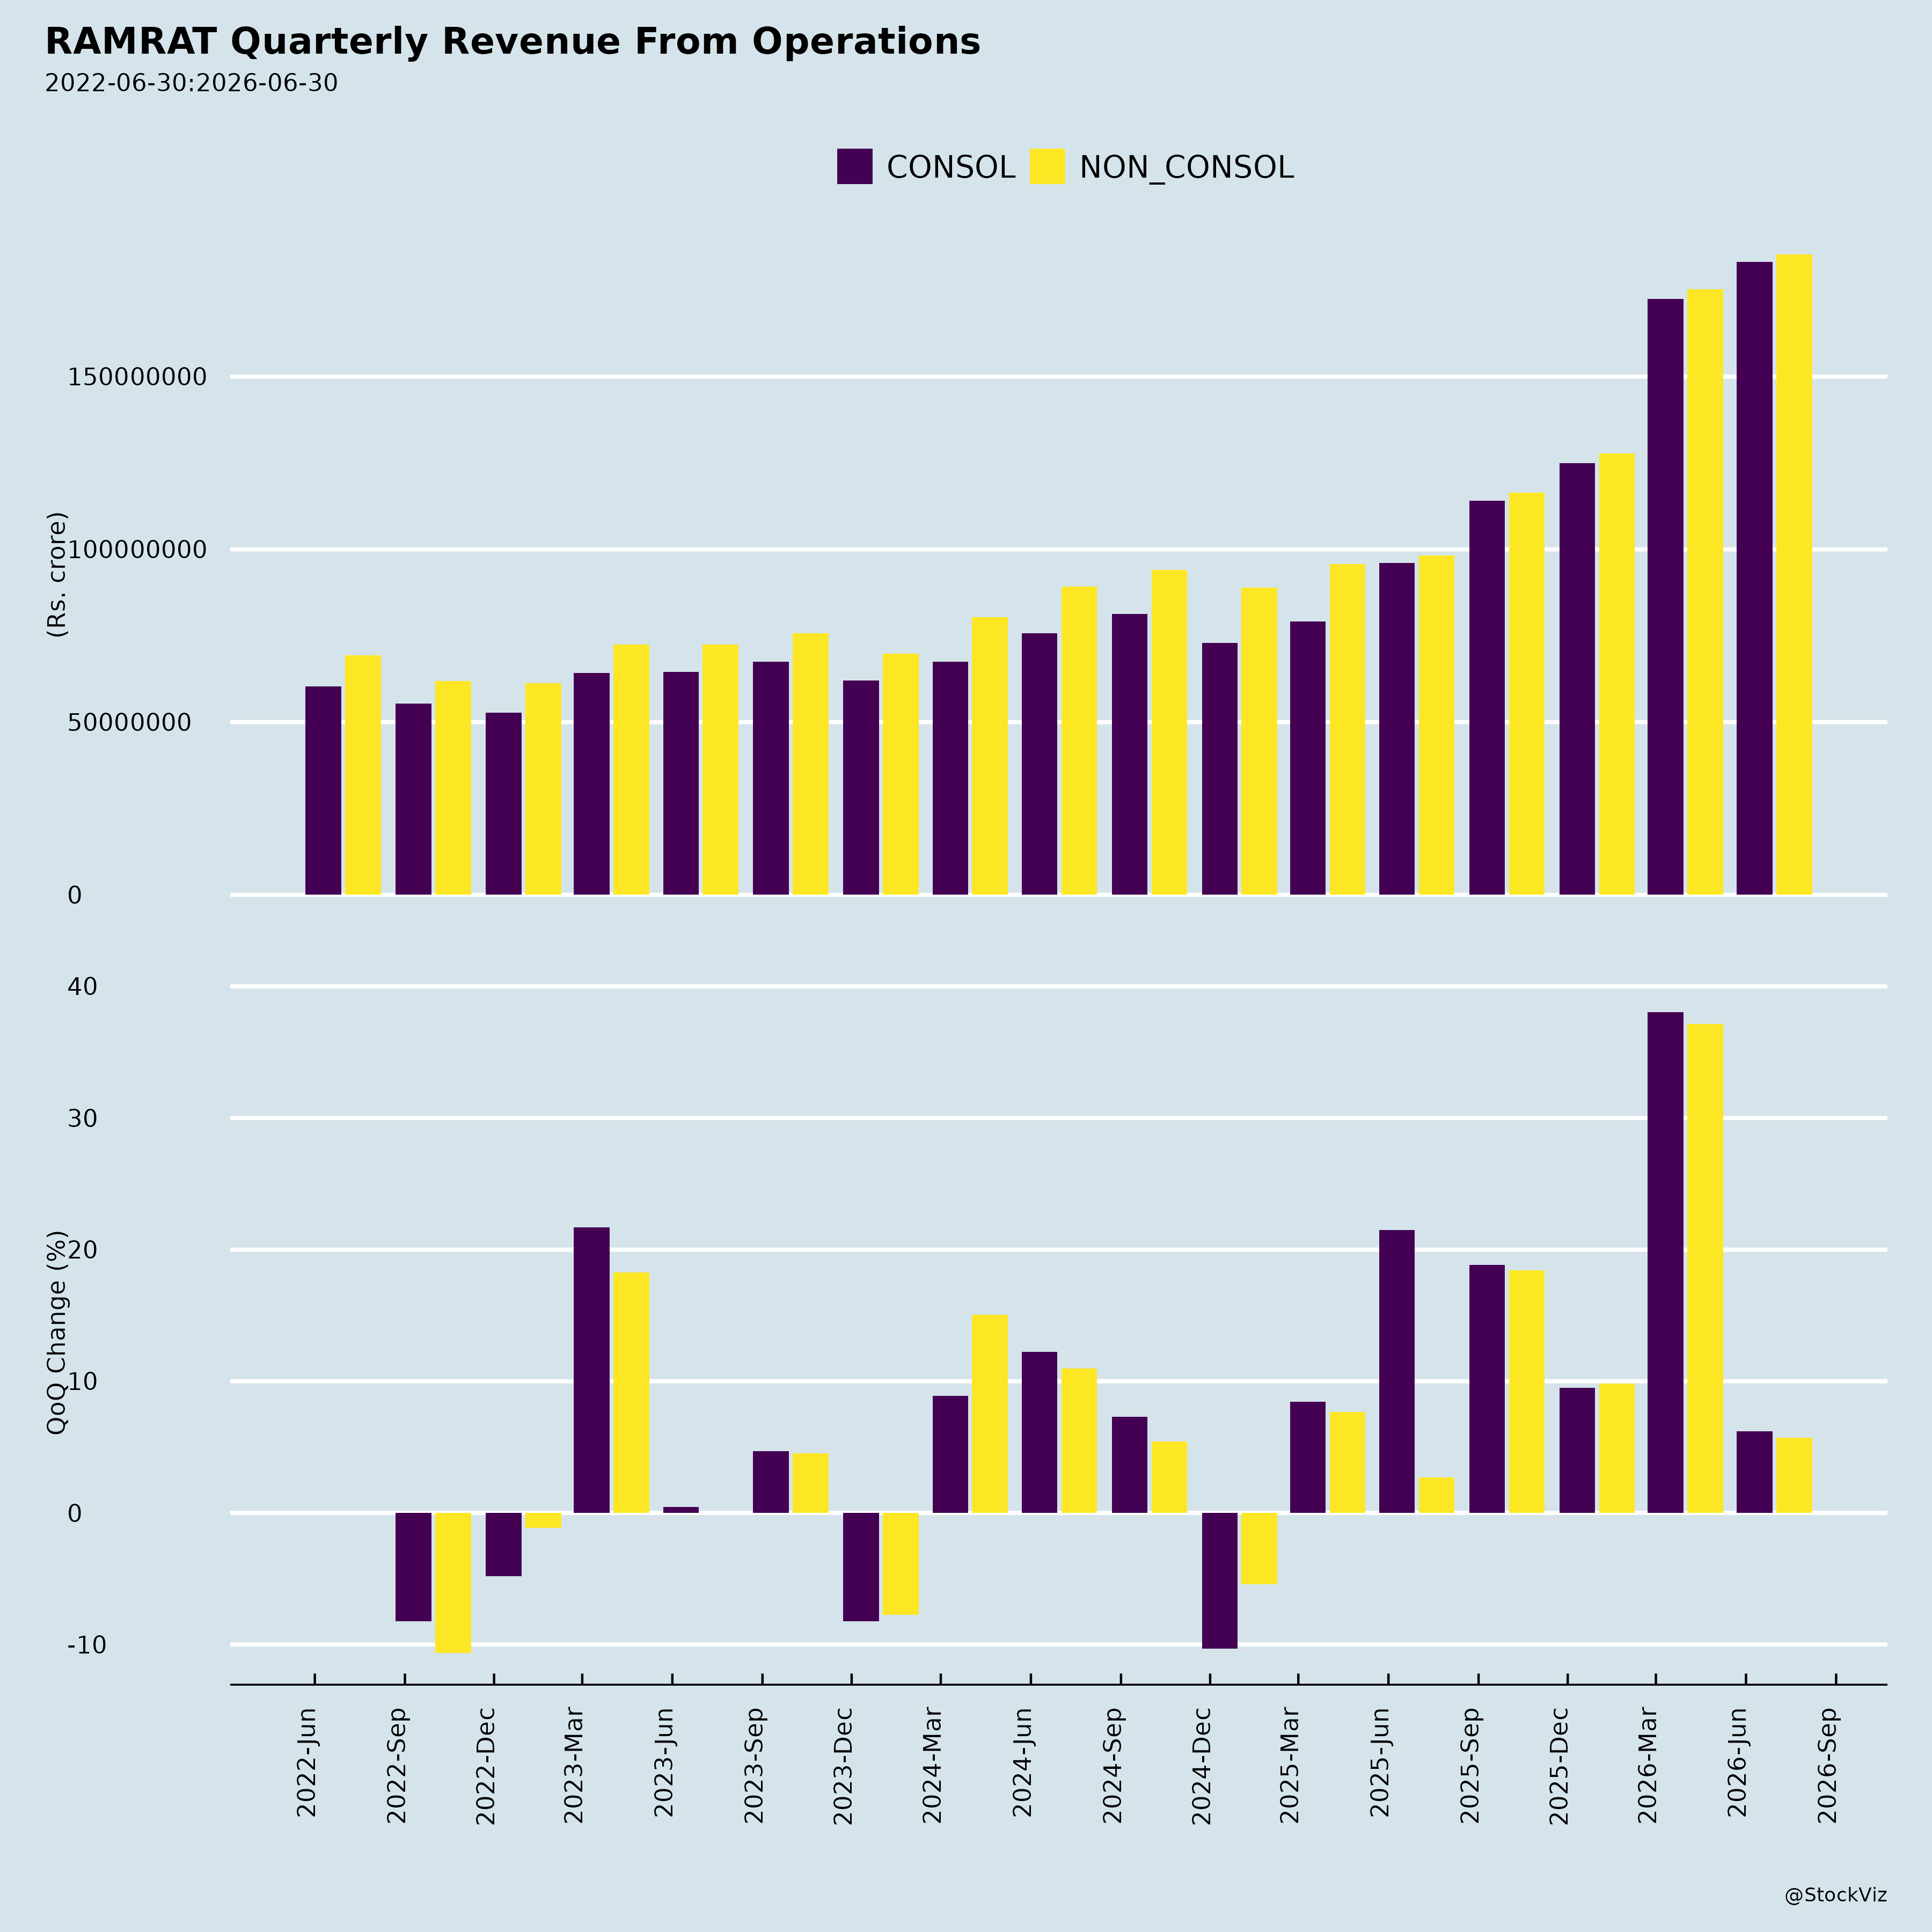
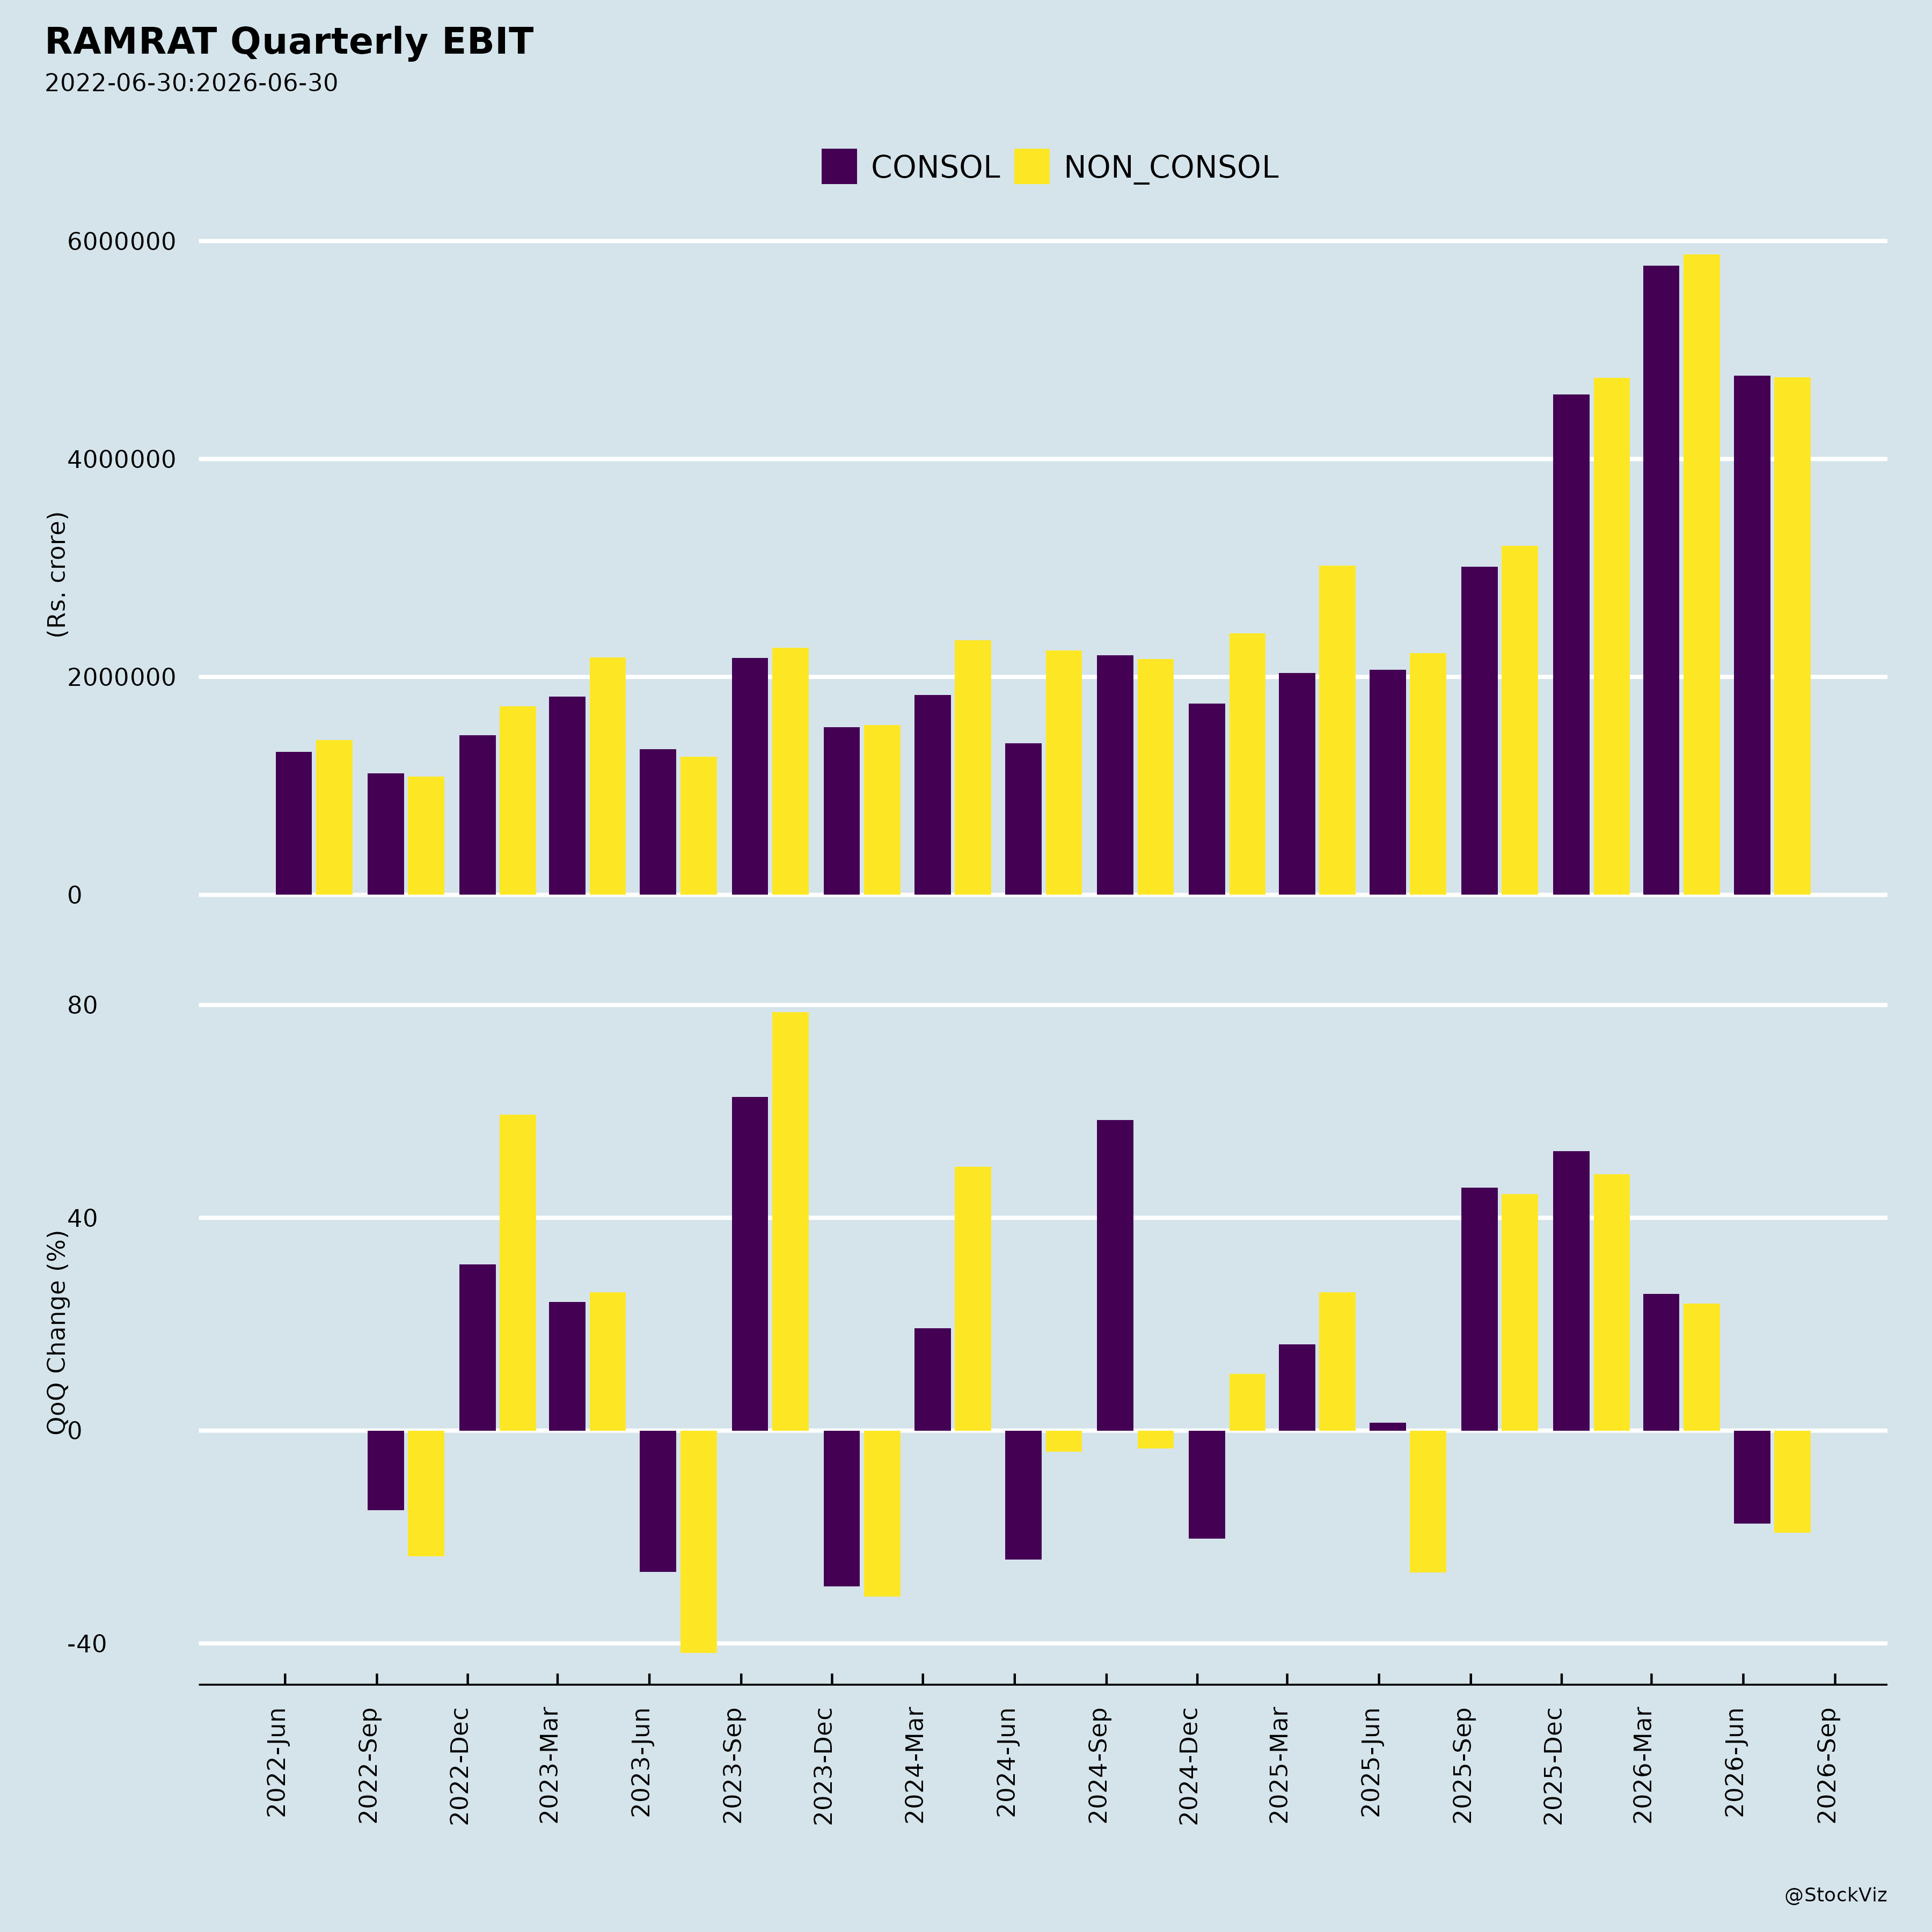
Margin compression despite strong topline growth. In Q1 FY27 (quarter ended June 30, 2026), consolidated revenue from operations rose 88.6% year-on-year to ₹1,853.3 crore, but gross profit margin declined to 8.9% from 9.8% in Q1 FY26 and 10.1% in FY26. Operating EBITDA margin at 4.8% was below the 5.3% reported in Q4 FY26 and the 5.1% full-year FY26 level, and PAT margin at 1.9% was below Q4 FY26’s 2.2%. Sequentially, revenue grew from ₹1,752.9 crore in Q4 FY26 to ₹1,853.3 crore, while operating EBITDA slipped from ₹93.2 crore to ₹89.6 crore and PAT from ₹39.2 crore to ₹35.2 crore.
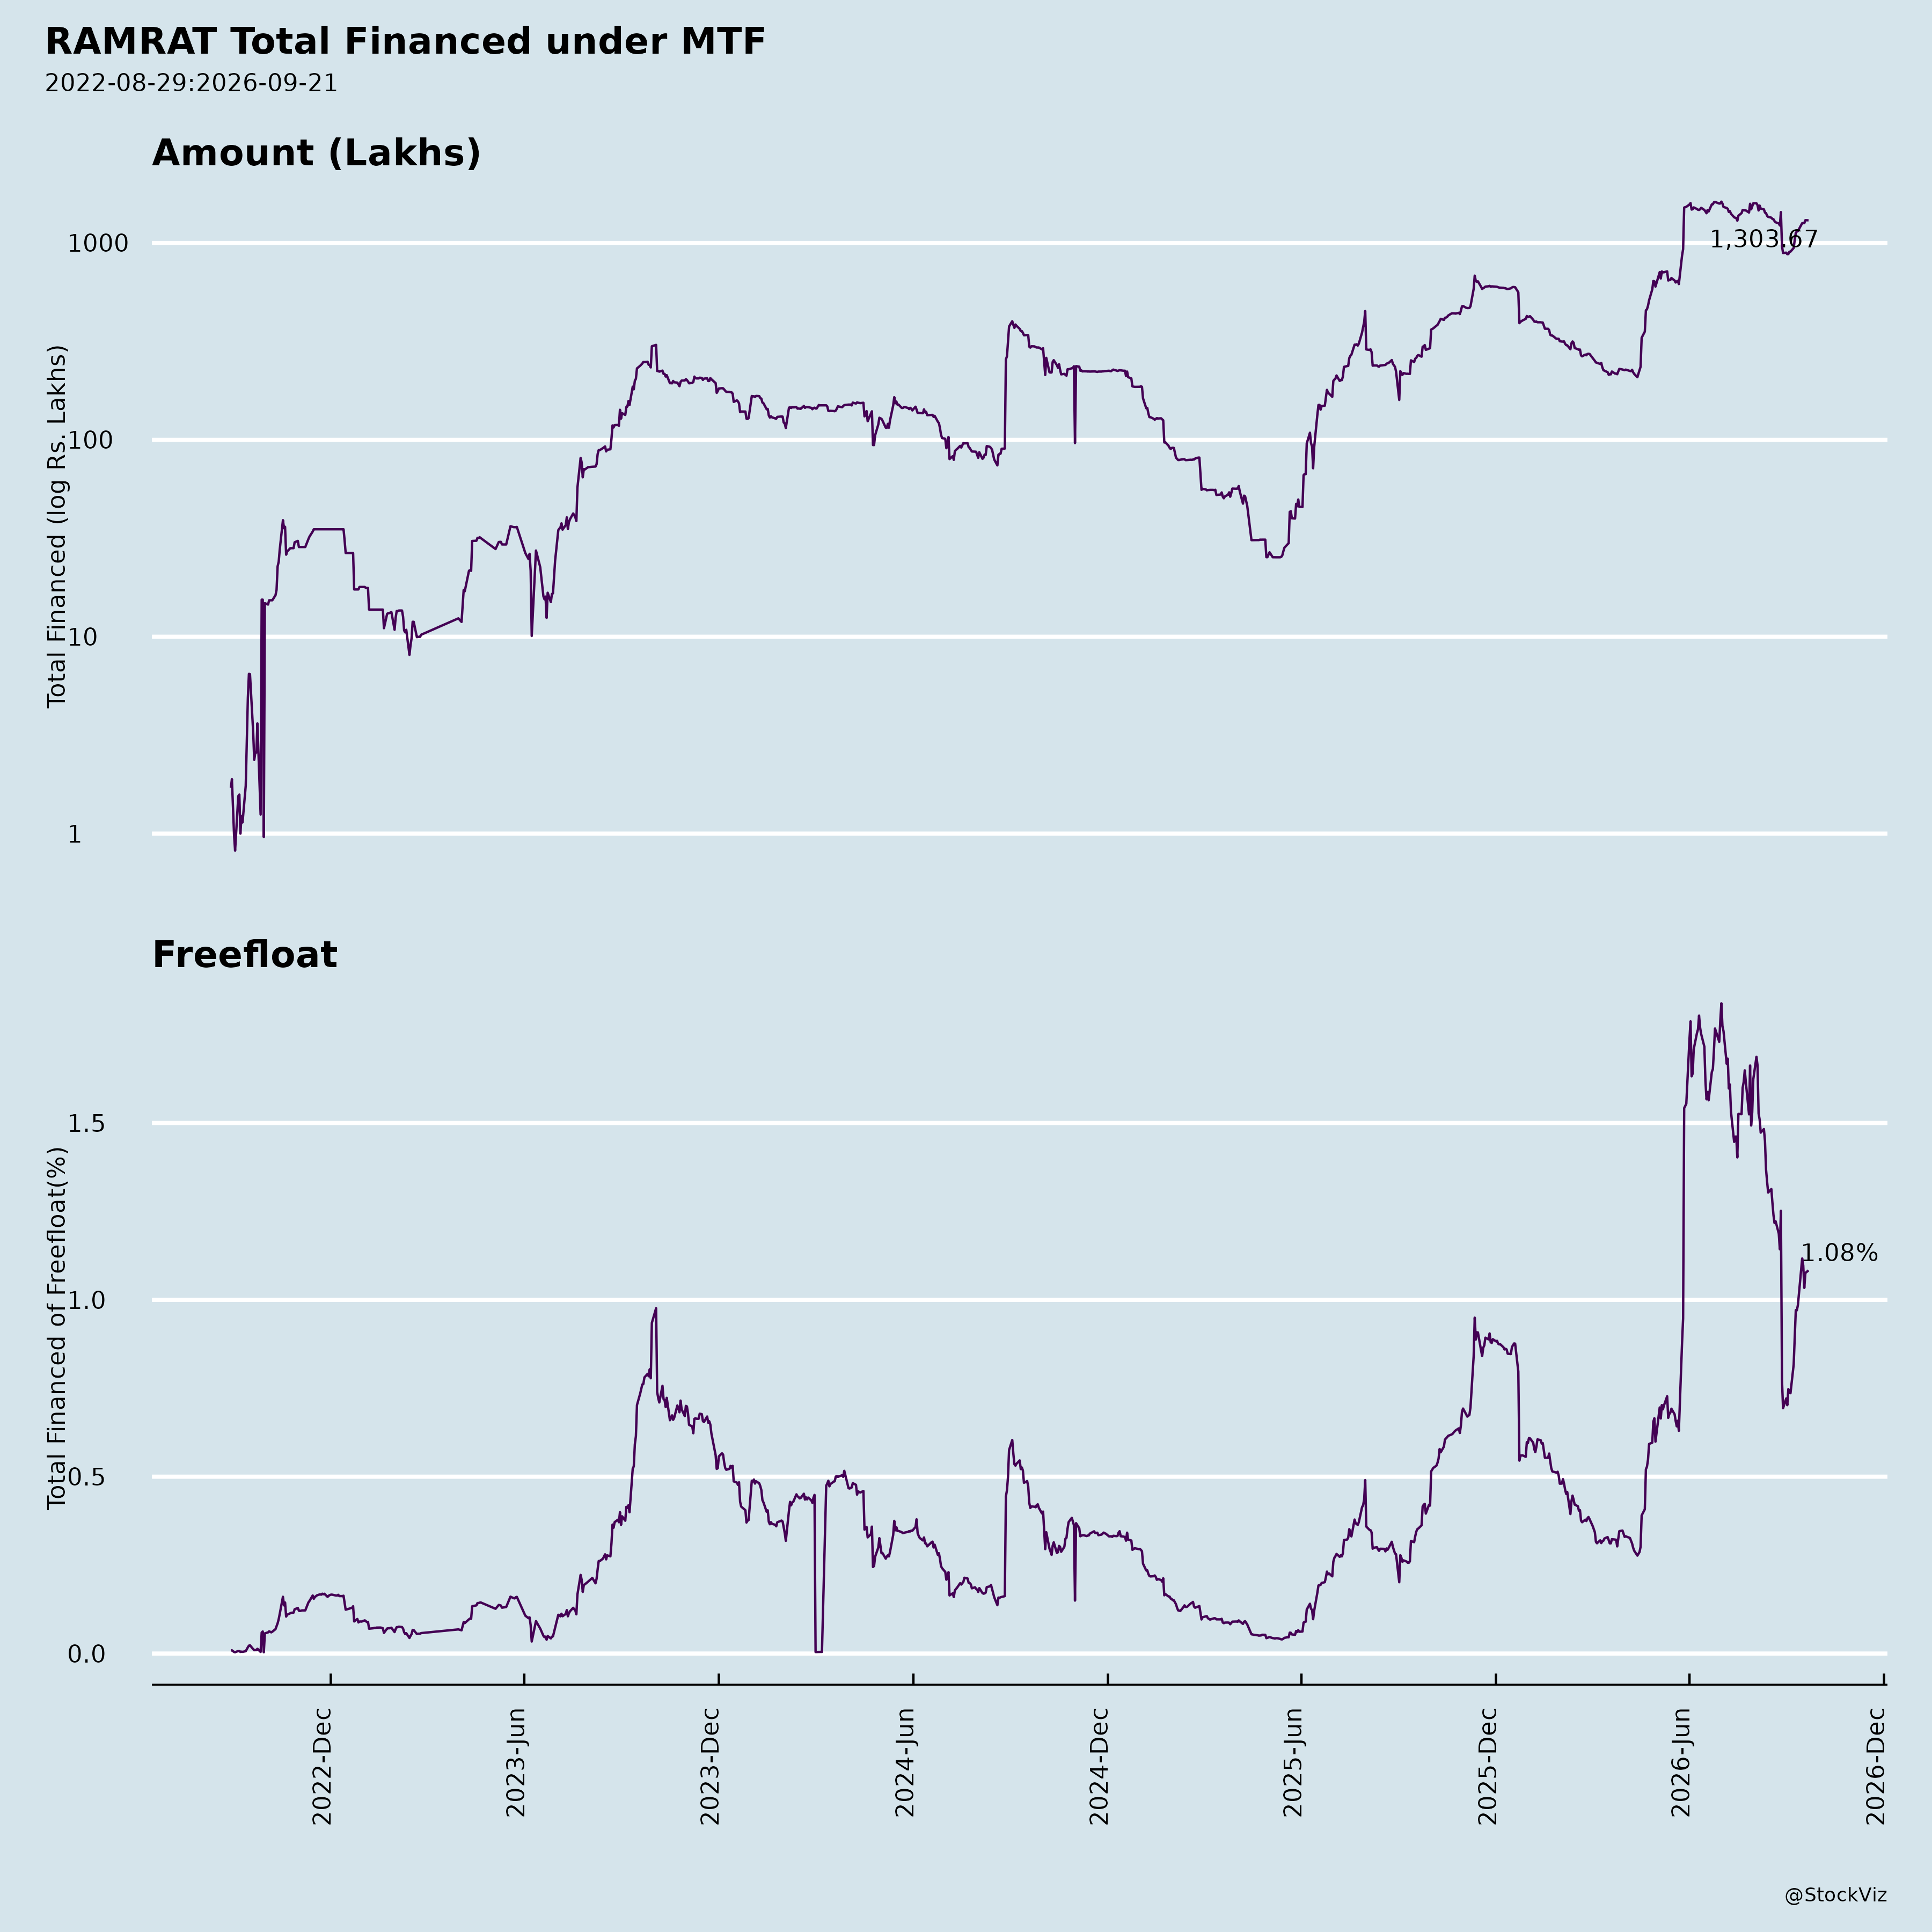
Rising finance costs and leverage. Consolidated finance costs rose to ₹3,164.81 lakh in Q1 FY27 from ₹1,611.70 lakh in Q1 FY26 and ₹2,782.99 lakh in Q4 FY26. On the balance sheet, non-current borrowings increased to ₹265.3 crore at March 31, 2026 from ₹191.0 crore a year earlier, and current borrowings rose to ₹388.8 crore from ₹105.2 crore. Net debt/equity rose from 0.20 in FY24 to 0.34 in FY25 and 0.46 in FY26. Trade receivables increased to ₹640.6 crore at March 31, 2026 from ₹390.1 crore, and inventories to ₹486.1 crore from ₹233.7 crore.
Joint venture losses. The consolidated results show a share of loss of joint ventures of ₹141.53 lakh in Q1 FY27, versus a profit of ₹22.06 lakh in Q1 FY26, and a loss of ₹388.63 lakh for FY26. The subsidiary Tefabo Product Private Limited reported a net loss after tax of ₹13.77 lakh for Q1 FY27 on total revenue of ₹2,140.50 lakh.
Regulatory uncertainty on Extended Producer Responsibility (EPR). The notes to the Q1 FY27 results state that the Hazardous and Other Wastes (Management and Transboundary Movement) Amendment Rules, 2025 impose EPR for scrap of non-ferrous metals on producers, effective April 1, 2026, covering wires and strips (other than automobile grade). The CPCB online portal is not yet operational and the guidelines and pricing mechanism for EPR certificates are not yet prescribed, so the company states it cannot reasonably determine the financial impact.
Copper tube capacity underutilisation. The investor presentation describes the Bhiwadi copper tubes and pipes plant as running at approximately 45% capacity utilisation, against approximately 76% utilisation for winding wires and strips.
Import dependence of the domestic copper tube market. The presentation notes India’s continued reliance on imported copper tubes, with approximately 70% import dependency, which the company frames as a localisation opportunity but which also describes the competitive backdrop.
2. Tailwinds and Growth Prospects
Strong Q1 FY27 growth. Consolidated revenue from operations of ₹1,853.3 crore was up 88.6% year-on-year; operating EBITDA of ₹89.6 crore was up 109.0%; PAT of ₹35.2 crore was up 120.8%. On a standalone basis, revenue was ₹1,83,199.09 lakh versus ₹96,040.08 lakh in Q1 FY26, and profit for the period was ₹3,671.62 lakh versus ₹1,453.79 lakh.
Copper tubes diversification. The copper tubes and pipes segment’s share of consolidated revenue rose to 26% in Q1 FY27 from 14% in Q1 FY26. Standalone copper tube segment revenue was ₹48,997.75 lakh in Q1 FY27 versus ₹13,738.65 lakh in Q1 FY26, with segment results of ₹2,299.42 lakh versus ₹523.36 lakh. The company describes this as strategic diversification positioning the portfolio for long-term growth and profitability.
Capacity expansion. The presentation notes an ongoing capex to add 3,600 MTPA at Silvassa, targeted for commissioning in March 2027. Total installed capacity is stated at 54,000 MTPA across five plants, with the Bhiwadi copper tubes and pipes facility at 24,000 MTPA and Baroda at 12,000 MTPA. The copper tubes business is described as having total installed capacity of 36,000 MTPA.
JV and subsidiary platforms. Epavo Electricals (50:50 JV with Epack Durable) makes BLDC and PMSM motors, with installed capacity stated at 30 lakh motors per annum and over 90% localisation on PMSM HVLS fan motors; FY26 sales were approximately 11–11.5 million units for over 22–23 million BLDC motors. Tefabo Product (64% stake) makes wind turbine towers and structural components, with two plants in Bengaluru and Vadodara, approximately 40 towers per month capacity, and a phased expansion at Vadodara from approximately 40 to approximately 80 towers per month.
Demand drivers cited. The presentation cites India’s magnet winding wire market at approximately USD 4.22 billion in CY23 projected to reach approximately USD 5.25 billion by CY28; the India power transformers market at USD 3.25 billion in 2026 projected to reach USD 4.82 billion by 2031; approximately 55.3 million smart meters installed as of June 2026 under RDSS with 72.4 million installed nationwide; a 500 GW non-fossil fuel capacity target by 2030 with ₹4.75 trillion in power transmission investments expected by 2027; and the Indian electrical and electronics sector expanding to a USD 130 billion market with exports reaching USD 25 billion by 2030.
Historical track record. Consolidated revenue grew from ₹2,983.3 crore in FY24 to ₹3,676.7 crore in FY25 and ₹5,176.6 crore in FY26; EBITDA from ₹119.0 crore to ₹156.3 crore to ₹263.6 crore; PAT from ₹54.6 crore to ₹70.2 crore to ₹108.6 crore. The presentation states five-year revenue and PAT CAGR of 28% and 47% respectively, and FY26 ROCE of 25%.
Dividend. The 34th AGM approved a dividend of ₹2.50 per equity share of face value ₹5.00 for FY26, consistent with ₹2.50 per share in FY25.
3. Key Risks
- Margin and profitability pressure from input costs and mix, as reflected in the Q1 FY27 gross margin decline and sequential EBITDA and PAT decline.
- Leverage and working capital intensity, with borrowings, receivables and inventories rising sharply at March 31, 2026, and net debt/equity at 0.46.
- Interest cost sensitivity, with finance costs up year-on-year and sequentially.
- JV and subsidiary performance risk, evidenced by the JV share of loss in Q1 FY27 and FY26 and Tefabo’s Q1 FY27 net loss.
- Regulatory compliance cost uncertainty from the EPR framework for non-ferrous metal scrap, whose financial impact the company states it cannot currently determine.
- Execution risk on expansion, including the Silvassa capex targeted for March 2027 and the Vadodara tower capacity expansion.
- Capacity utilisation risk in copper tubes, currently at approximately 45%.
- Import competition in copper tubes, given India’s approximately 70% import dependency.
- Foreign operations risk, including RRIEL in Bangladesh, whose interim results were restated from IFRS/ Bangladesh GAAP to Ind AS by management and reviewed by other auditors.
- General forward-looking statement risk factors listed in the safe harbor: downtrend in the industry, global or domestic political and economic changes, tax laws, litigation, labour relations, exchange rate fluctuations, technological changes, and interest and other costs.
4. Management Guidance Versus Observed Performance
Management commentary (July 31, 2026). Shri Mahendrakumar Kabra, MD, stated the company began FY27 with healthy growth in revenue and profitability, reflecting robust demand across key end-user industries, disciplined execution, and benefits of continued investments in expanding the business portfolio and manufacturing capabilities. He highlighted copper tubes’ revenue contribution rising to 26% as evidence of the diversification strategy’s success, and stated the company continues to invest in capacity expansion and strengthen its presence through its subsidiary and joint venture. Looking ahead, he stated the company remains focused on sustainable growth through operational excellence, disciplined capital allocation and continued improvement in working capital efficiency, and that it is well positioned to capitalize on India’s long-term investments in power infrastructure, manufacturing, electrification and energy-efficient cooling solutions.
Observed performance against that commentary. Revenue growth, EBITDA growth and PAT growth in Q1 FY27 were all strong and consistent with the stated demand and execution narrative, and the copper tubes revenue mix shift to 26% matches the diversification claim. However, the working capital efficiency objective is not yet reflected in the March 31, 2026 balance sheet, where receivables and inventories rose substantially and net debt/equity increased to 0.46. The profitability trajectory also shows sequential softening: Q1 FY27 operating EBITDA of ₹89.6 crore and PAT of ₹35.2 crore were below Q4 FY26’s ₹93.2 crore and ₹39.2 crore, and Q1 FY27 EBITDA margin of 4.8% was below FY26’s 5.1%. The capital allocation discipline referenced by management sits alongside a sharp increase in both non-current and current borrowings at March 31, 2026 and higher finance costs in Q1 FY27.
Other forward-looking items in the disclosures. The company states it will continue to monitor EPR developments and evaluate the impact when operational details are notified. The presentation identifies the Silvassa 3,600 MTPA addition as targeted for commissioning in March 2027, and the Vadodara tower capacity expansion as phased from approximately 40 to approximately 80 towers per month. The company also discloses a plant visit scheduled for September 02–03, 2026 in Silvassa for company officials to interact with institutional investors and analysts, with no Unpublished Price Sensitive Information to be shared.
Governance and approval items. The 34th AGM held August 4, 2026 passed all seven resolutions with requisite majority, including adoption of standalone and consolidated financial statements for FY26, declaration of the ₹2.50 dividend, re-appointment of Hitesh Vaghela as rotating director, re-appointment of Payal Agarwal as independent director, enhancement of borrowing limits under Section 180(1)(c), enhancement of limits under Section 180(1)(a), and ratification of M/s. Poddar & Co. as cost auditors for FY27. The Section 180(1)(a) resolution drew the largest opposition, with 54,129 votes against (0.0768% of votes polled), including 54,035 votes against from public institutions. The statutory and secretarial auditors’ reports contained no qualifications, reservations, adverse remarks or disclaimer.
Copyright © 2023 SAS Data Analytics Pvt. Ltd. All rights reserved.