RAJRATAN
Equity Metrics
January 13, 2026
Rajratan Global Wire Limited
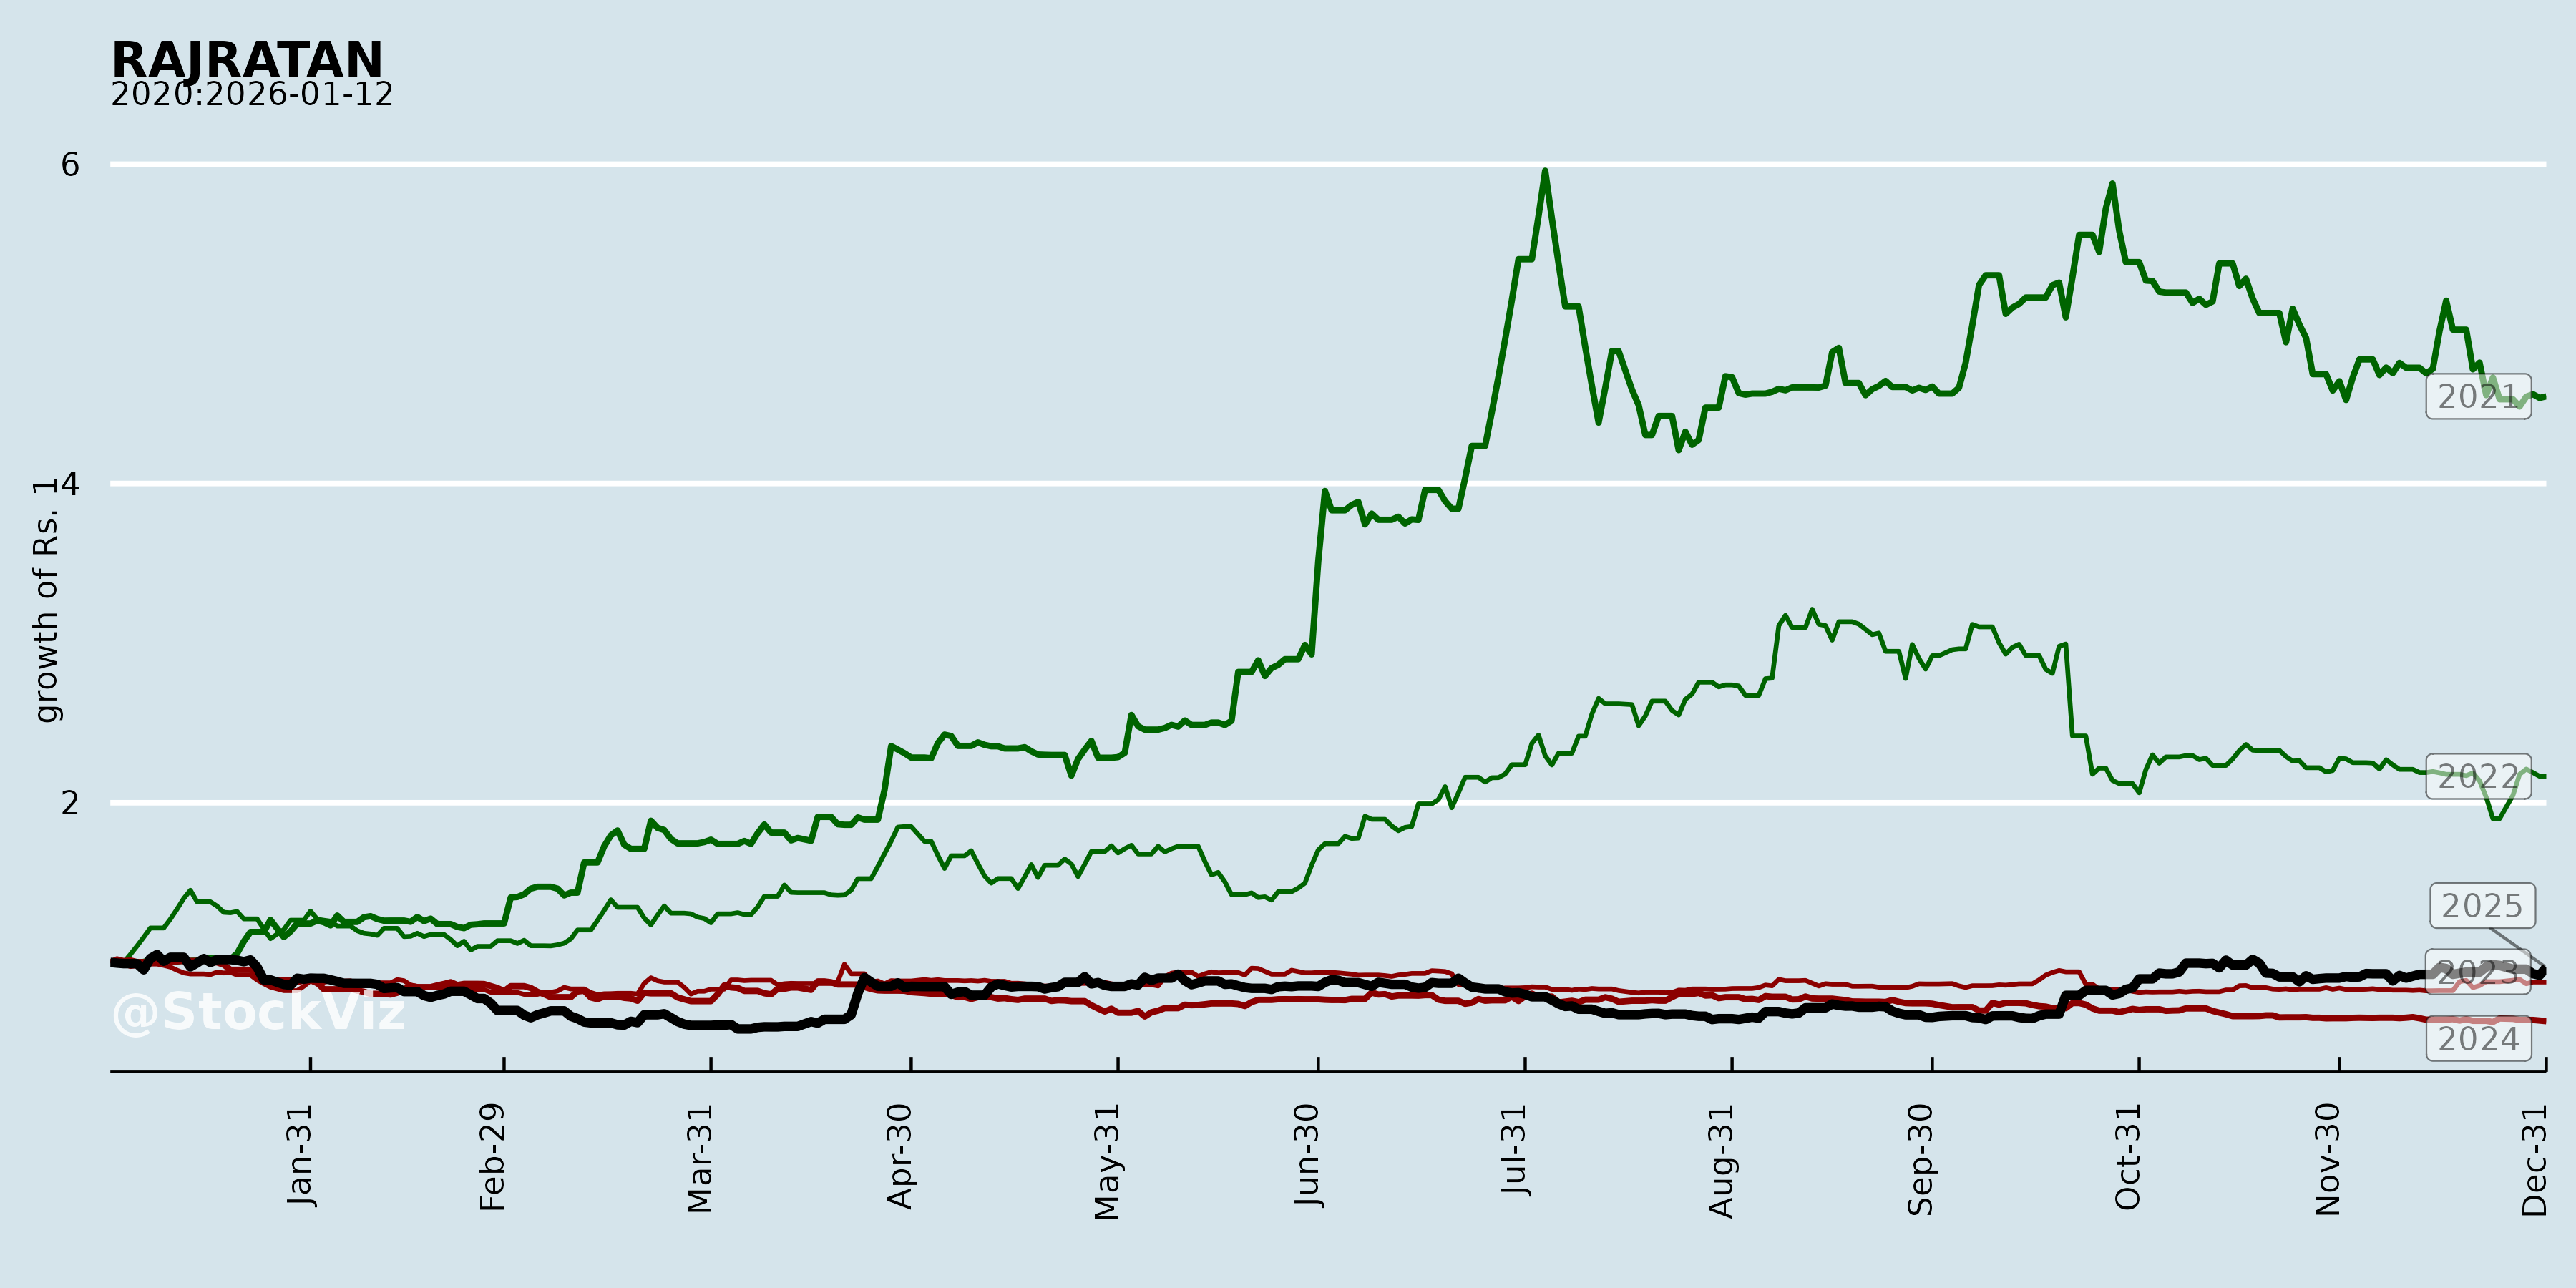
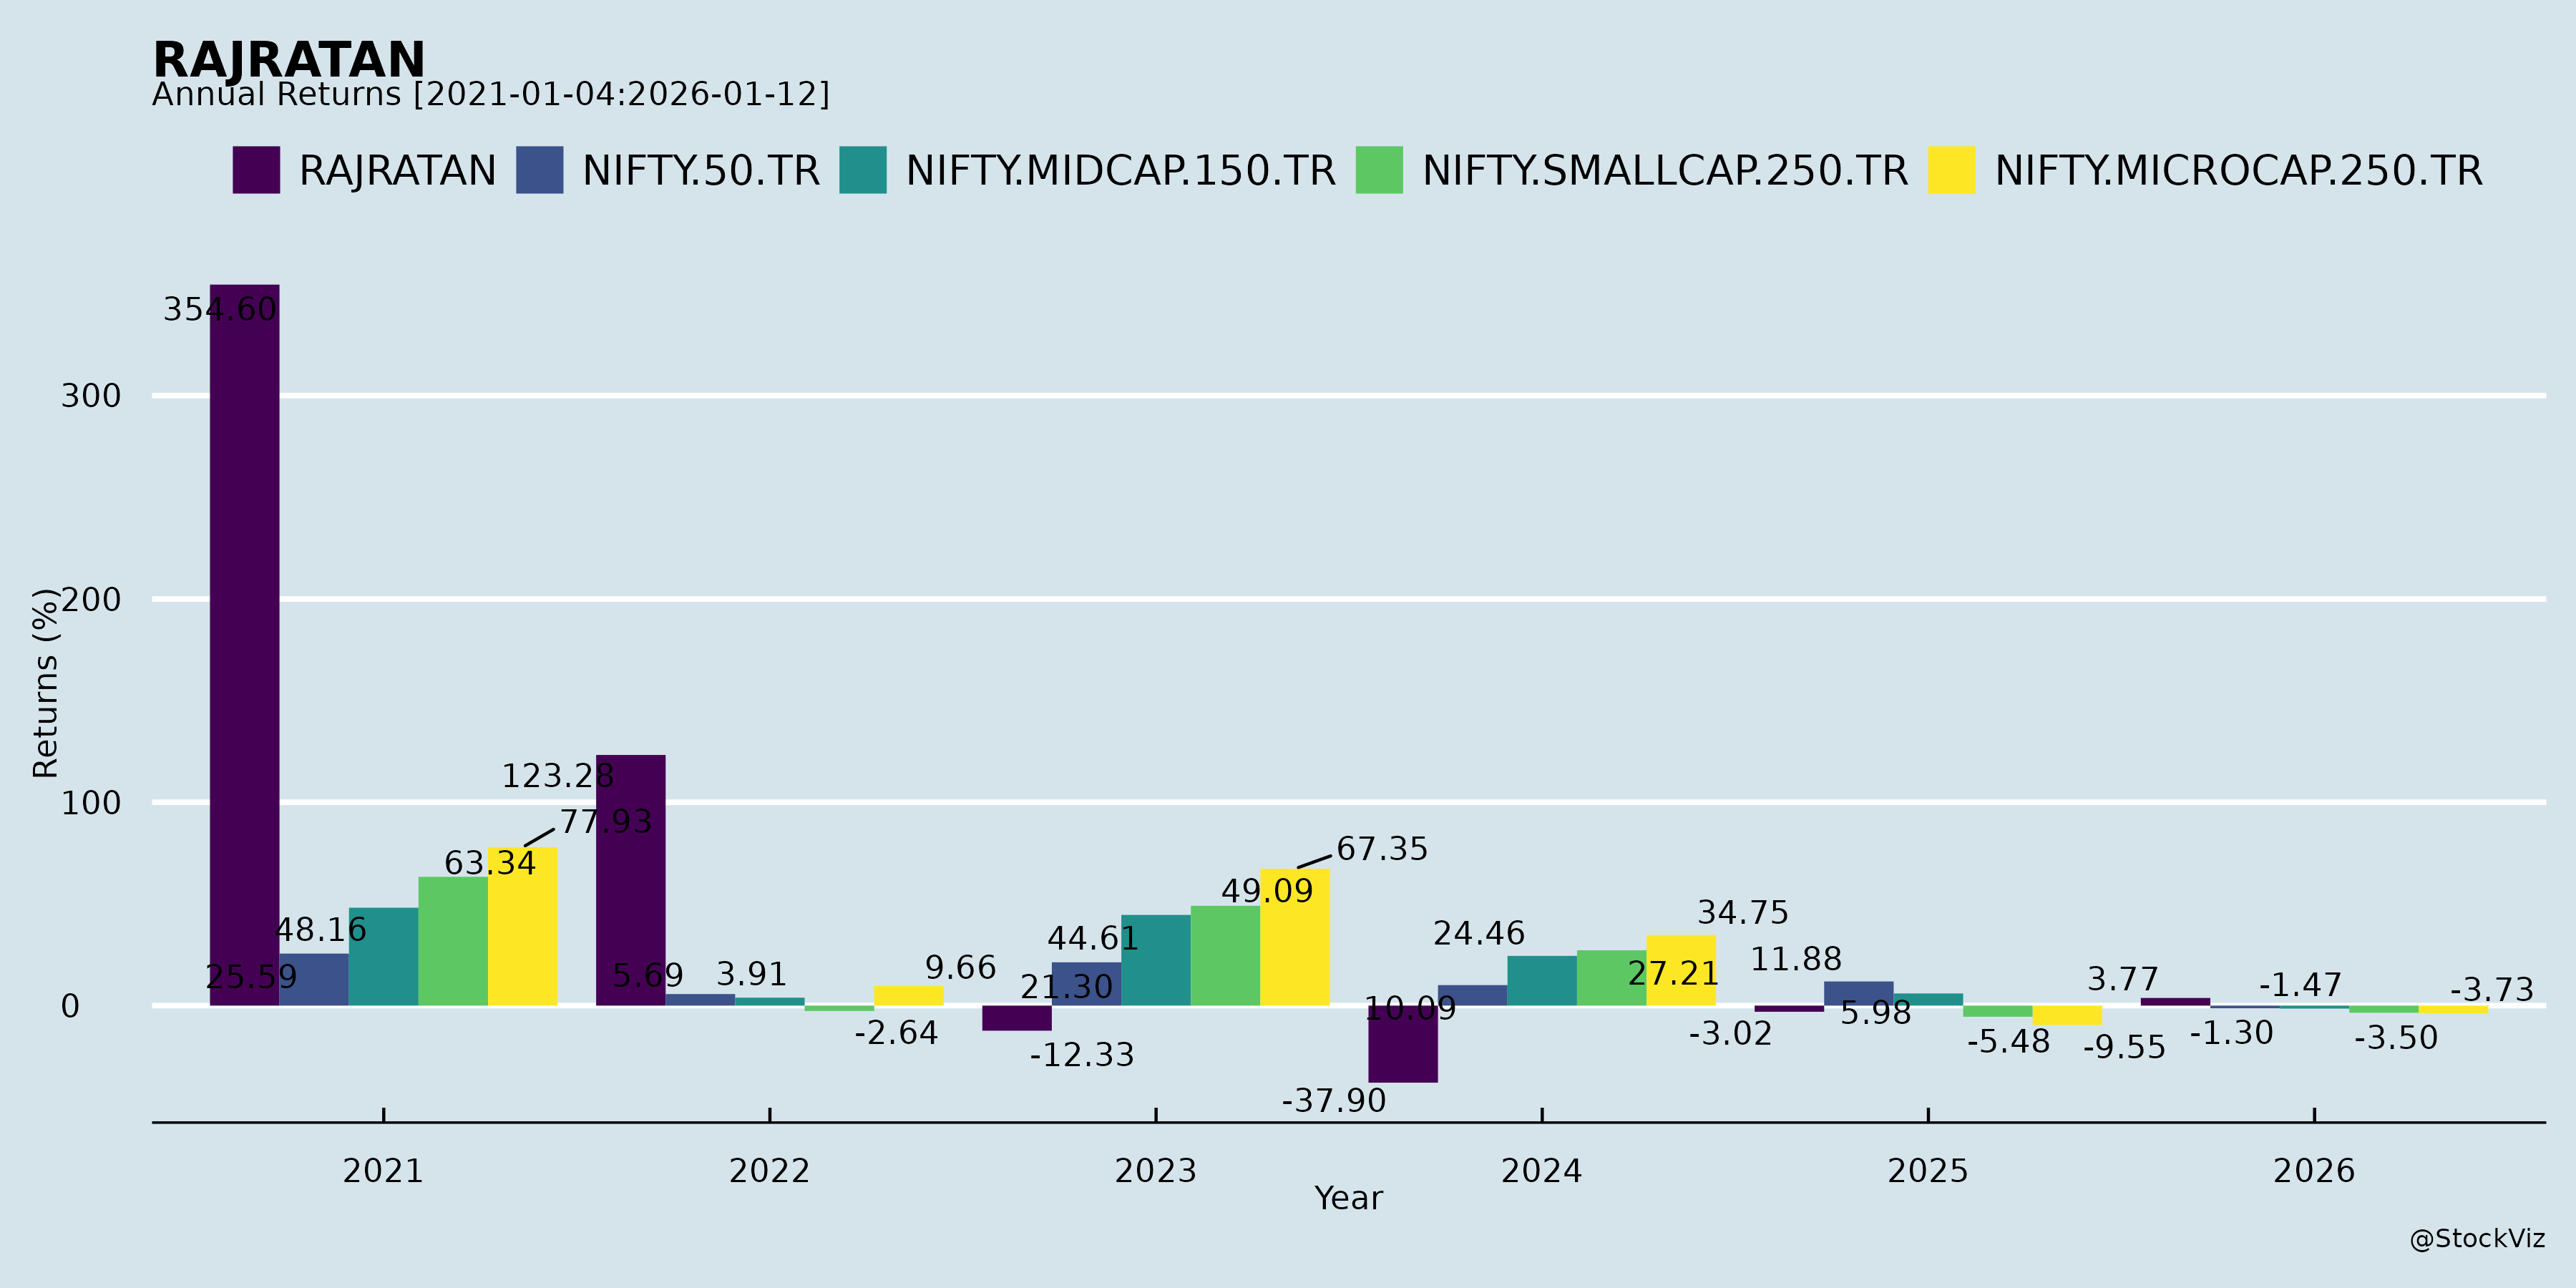
Annual Returns
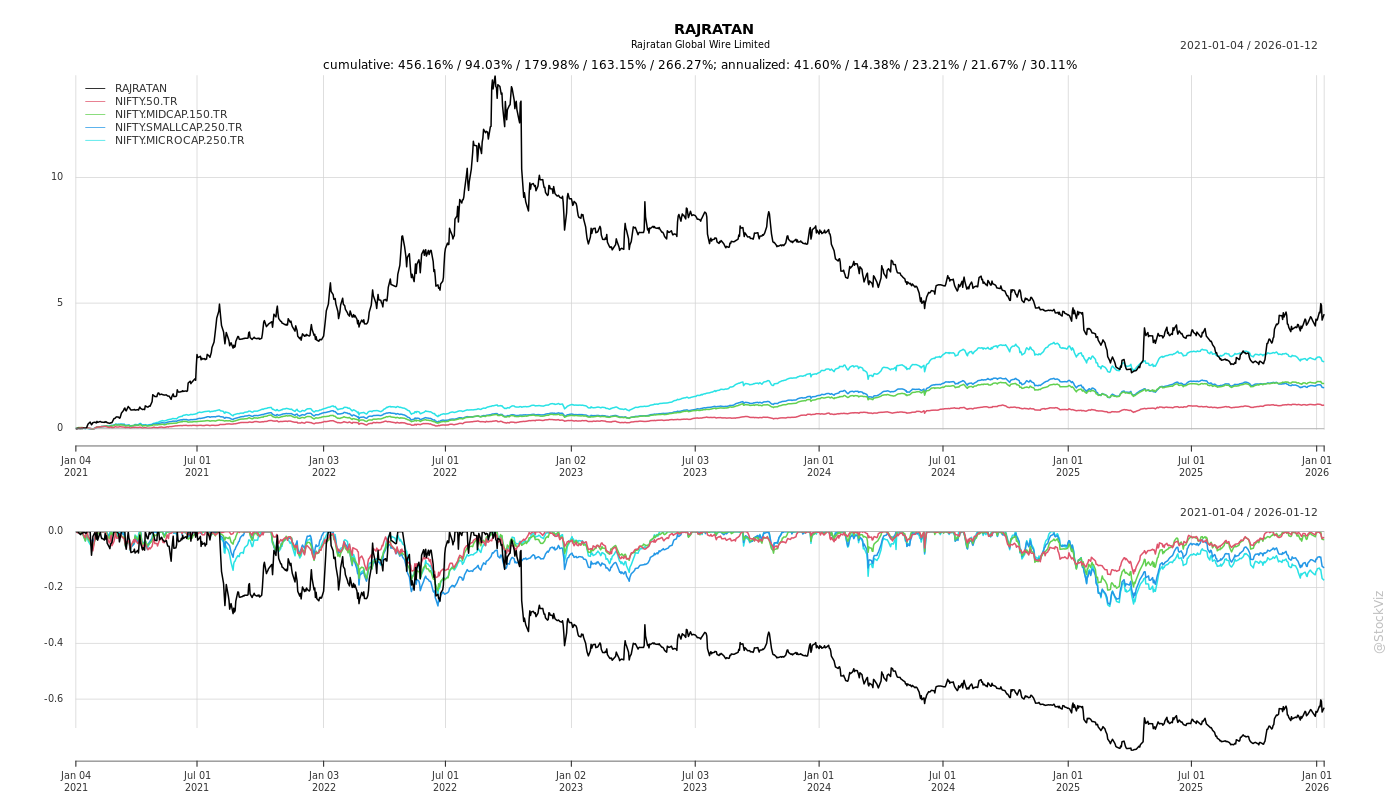
Cumulative Returns and Drawdowns
Fundamentals
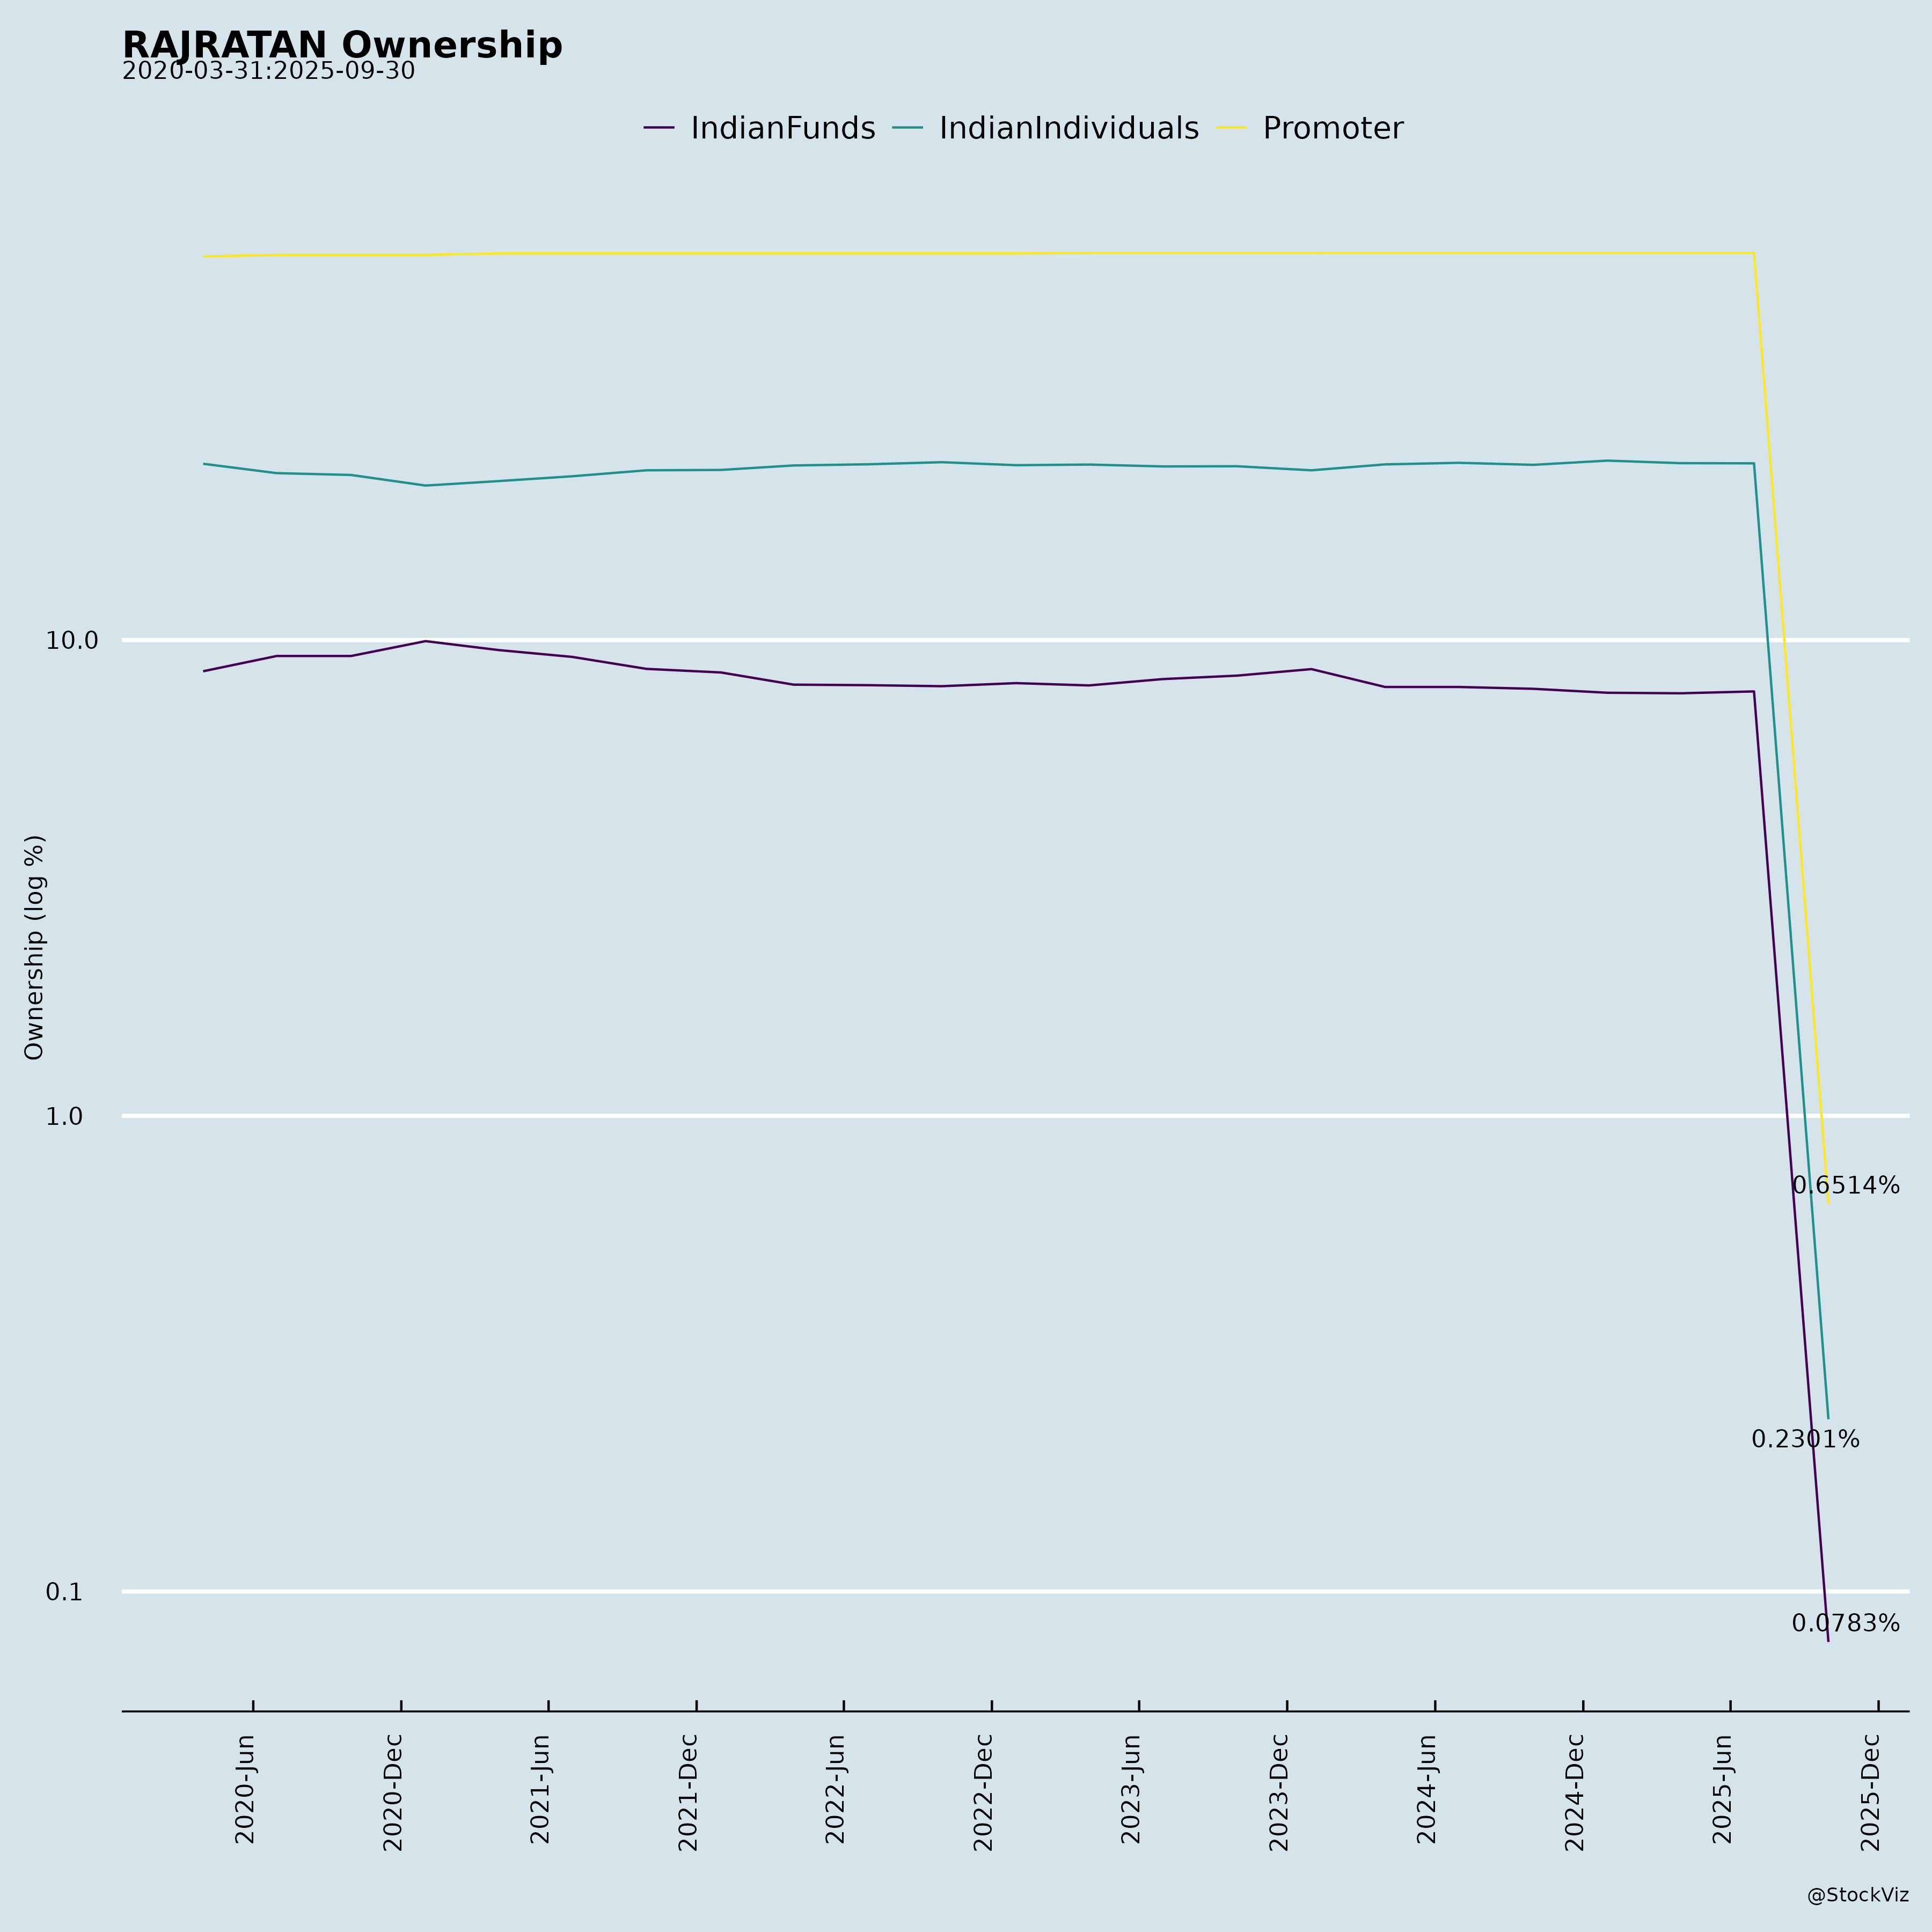
Ownership
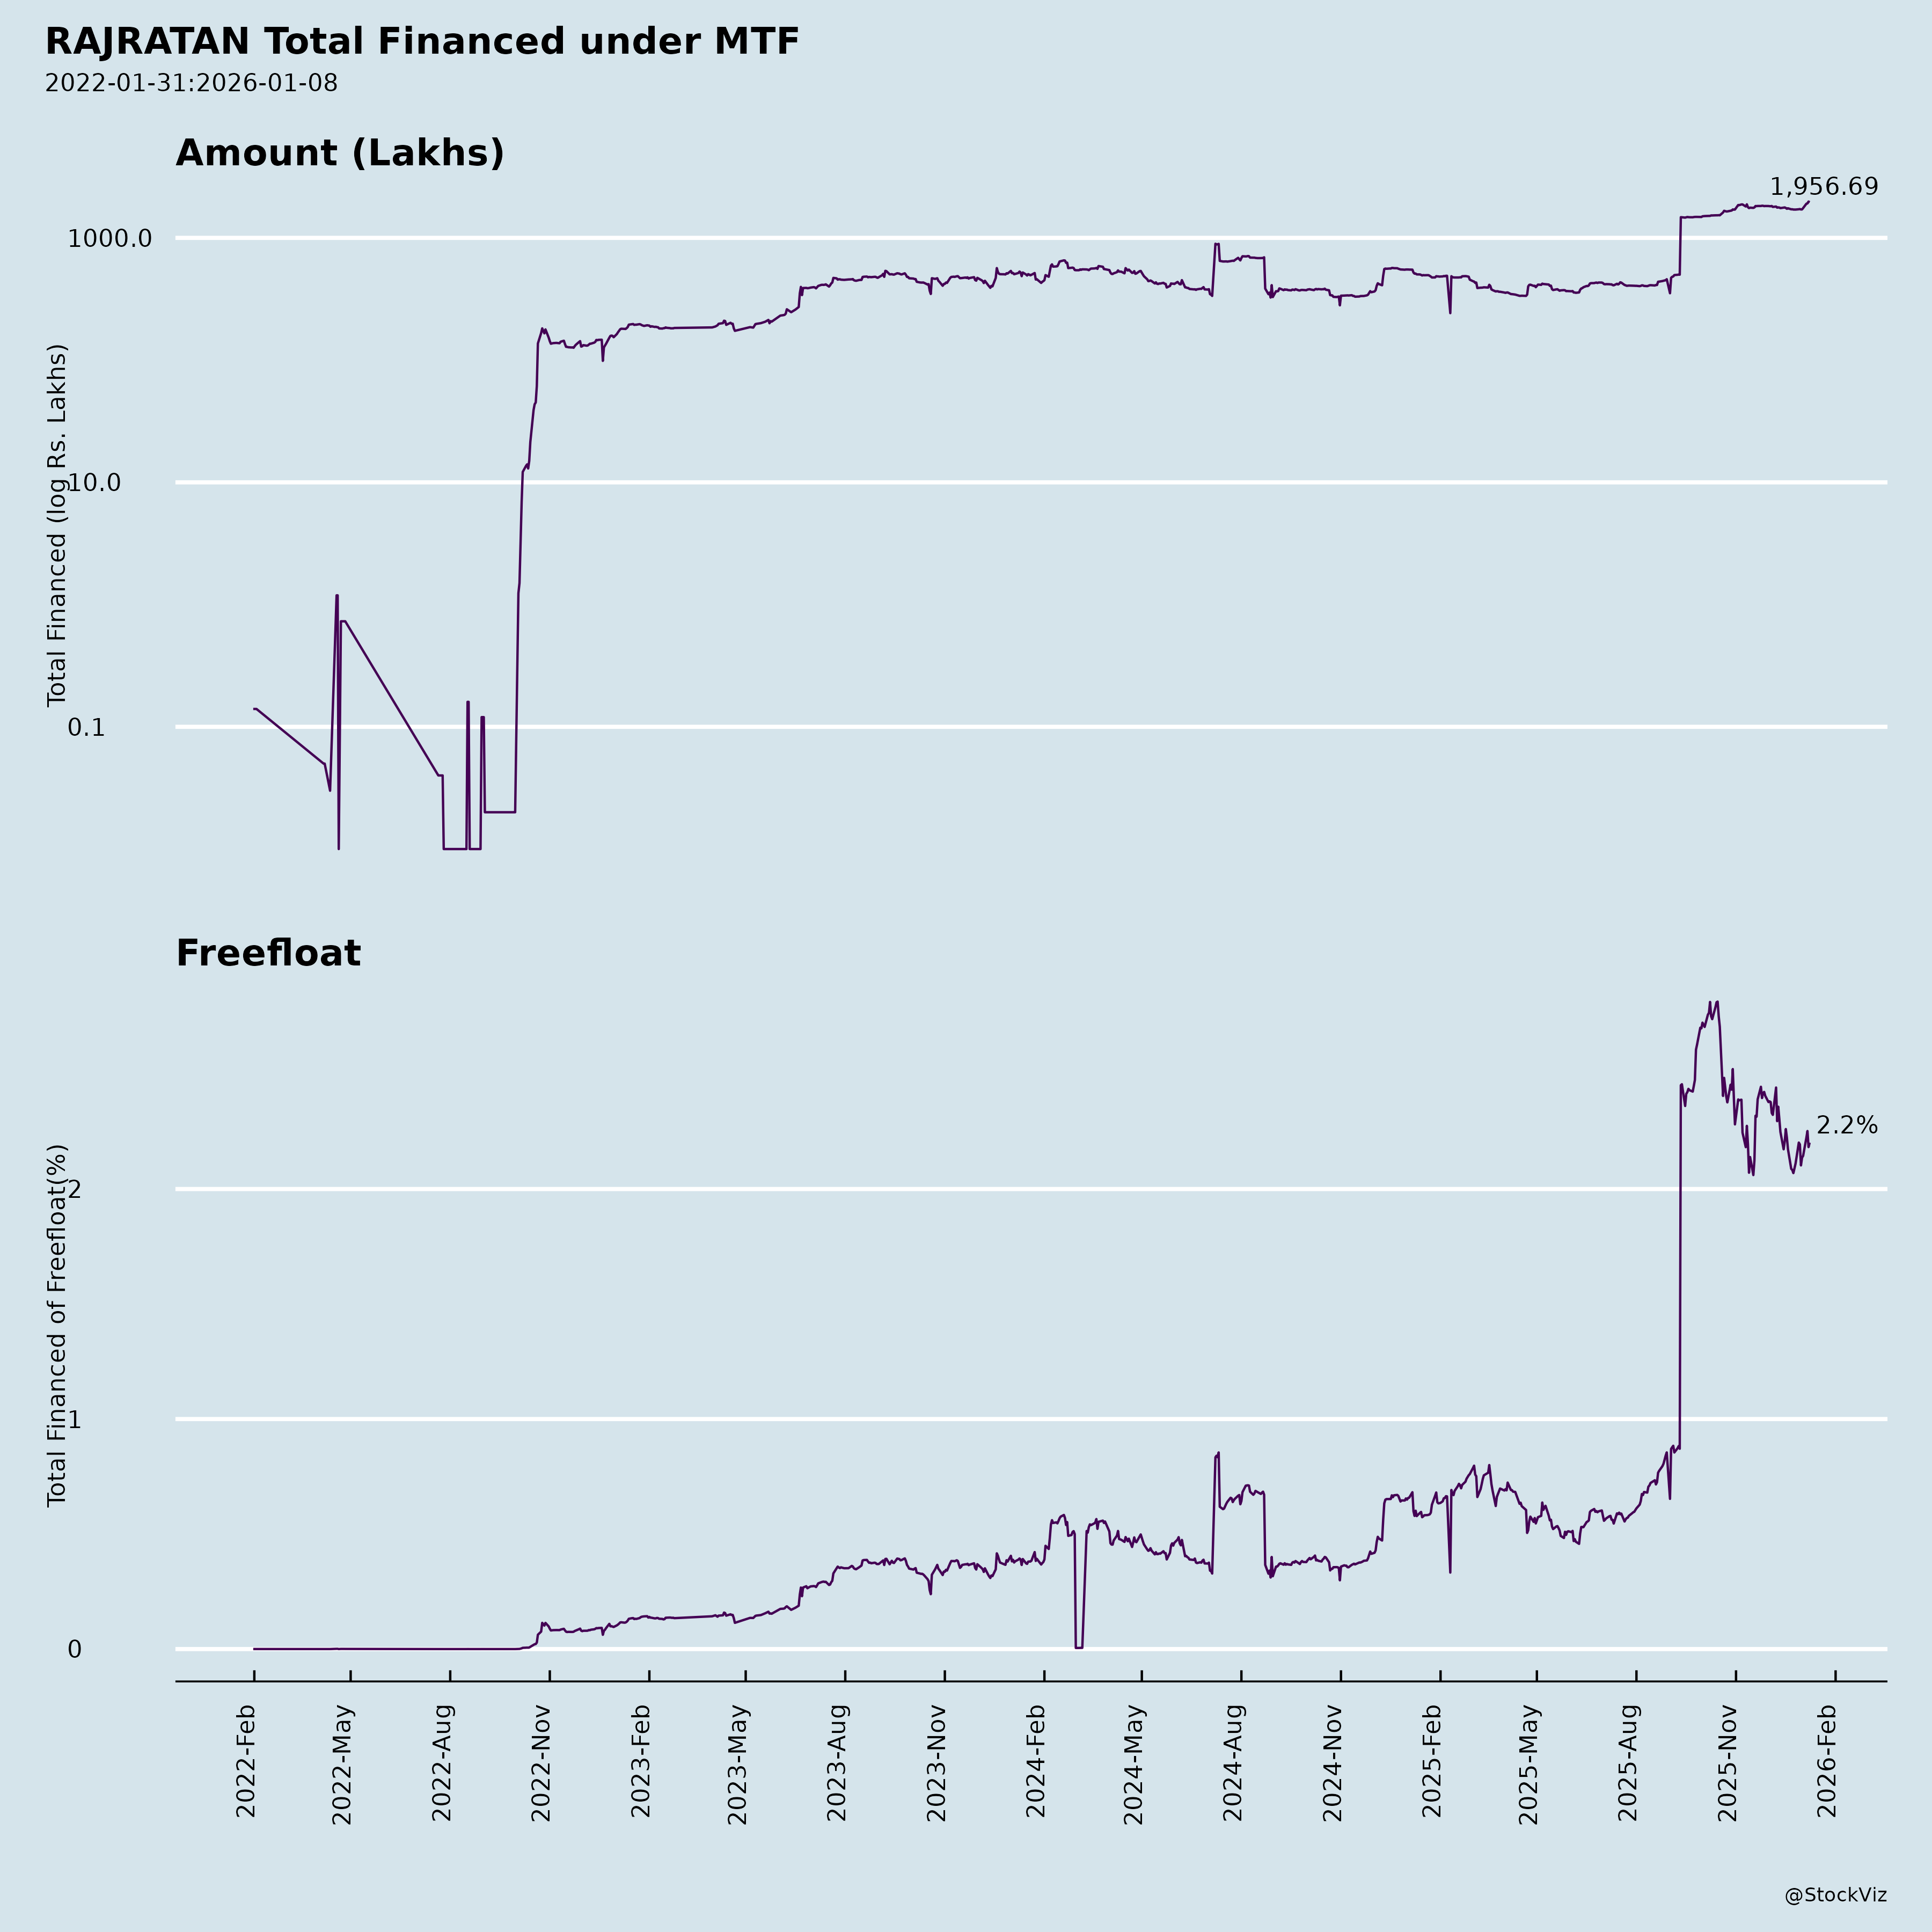
Margined
AI Summary
asof: 2025-11-27
Analysis of Rajratan Global Wire Limited (RAJRATAN)
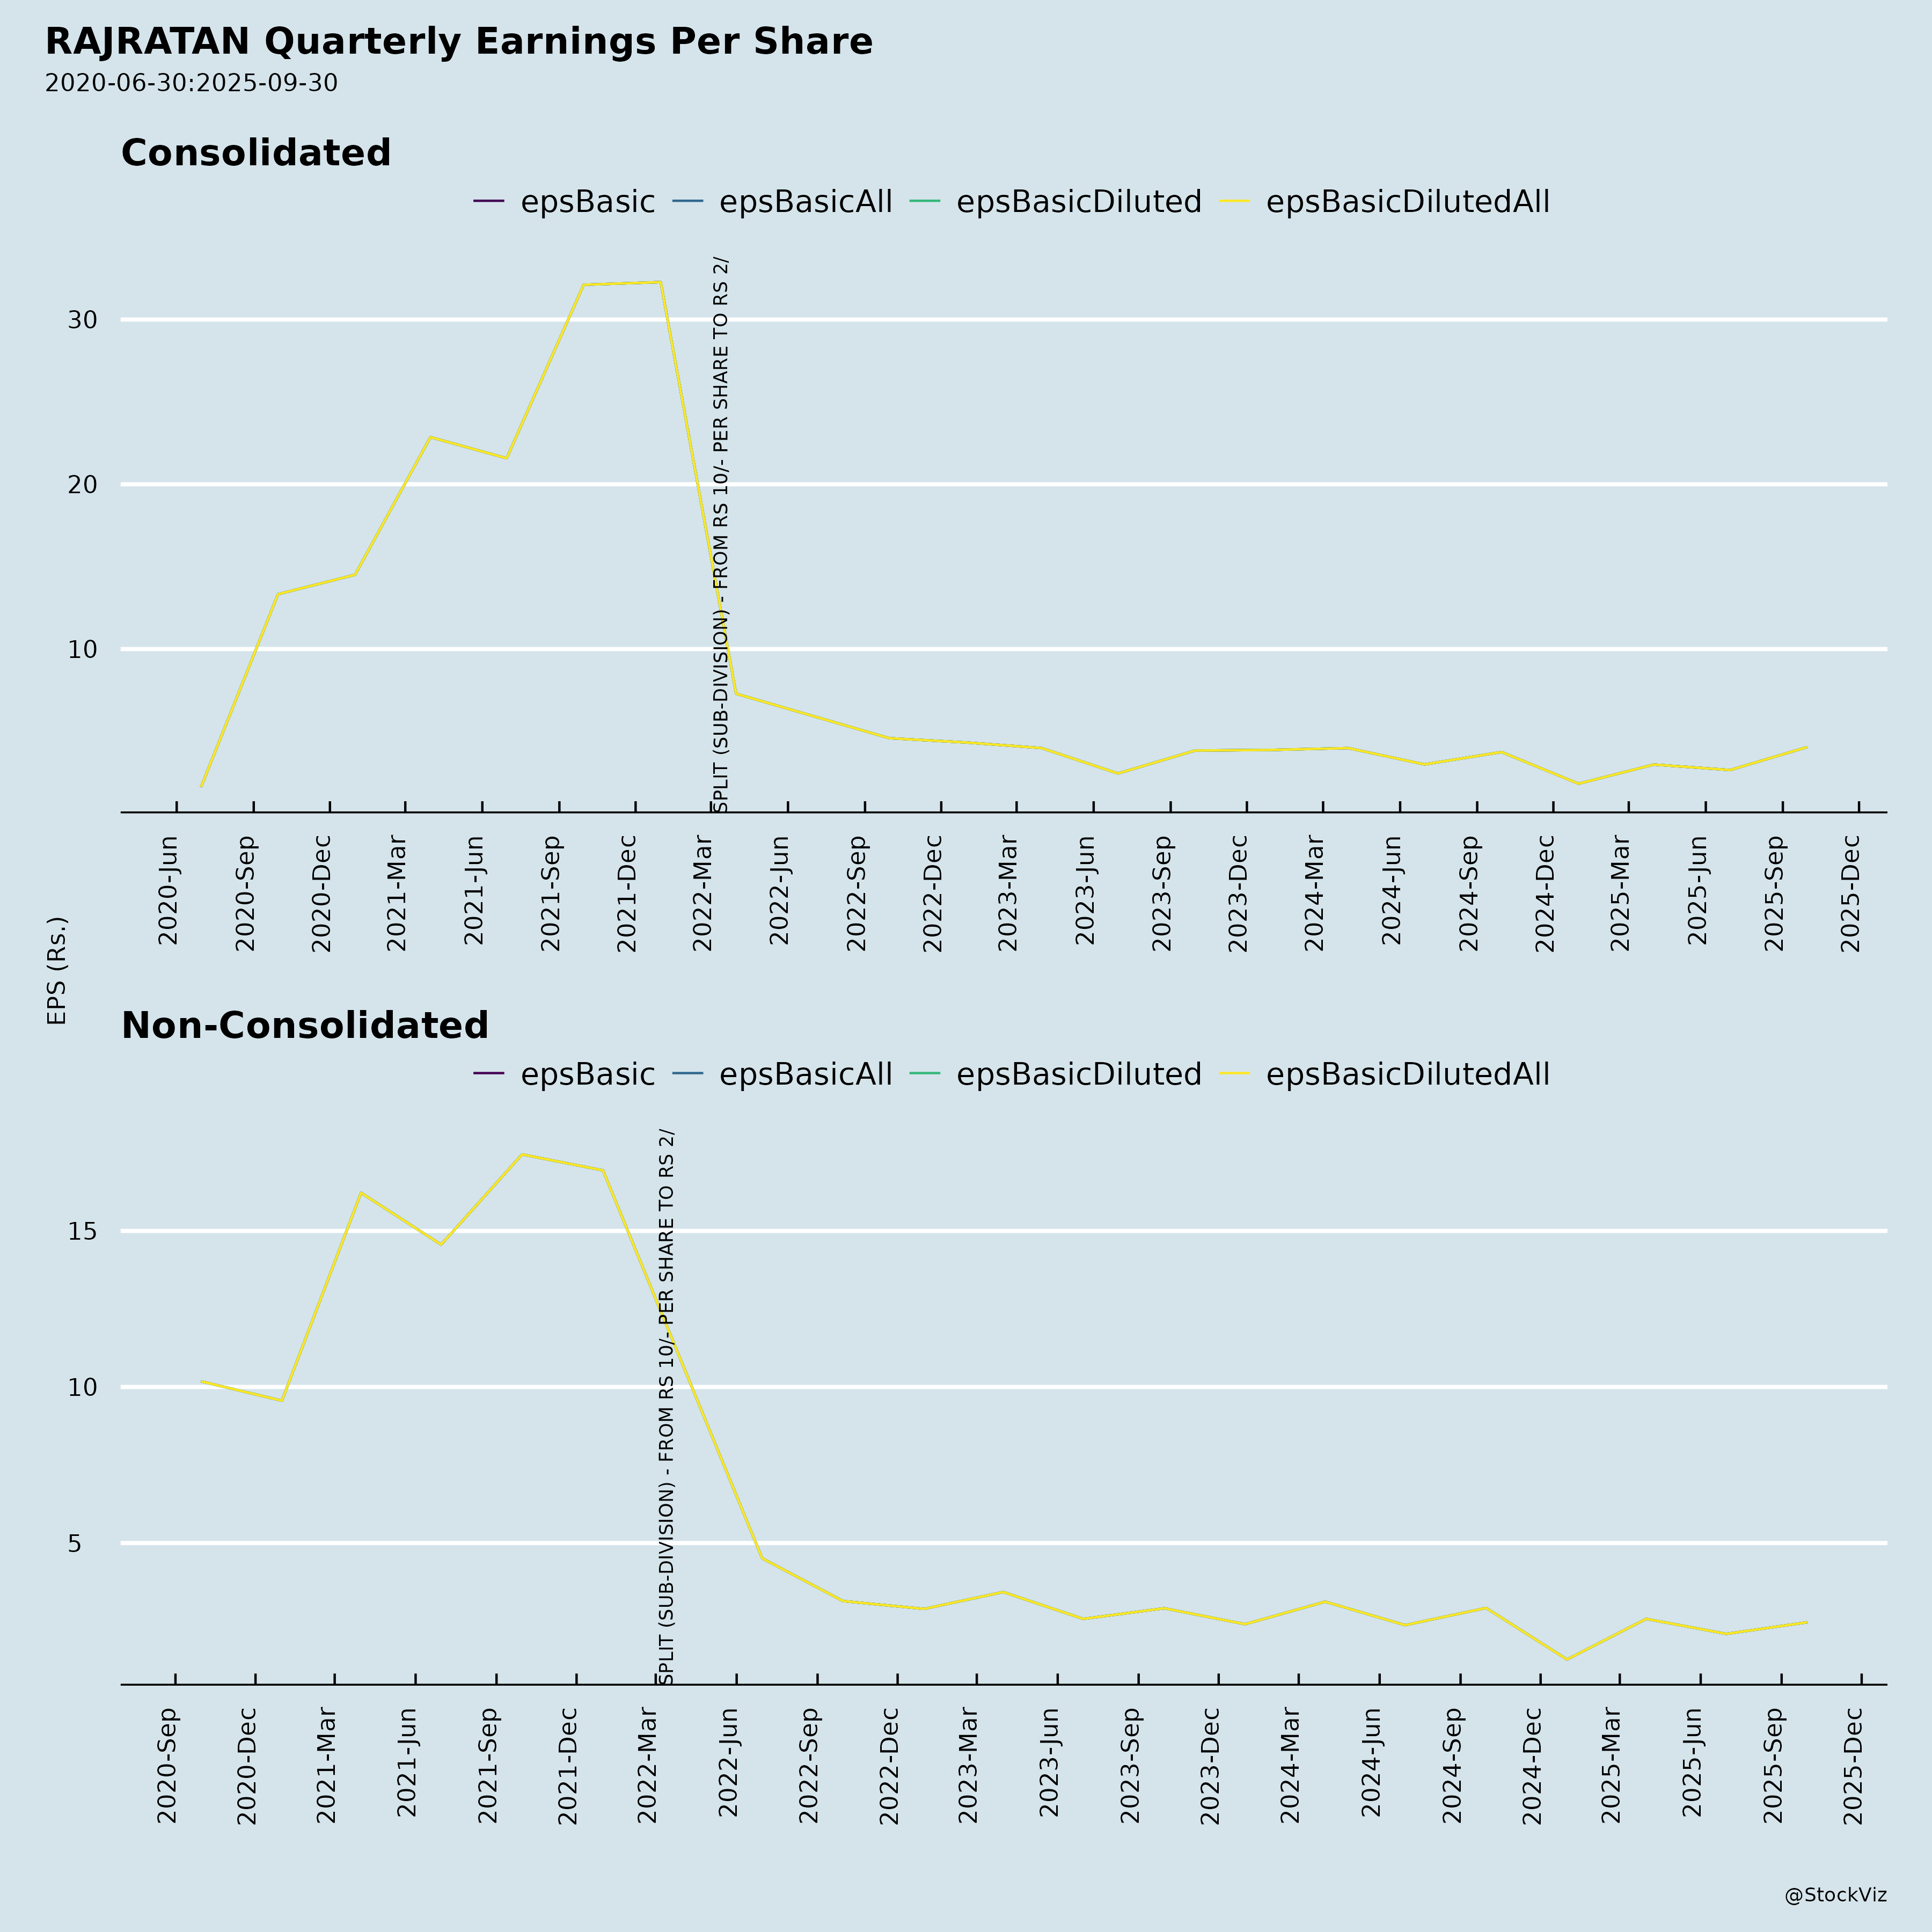
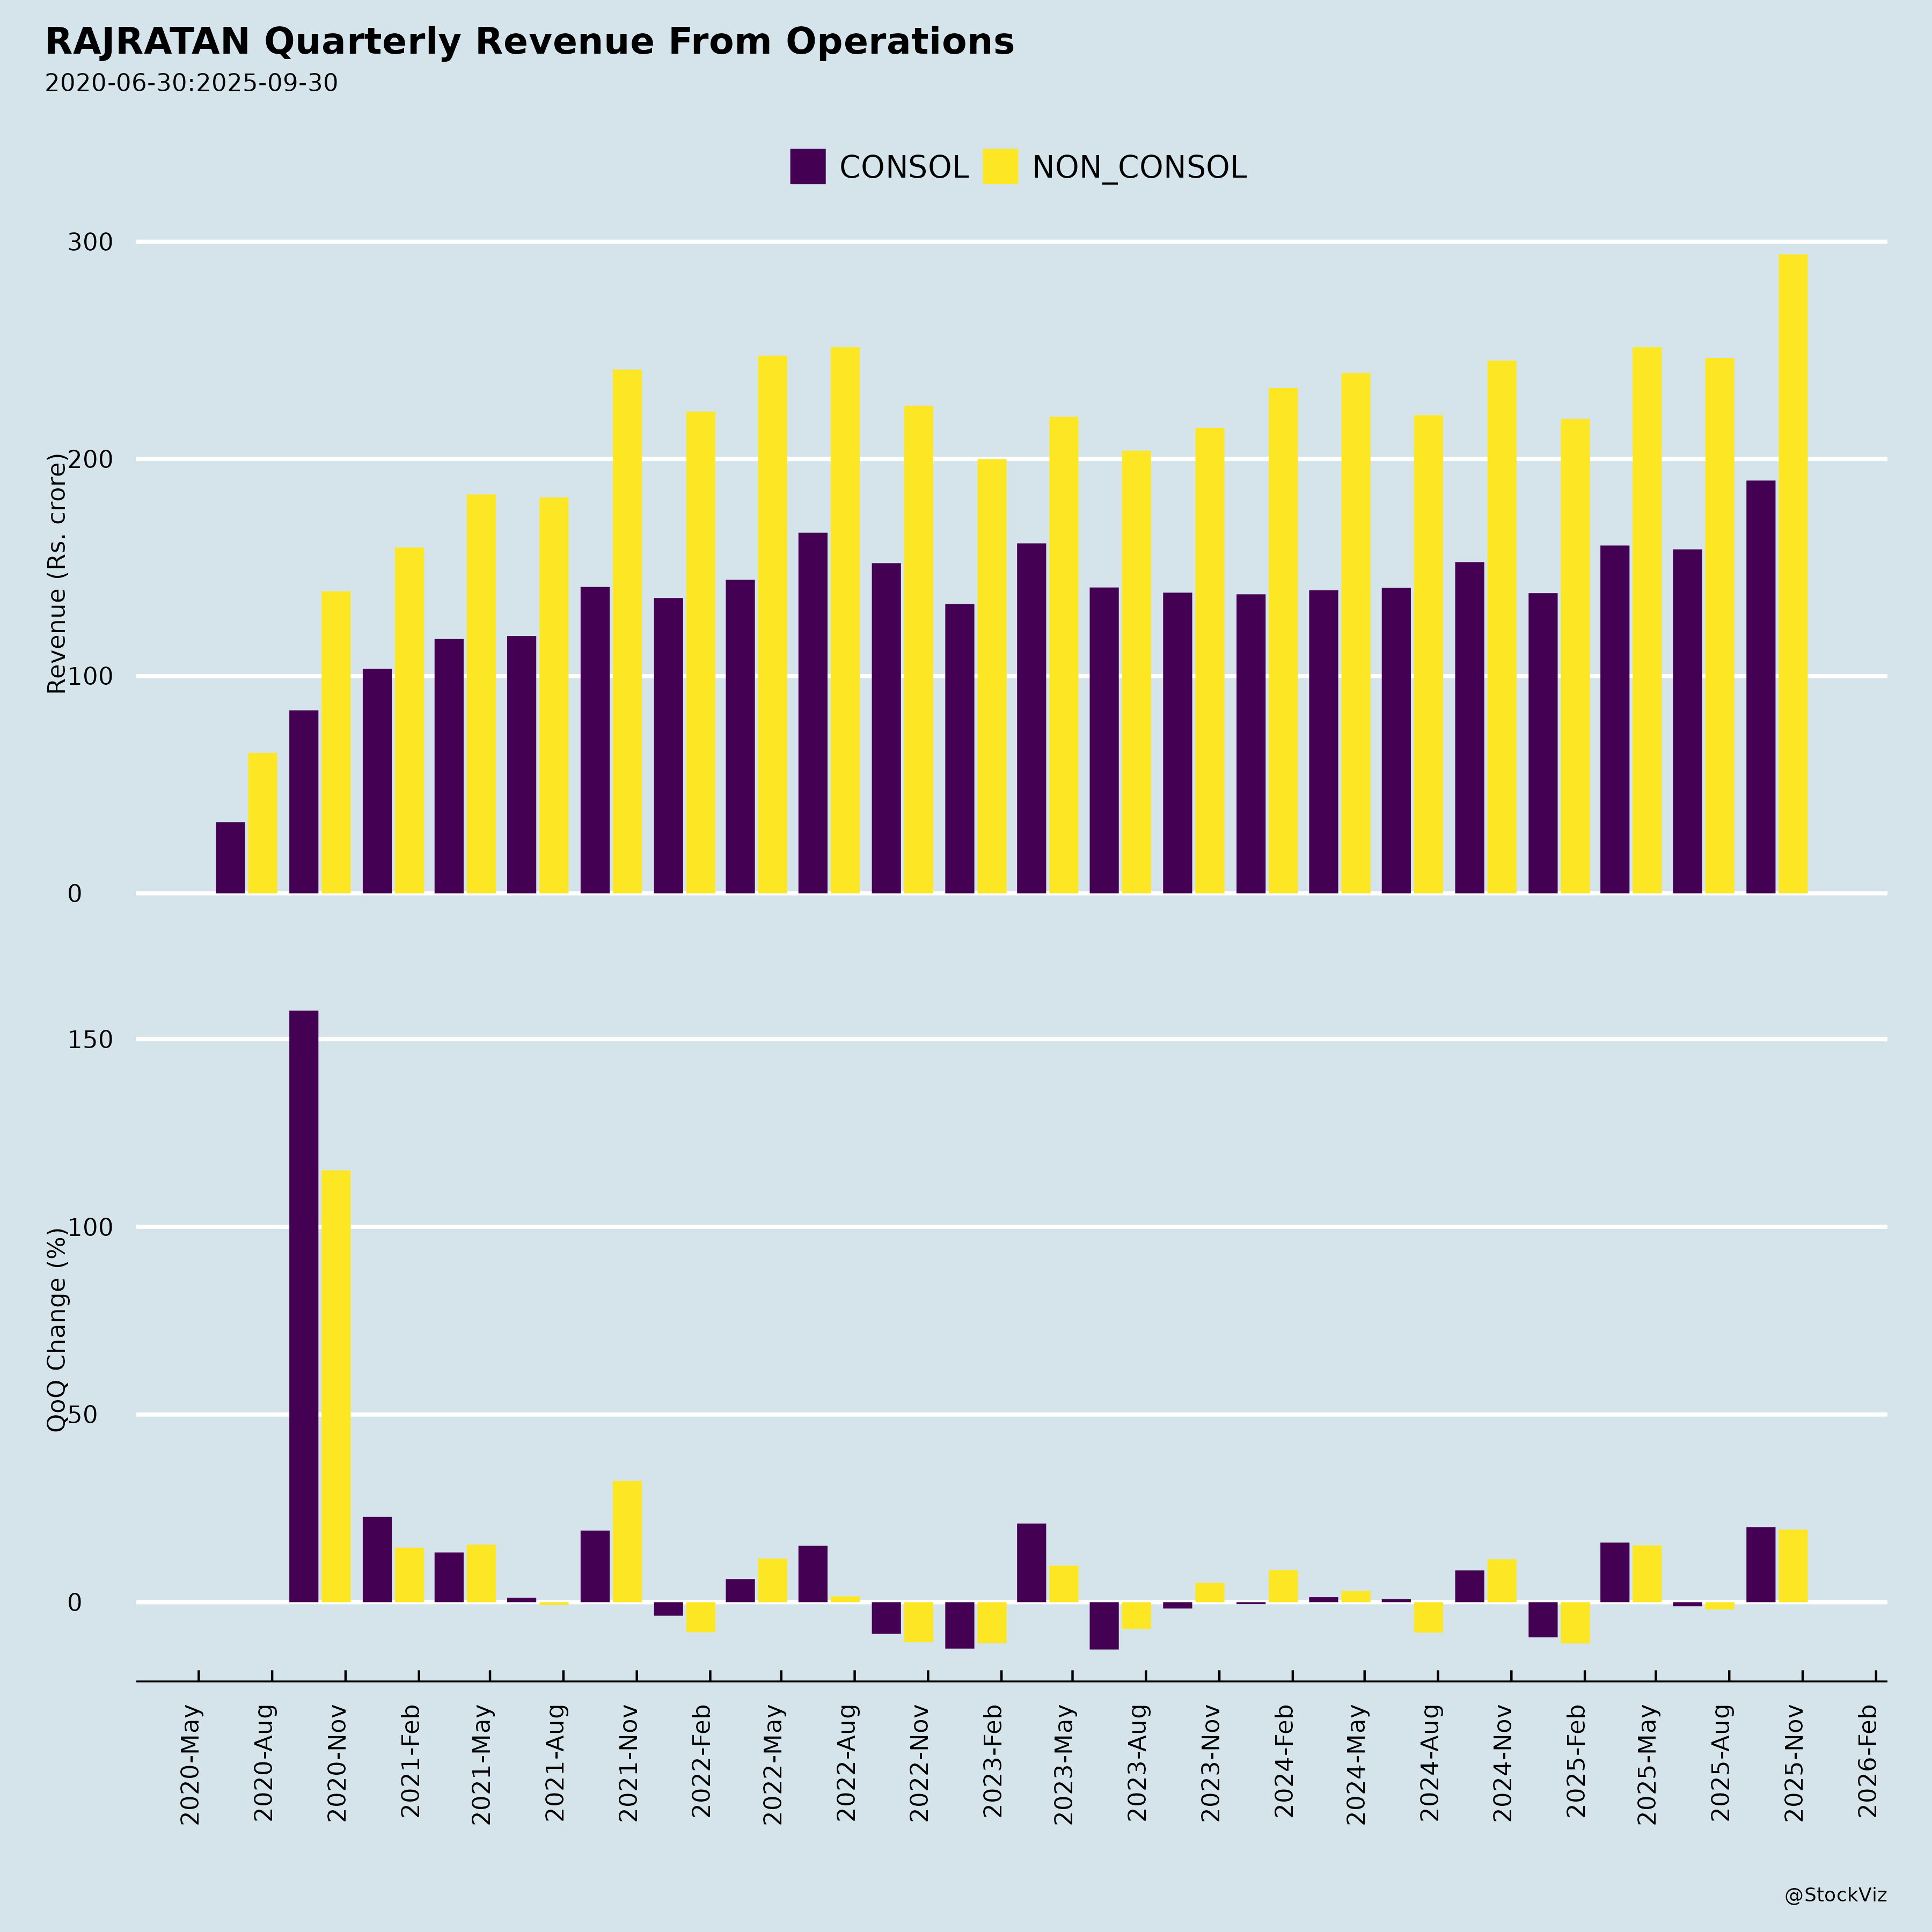
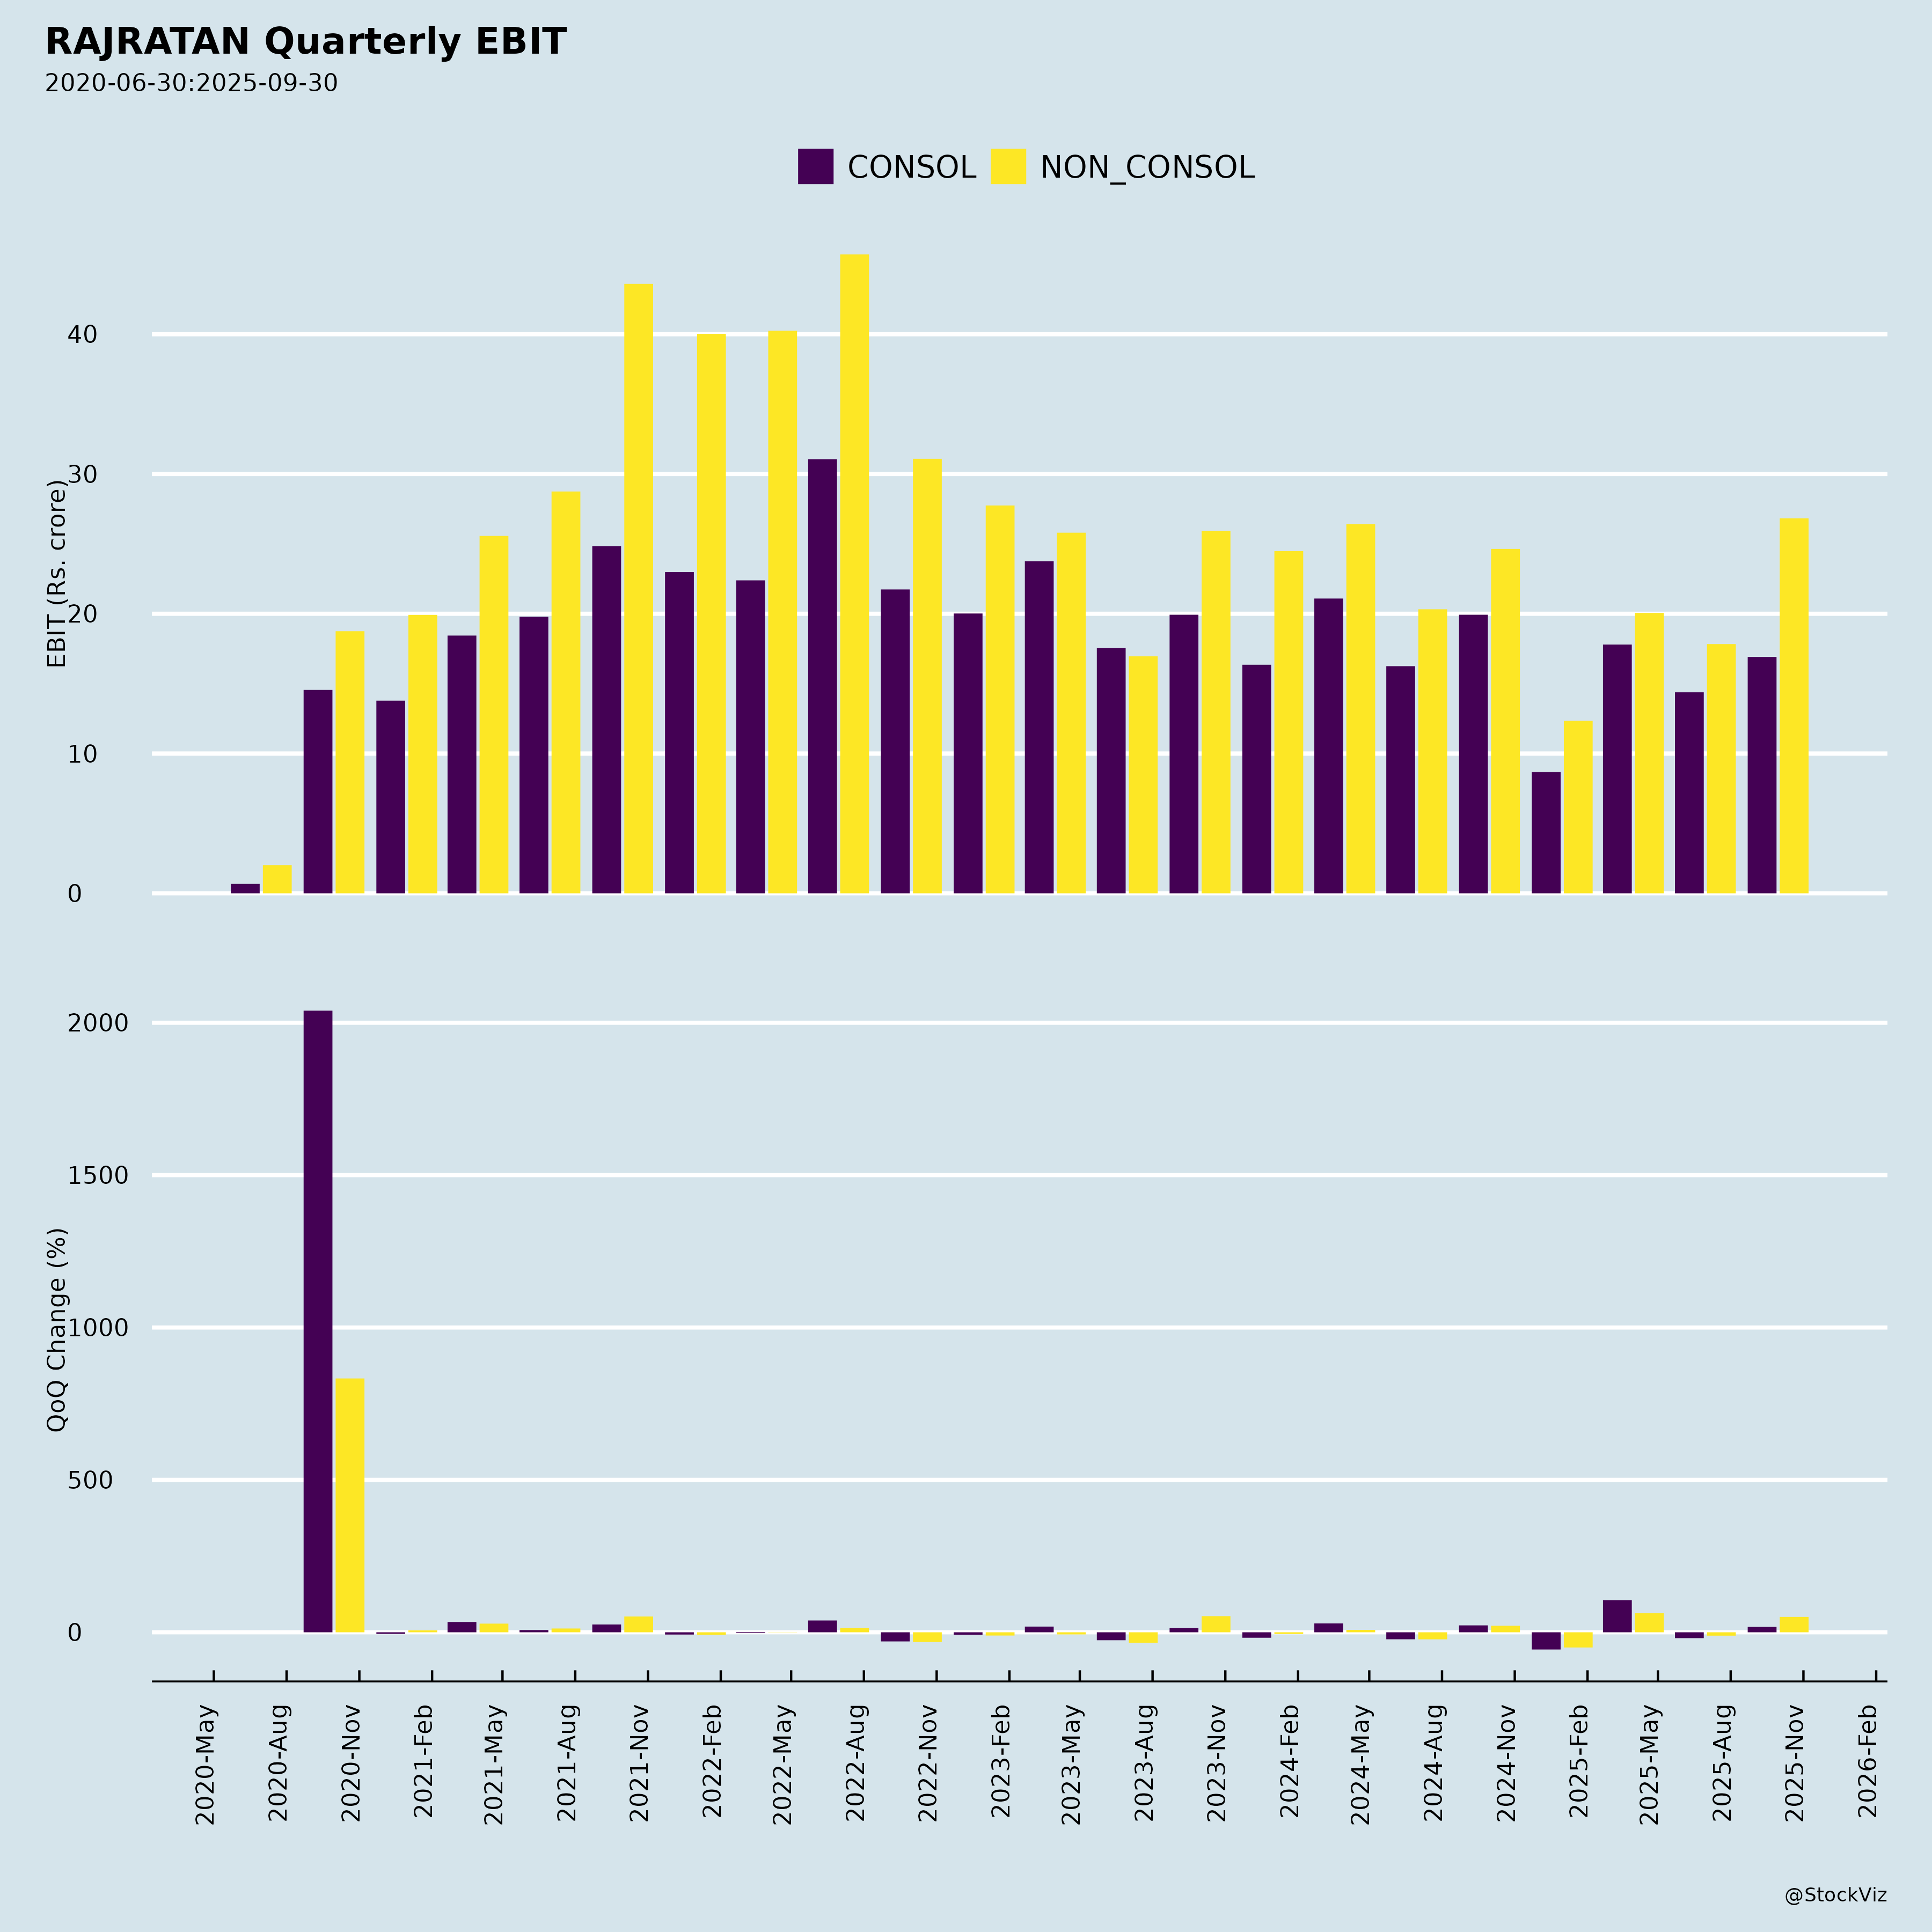
Rajratan Global Wire Ltd. is a leading bead wire manufacturer for the tire industry, with operations in India (Pithampur and new greenfield Chennai plant) and Thailand. Total capacity: ~192,000 TPA (India 132k TPA phased, Thailand 60k TPA). Q2 FY26 (Jul-Sep 2025) showed robust volume growth (consolidated +15% YoY to 32,887 MT, highest ever), revenue +20% YoY to ₹294 Cr, EBITDA +6% to ₹40 Cr (13.6% margin), and PAT +8% to ₹20.6 Cr. India contributed 66% revenue, Thailand 34%. Market cap ~₹1,609 Cr (Sep 30, 2025). Below is a structured analysis based on the provided disclosures.
Tailwinds (Positive Drivers)
- Operational Turnaround & Capacity Ramp-Up: Chennai plant (Phase 1: 30k TPA) achieved 60% utilization in H2 Q2, turned profitable within 12 months. Enabled geographic reallocation (Pithampur focuses on premium markets), logistical savings, and 33% export revenue share, reducing India dependency.
- Volume Leadership & Market Share Gains: Record bead wire sales (29k MT); India +21% YoY, Thailand +5% YoY (91% utilization). Strong client base (Apollo, MRF, Michelin, Bridgestone, etc.).
- Thailand Stability: Resilient against Chinese imports via premium mix, exports, and quality customers; sustained profitability.
- Sustainability Push: ₹1.44 Cr investment (9.43% stake) in Lilac Ecoenergy Pvt Ltd for captive solar/wind power (ops from Jan 2026). MOA/AOA amended for regulatory compliance; green energy at Thailand/Chennai plants to cut costs.
- Financial Health: H1 FY26 revenue +16% YoY to ₹541 Cr; debt manageable (net debt/equity ~0.6x consolidated); positive cash flow trends expected.
Headwinds (Challenges)
- Margin Pressure from Capacity Additions & Competition: Industry bead wire capacity growth capped realizations; softer steel prices reduced India margins. EBITDA margin dipped 184 bps YoY to 13.6%; PAT margin -78 bps.
- Realization Moderation: Q2 demand up ~5% but pricing softer due to raw material declines and domestic/international rivalry (esp. Chinese in Thailand).
- Macro/Trade Headwinds: US export tariff uncertainties; broader competition containing pricing power.
Growth Prospects
- Volume & Utilization Expansion: Chennai ramp-up to full 60k TPA; expect higher Q3/H2 volumes, fixed cost amortization. Consolidated outlook: Sustain momentum with GST rationalization boosting tire/auto offtake.
- Geographic Diversification: Chennai exports + premium India/Thailand markets; target higher Thailand share.
- Cost Efficiencies: Captive green power (completion by Mar 2026) for energy savings; resource efficiency (recyclables, chemical reuse).
- Market Tailwinds: Tire industry recovery; “network effect” of multi-location ops unique in India. Chairman eyes sustained performance with 10% Thailand variation.
- Potential: H1 volumes +11% YoY; full-year guidance implicit in Q3 outlook (higher sales/utilization/contained steel costs).
Key Risks
| Risk Category | Description | Mitigation (from Disclosures) |
|---|---|---|
| Competition & Pricing | Intense domestic/global (Chinese) pressure; capacity glut eroding margins. | Premium customer mix; Chennai efficiency/exports. |
| Commodity Volatility | Steel/raw material price swings (softer prices hurt Q2 realizations). | Hedging not detailed; volume focus. |
| Execution/Operational | New plant ramp-up delays; capex heavy (₹44 Cr H1 investing outflow). | Chennai quick profitability validates. |
| Geopolitical/Trade | US tariff risks on exports; forex volatility (Thailand FCTR ₹198 Cr H1). | Diversified markets; stable Thailand ops. |
| Regulatory | Electricity laws for captive power; SEBI disclosures. | MOA/AOA amended; no special approvals needed. |
| Financial/Liquidity | Working capital strain (H1 CFO -₹50 Cr); debt ₹37 Cr current. | Strong YoY revenue growth; borrowing access. |
Overall Summary: RAJRATAN is in a strong growth phase post-Chennai commissioning, with tailwinds from volume surges and efficiencies outweighing headwinds like margin compression. FY26 prospects bright (10-15%+ volume growth implied), driven by capacity utilization and green energy savings, but sustained competition remains a watch item. Risks are manageable with proven execution; stock suits growth-oriented investors amid tire sector recovery. (Analysis solely from Q2 FY26 filings; monitor Q3 for validation.)
Copyright © 2023 SAS Data Analytics Pvt. Ltd. All rights reserved.