PVRINOX
Equity Metrics
September 24, 2026
PVR INOX Limited
Film Production Distribution & Exhibition
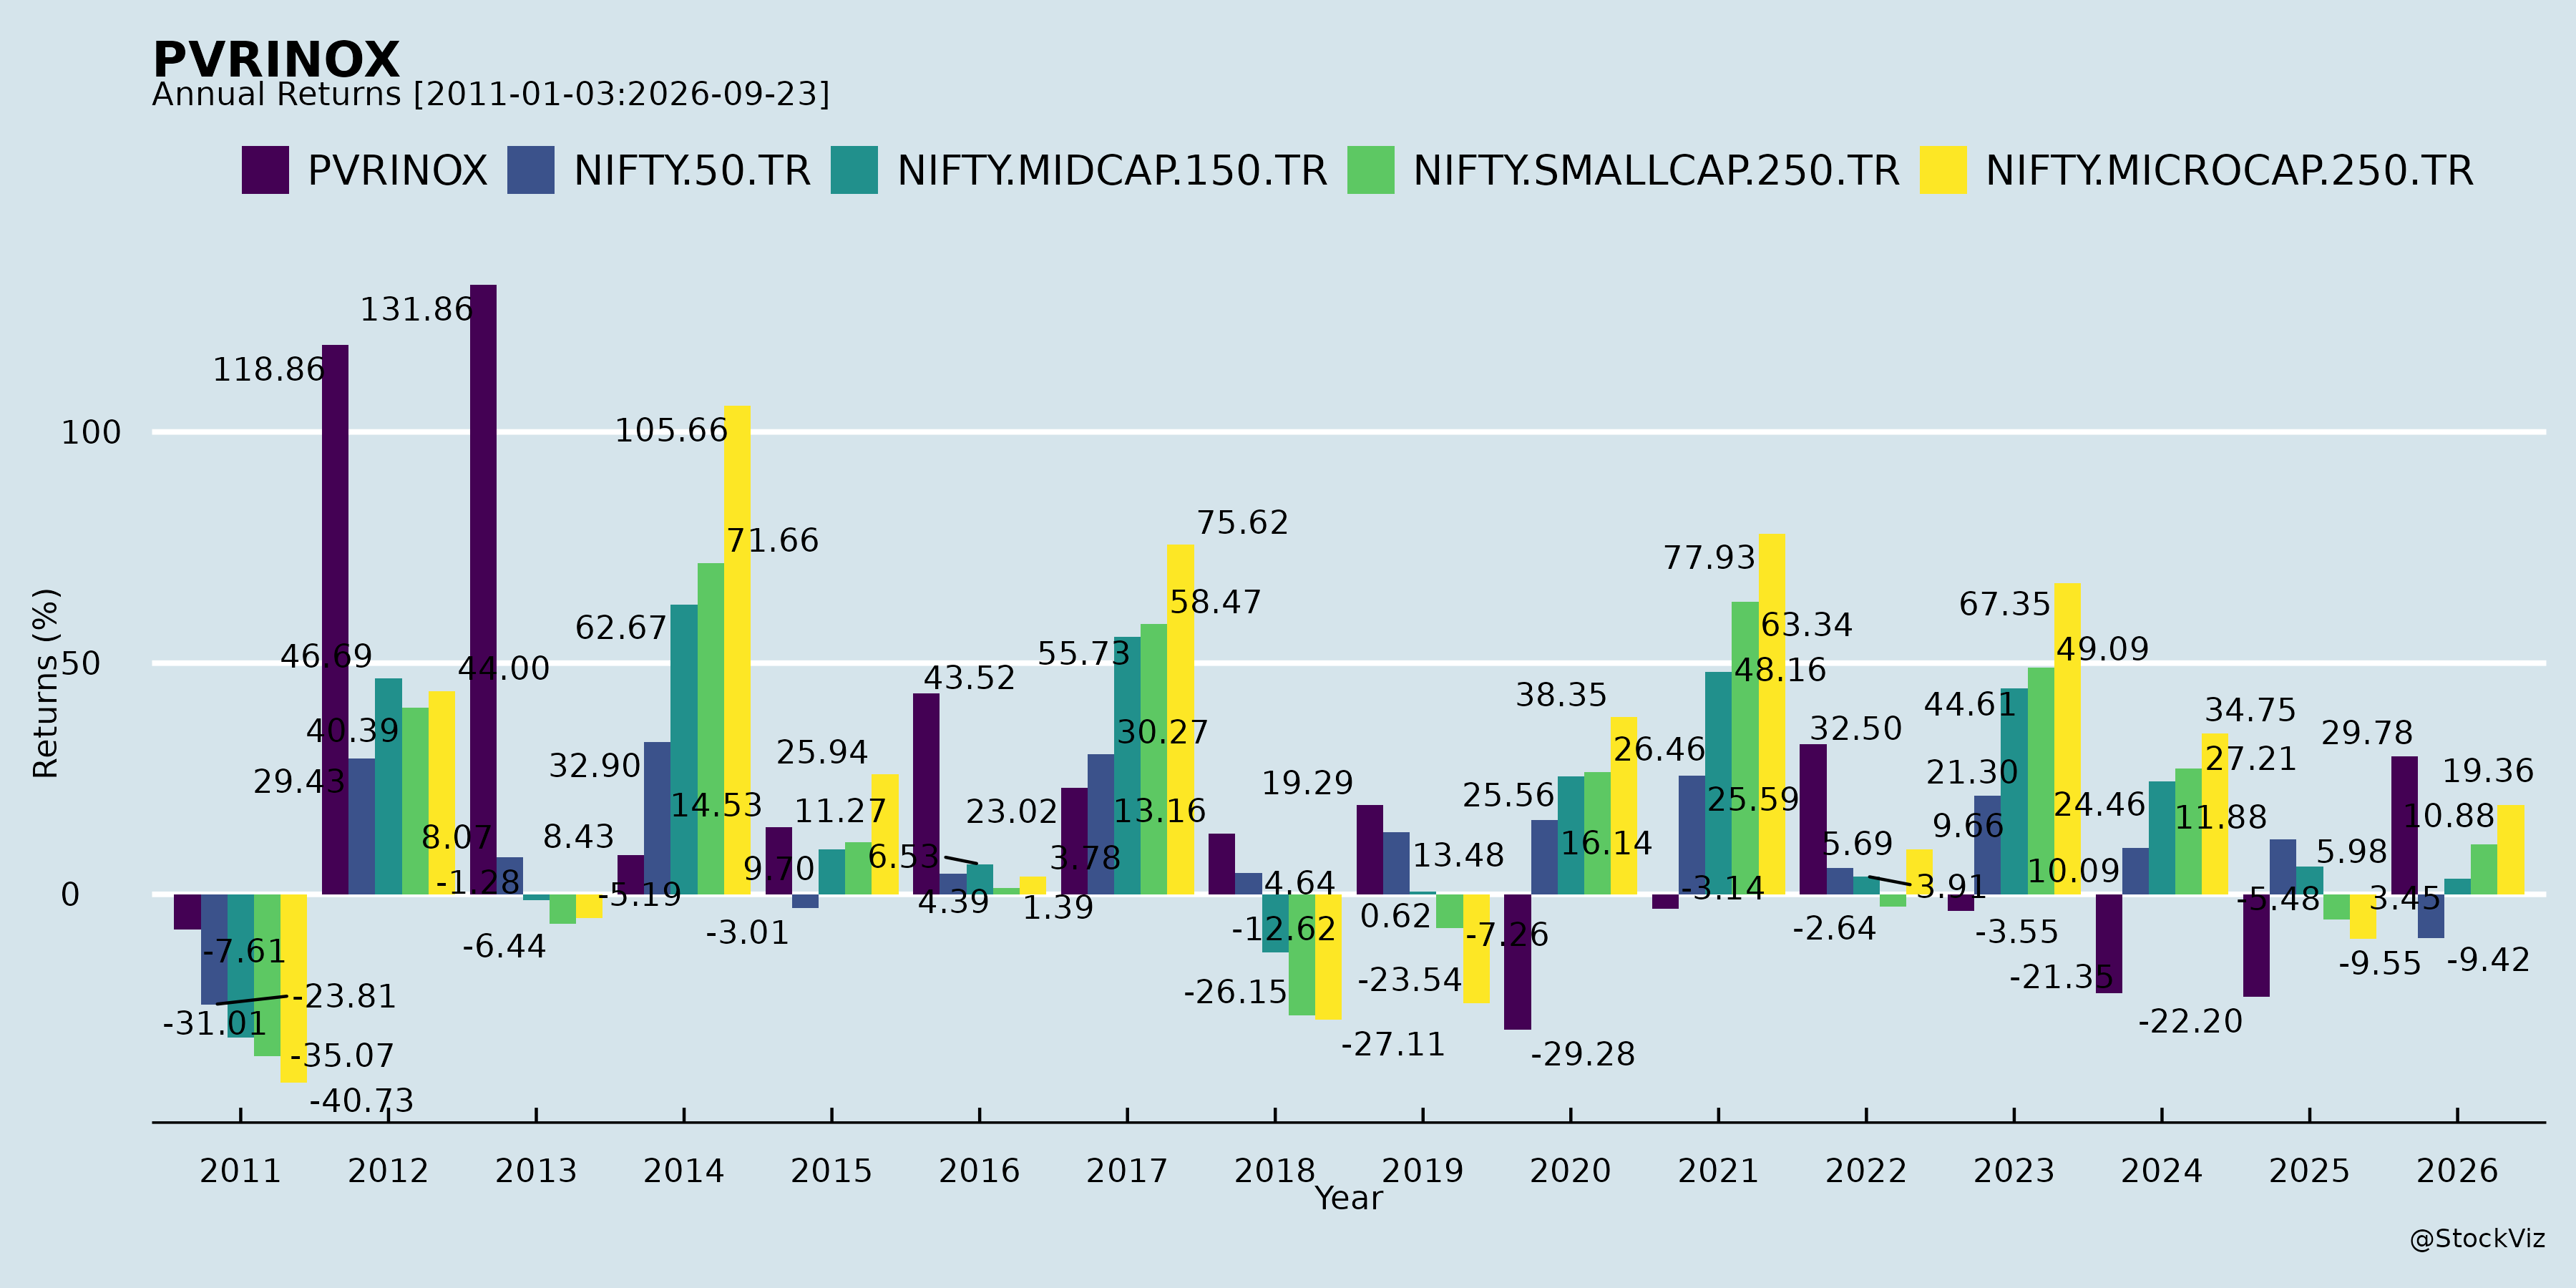
Annual Returns
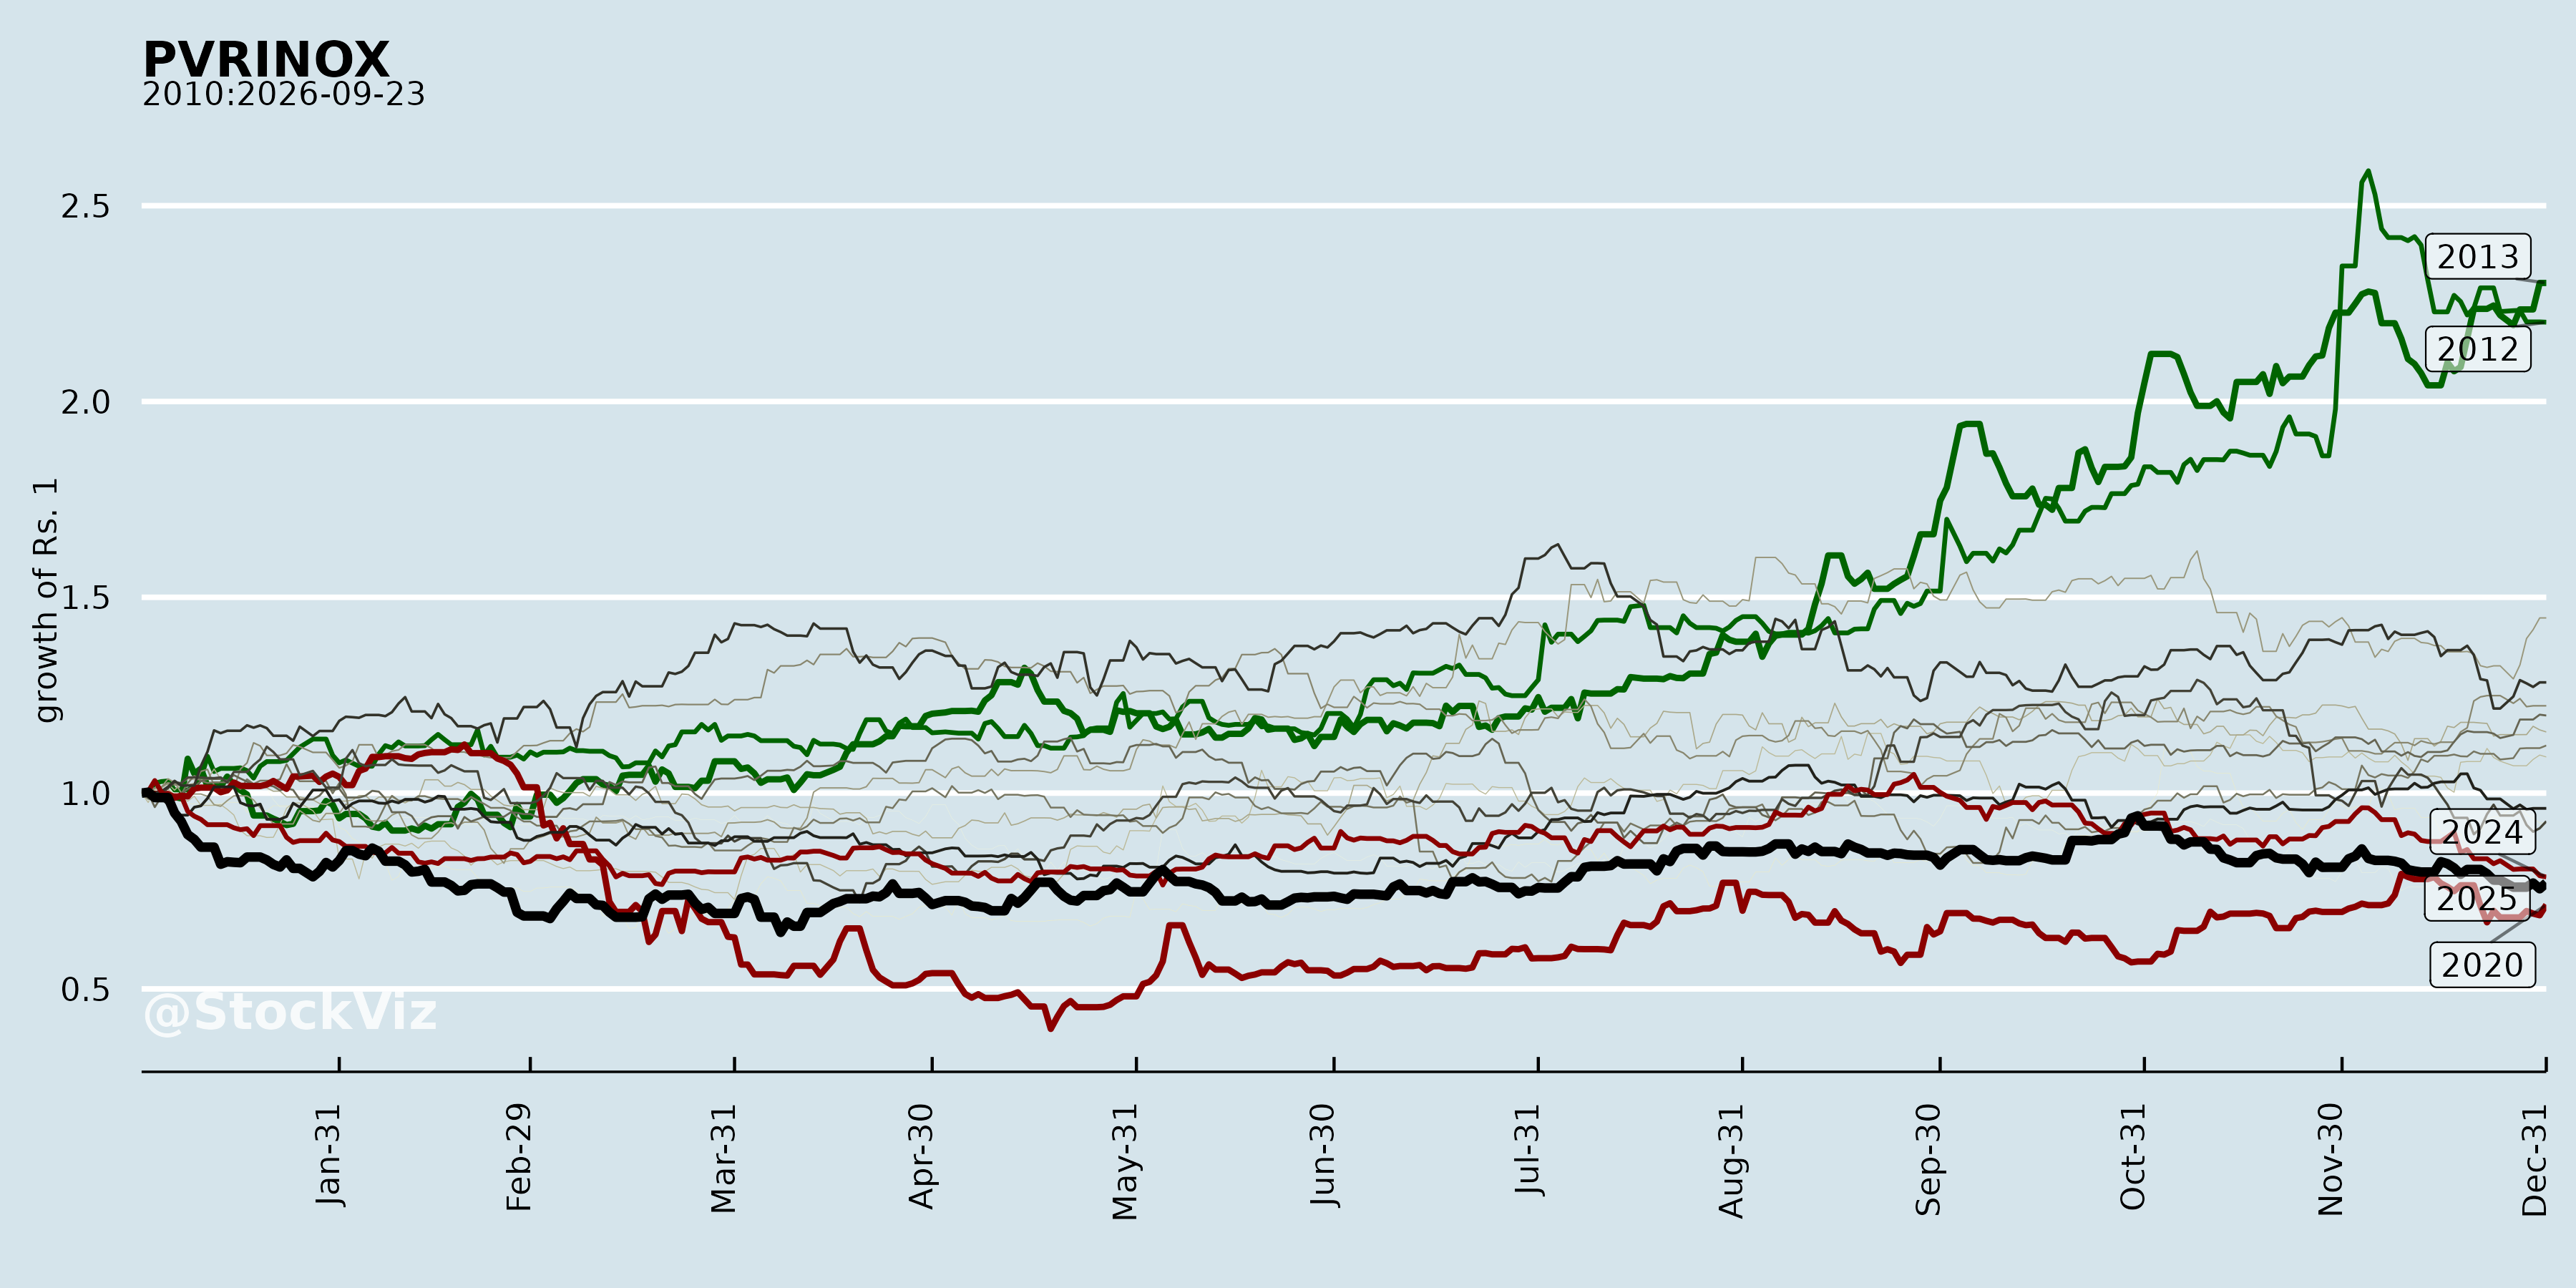
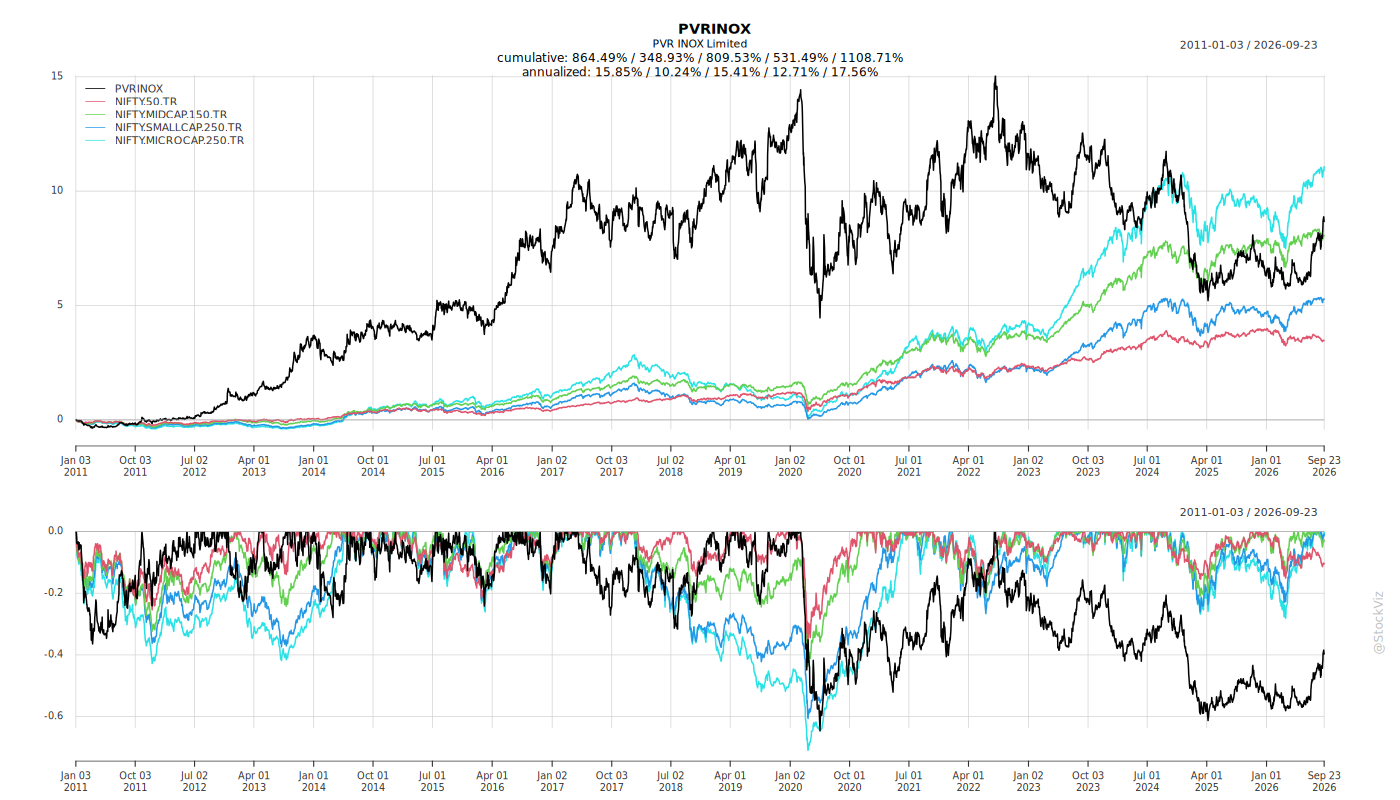
Cumulative Returns and Drawdowns
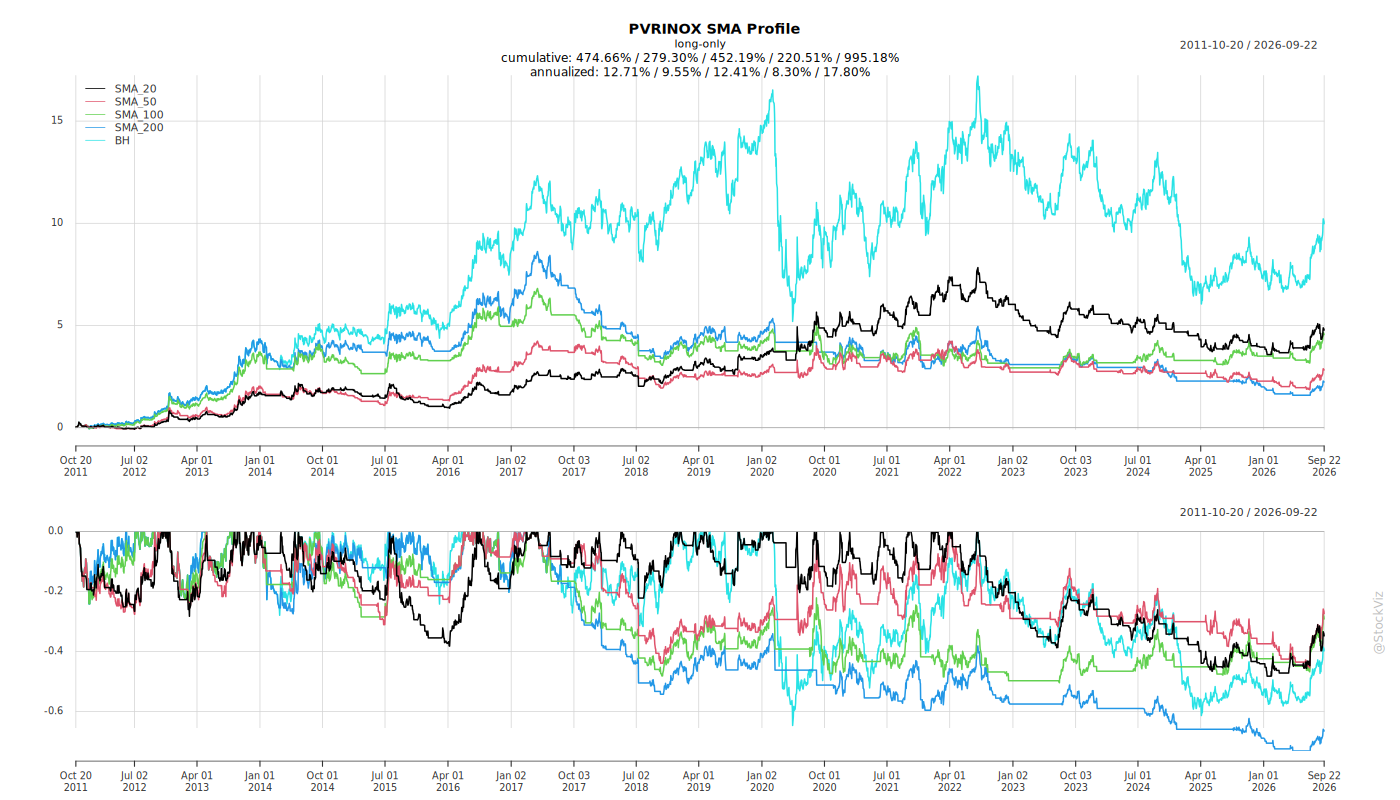
Fundamentals
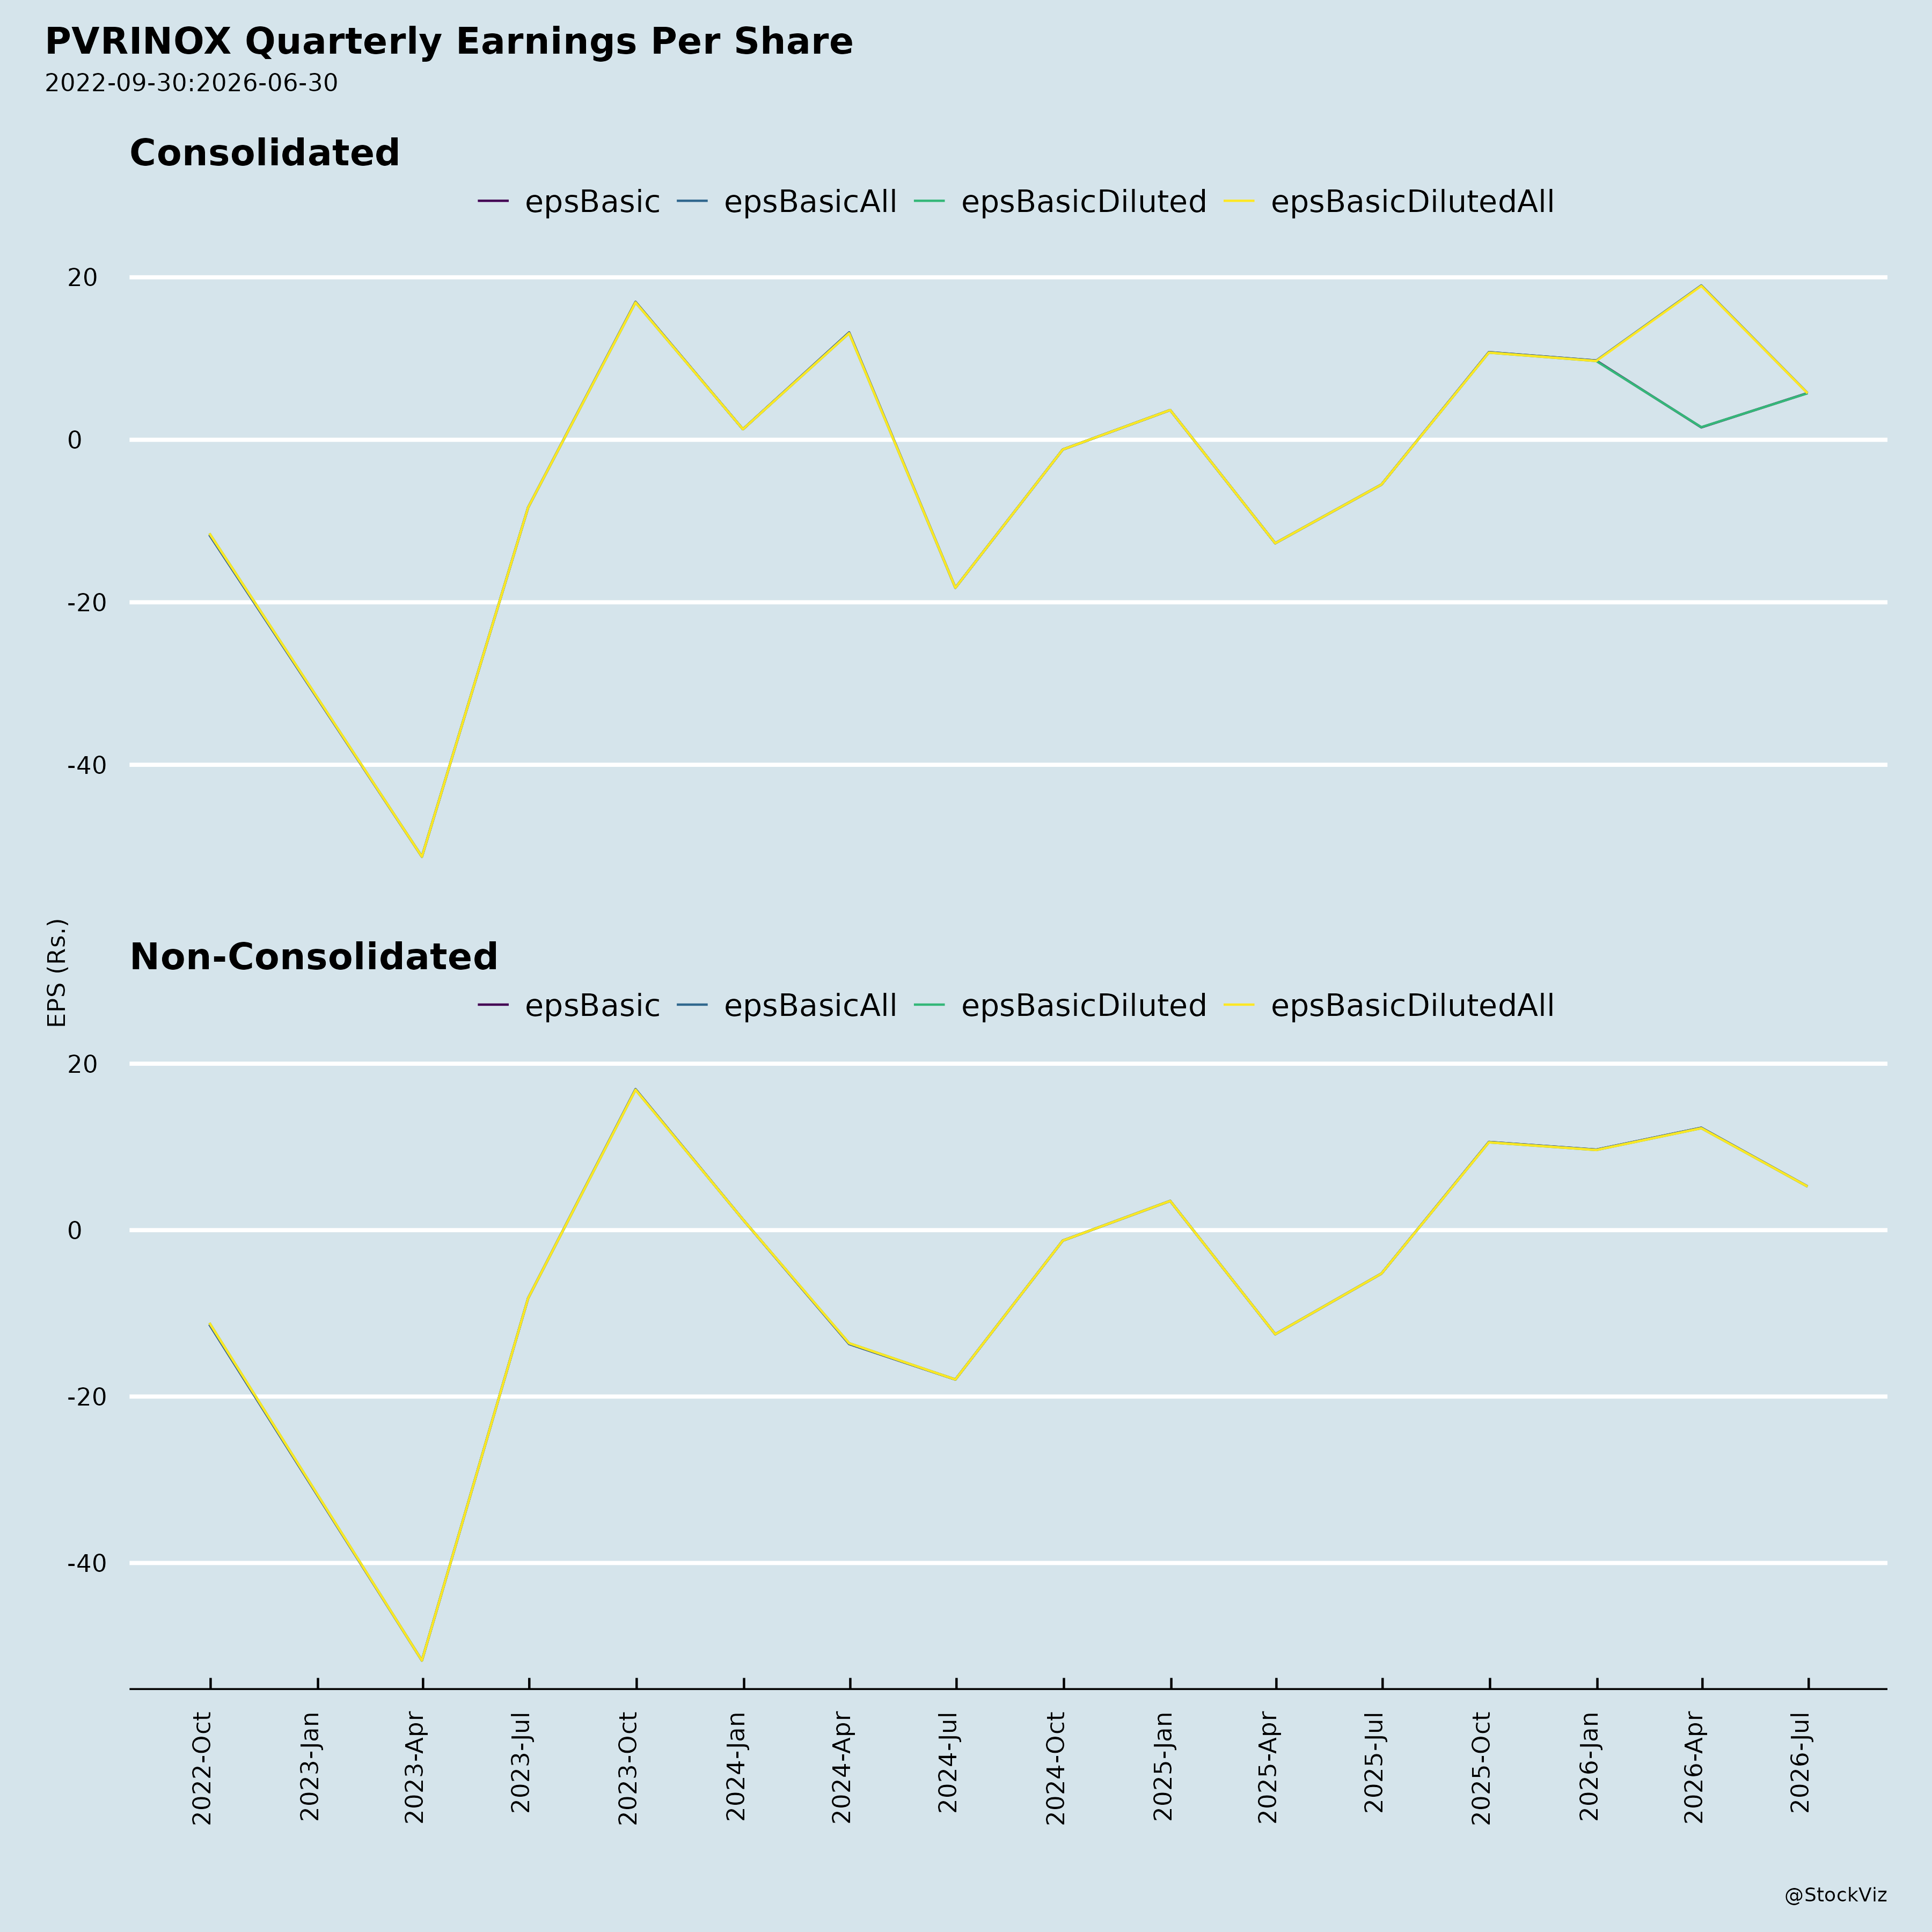
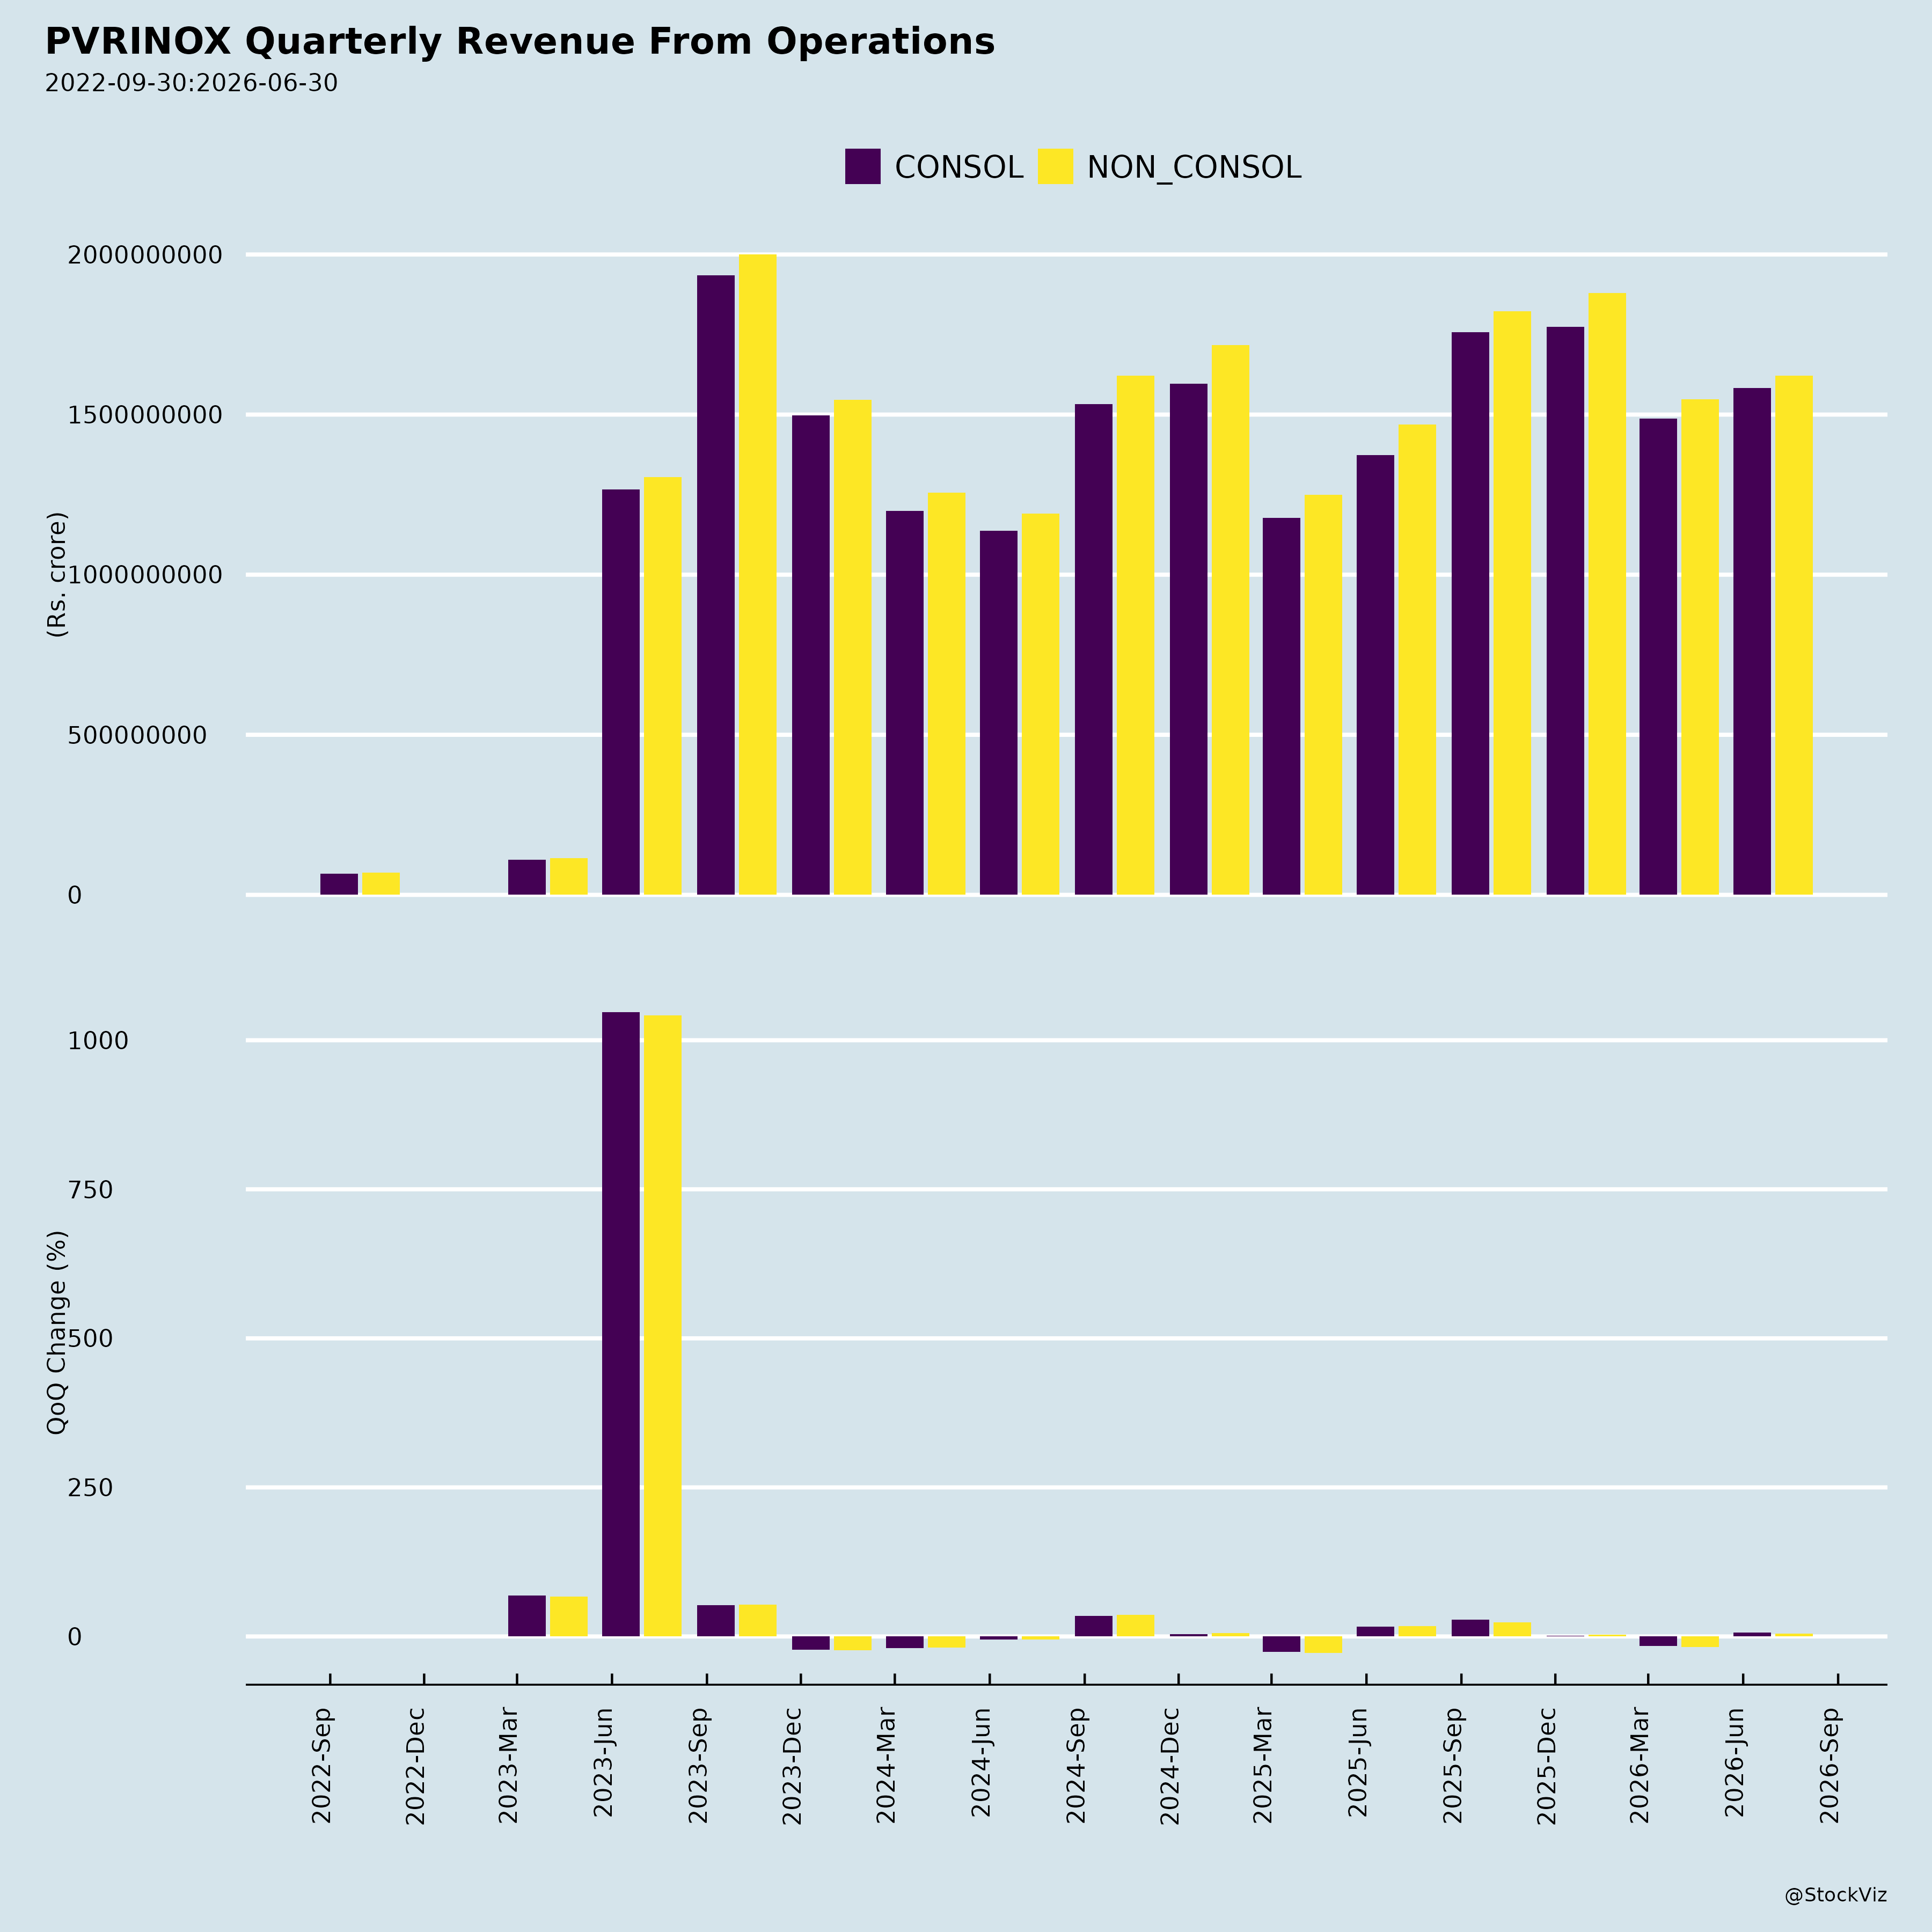
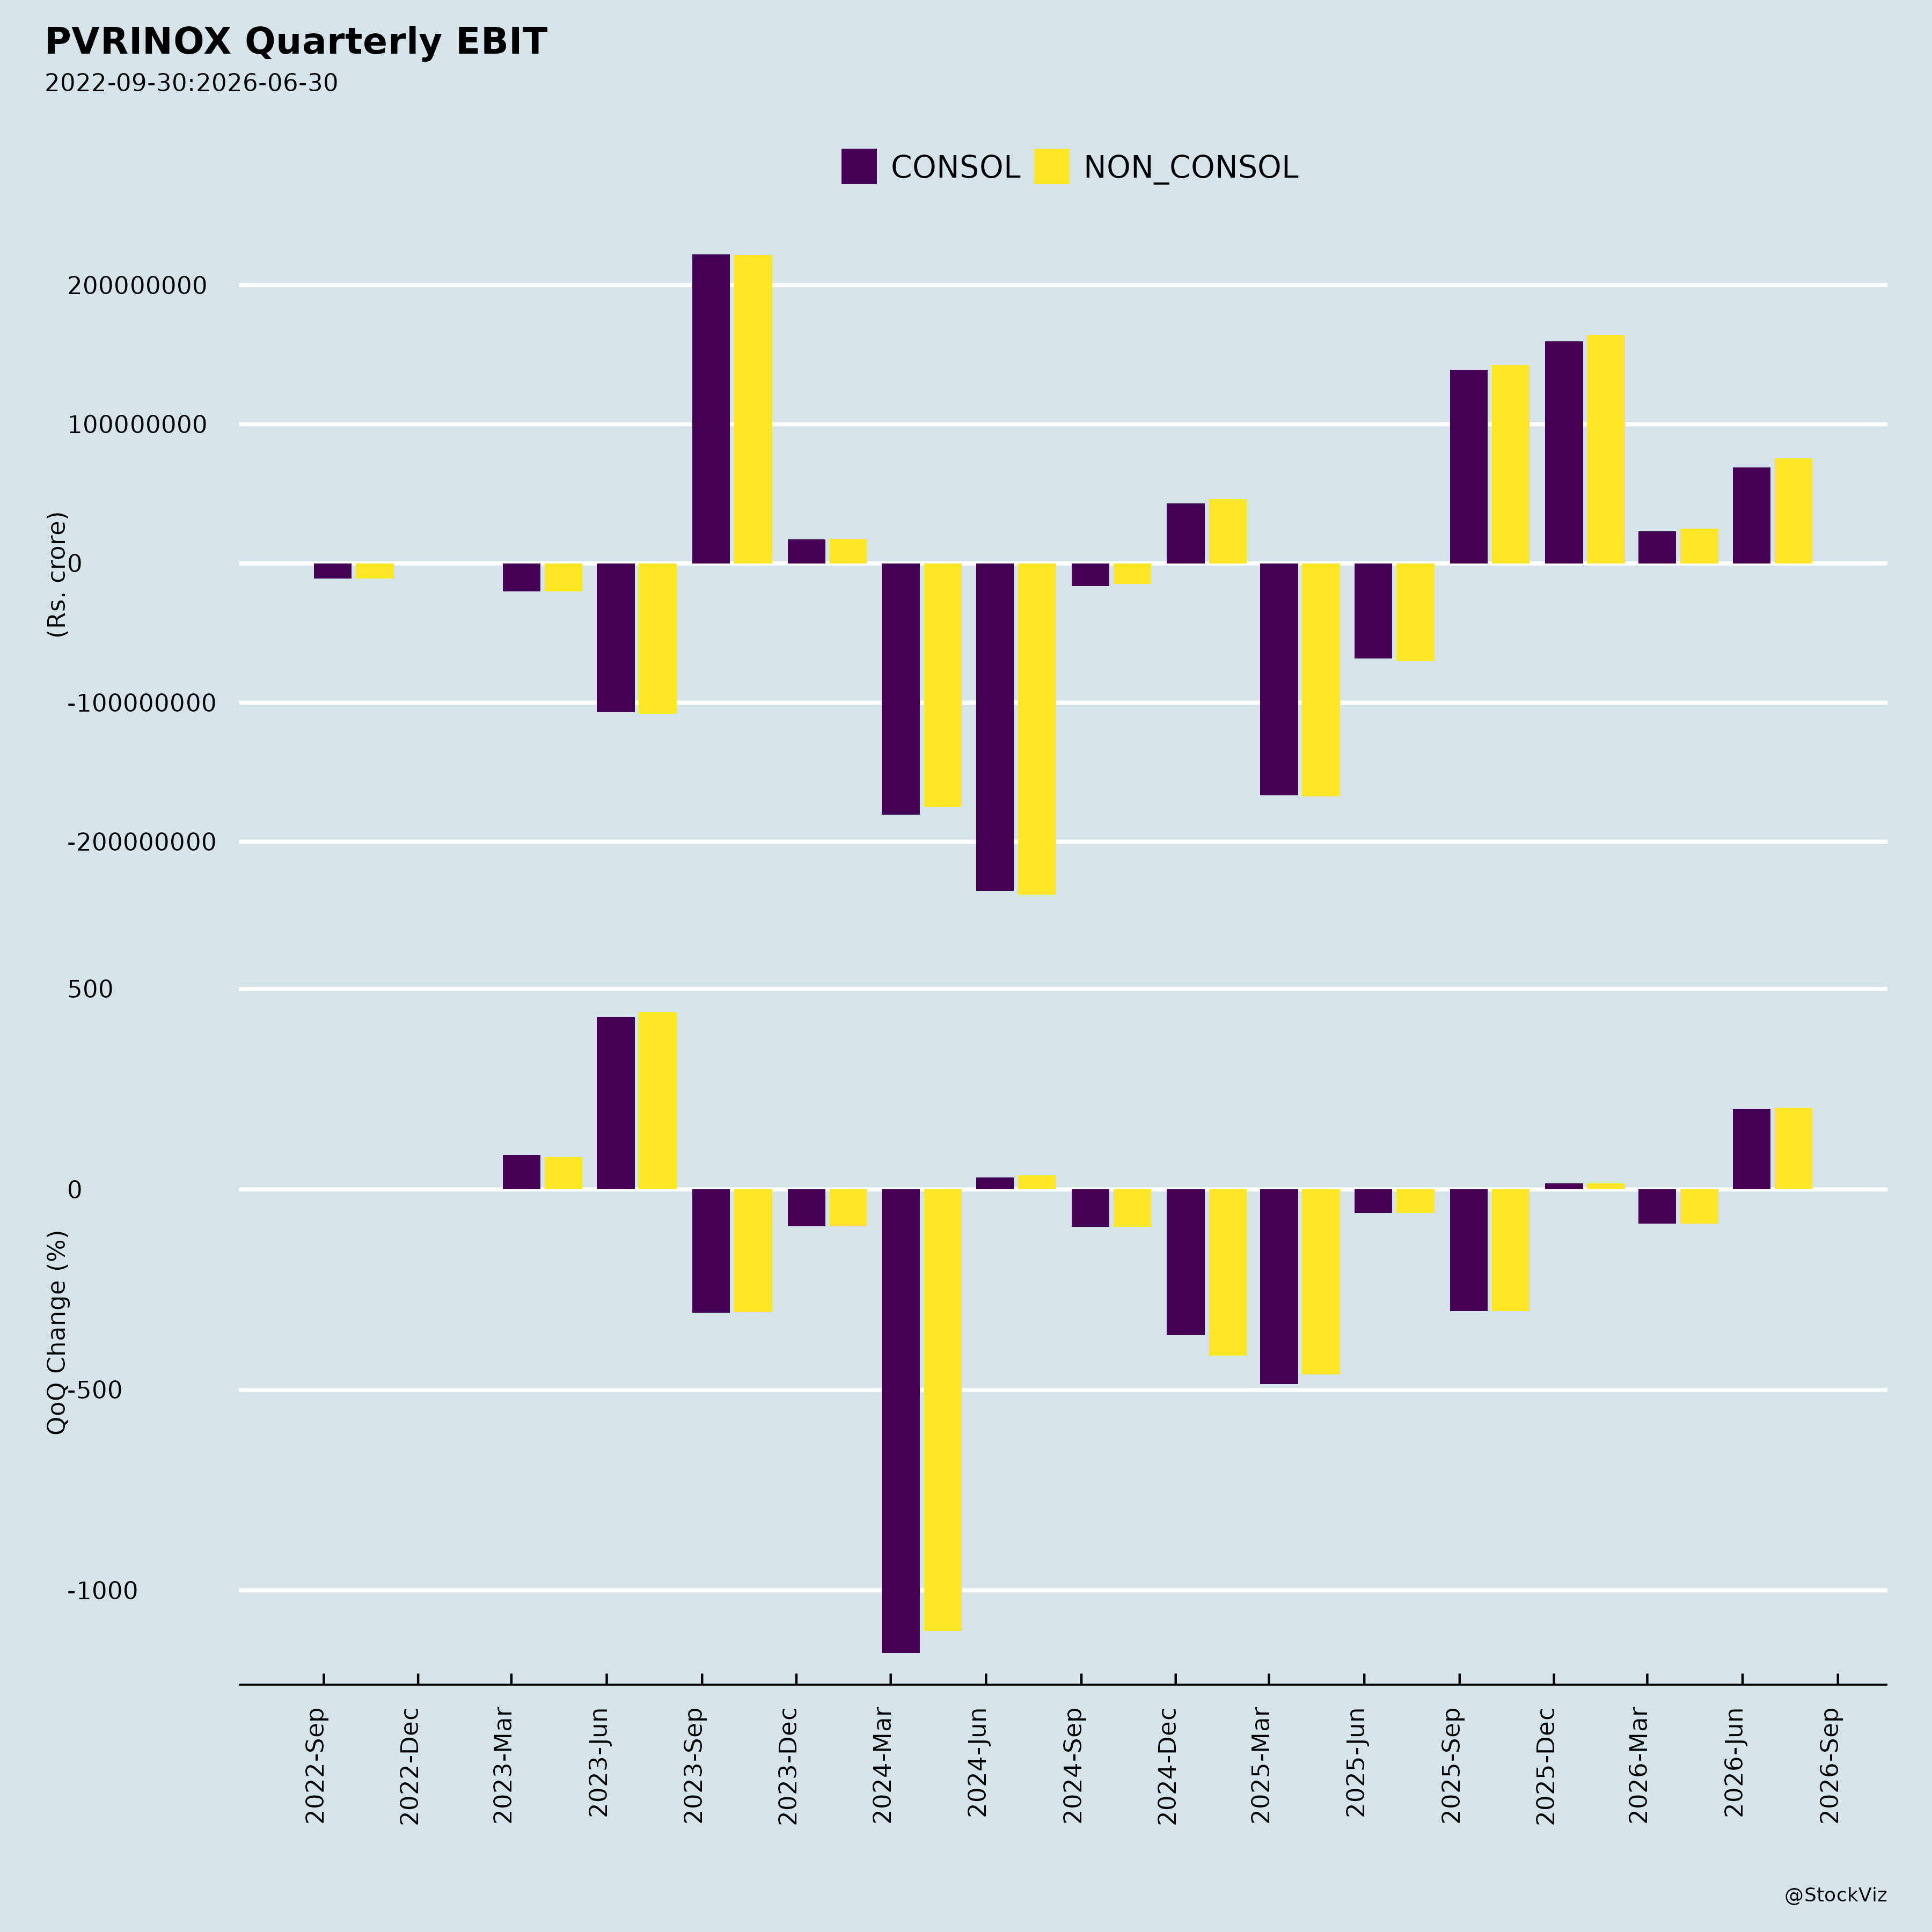
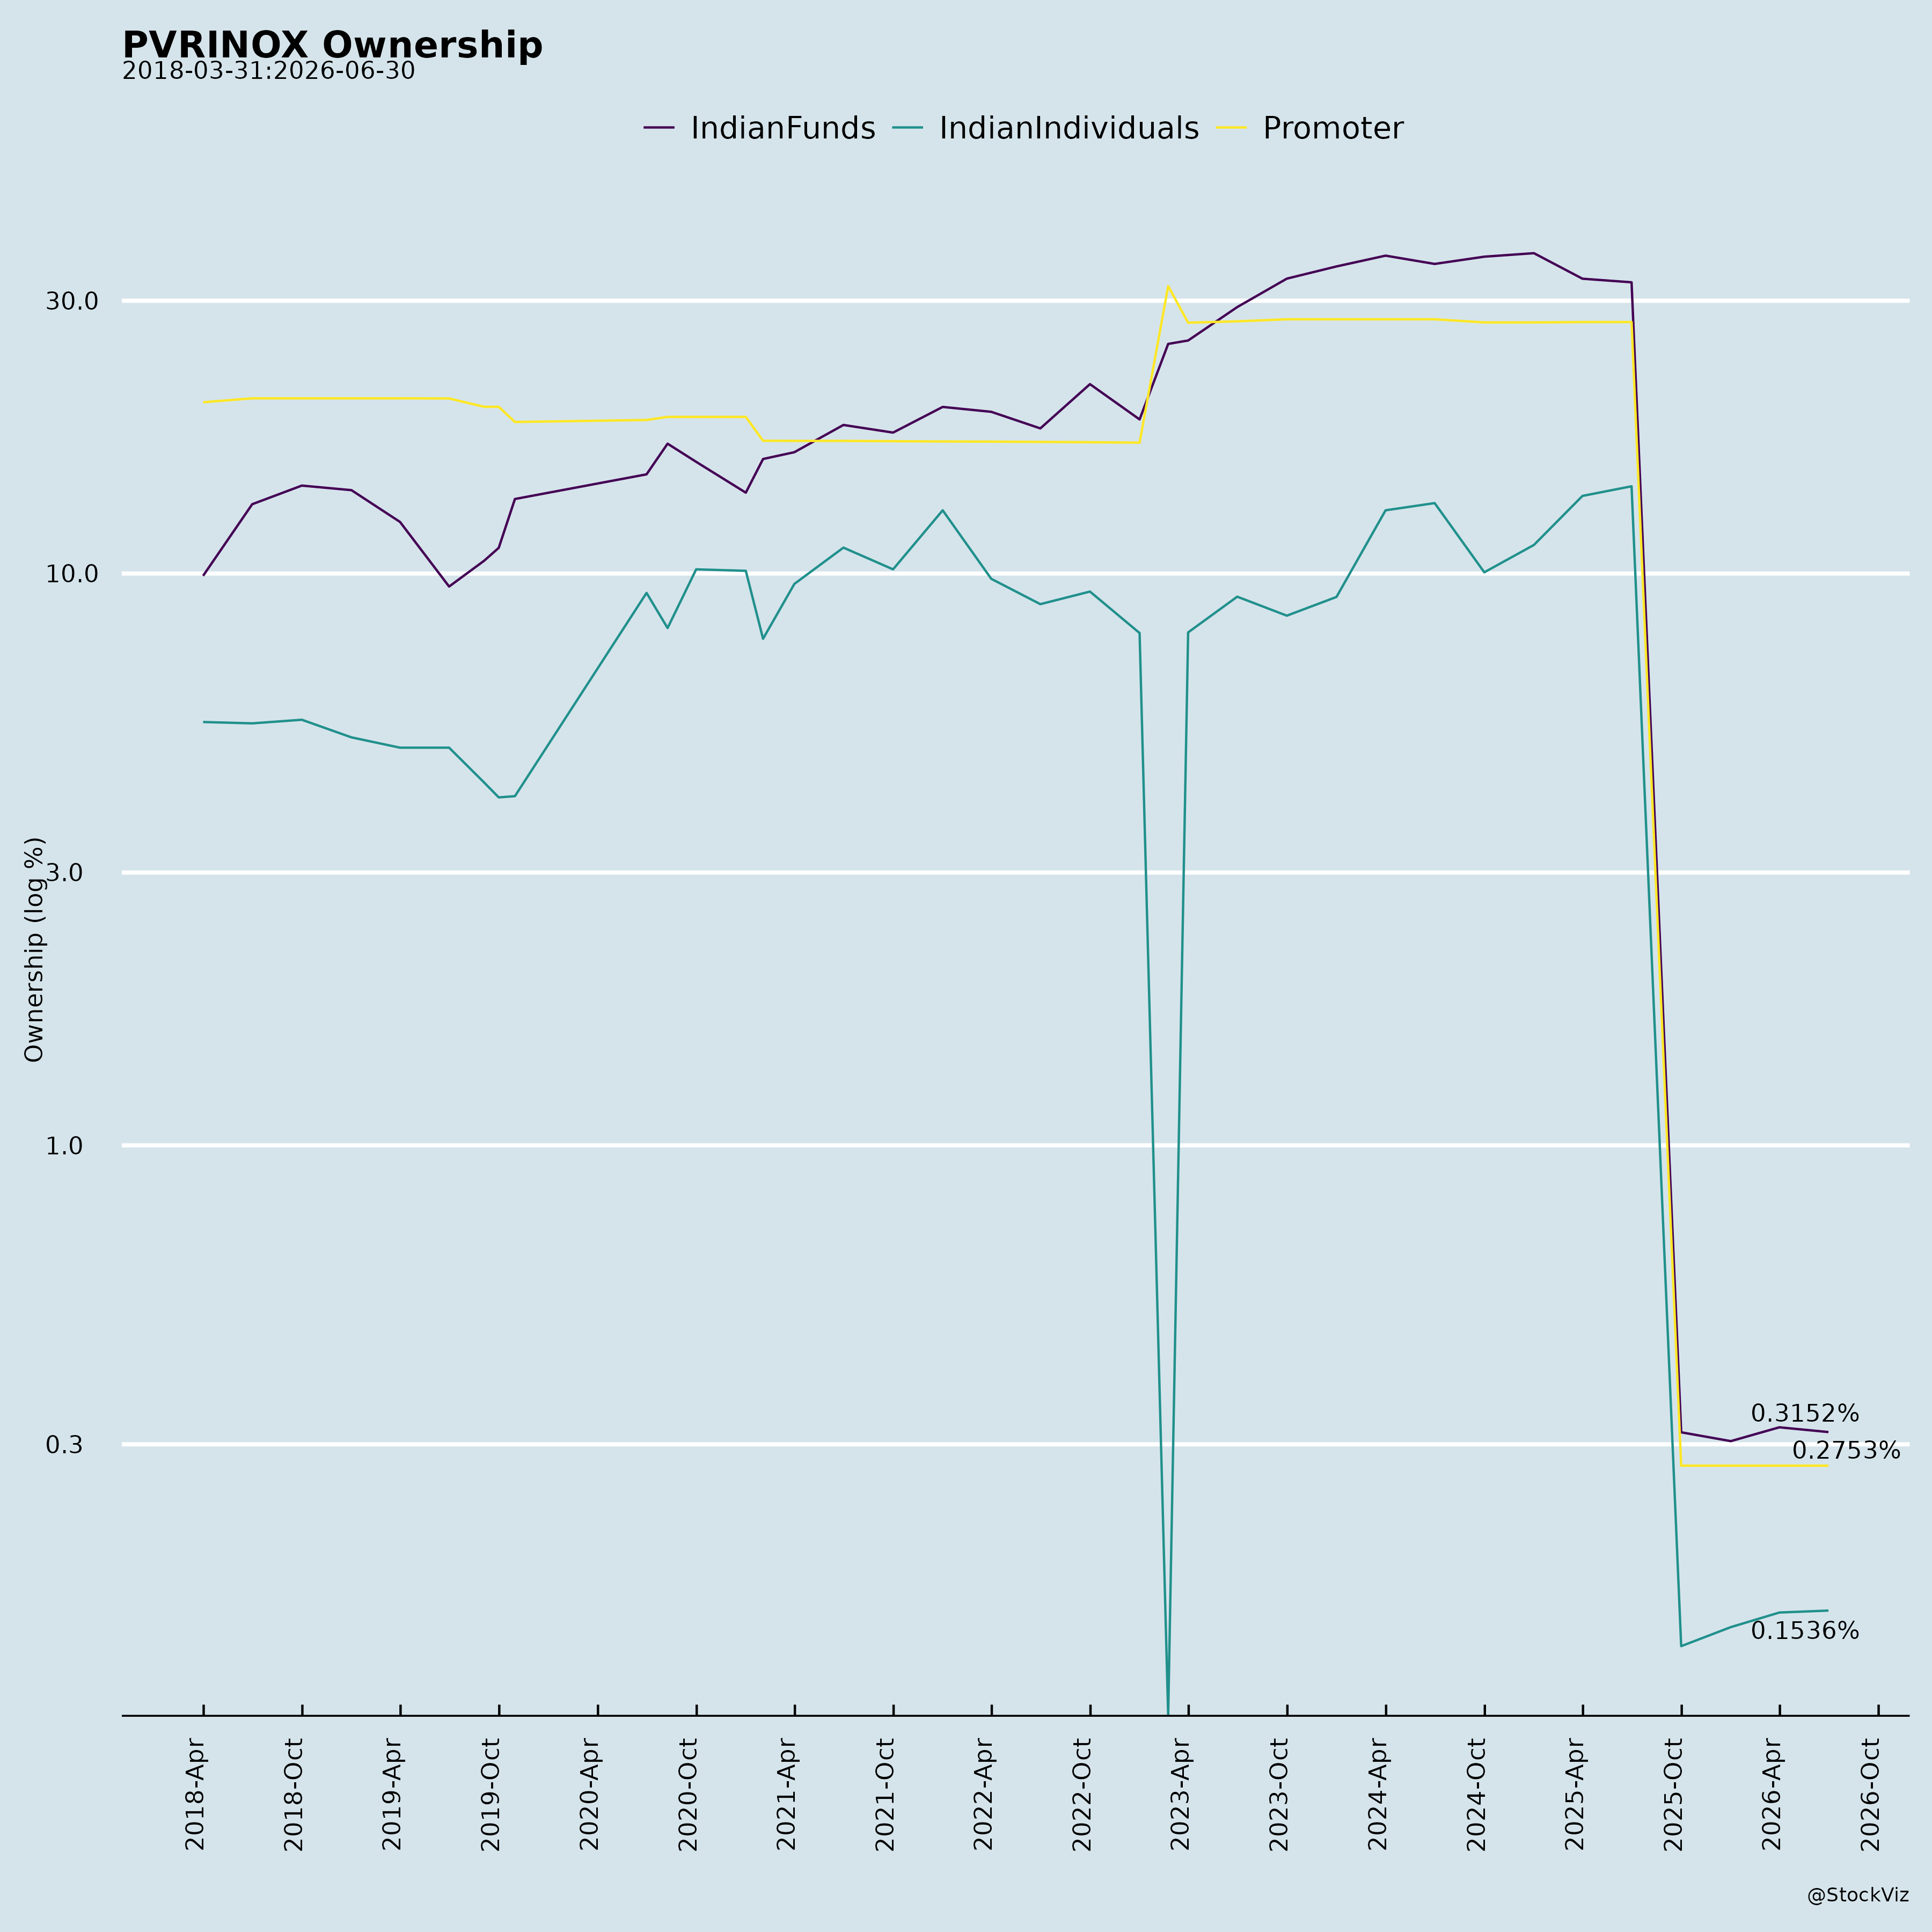
Ownership
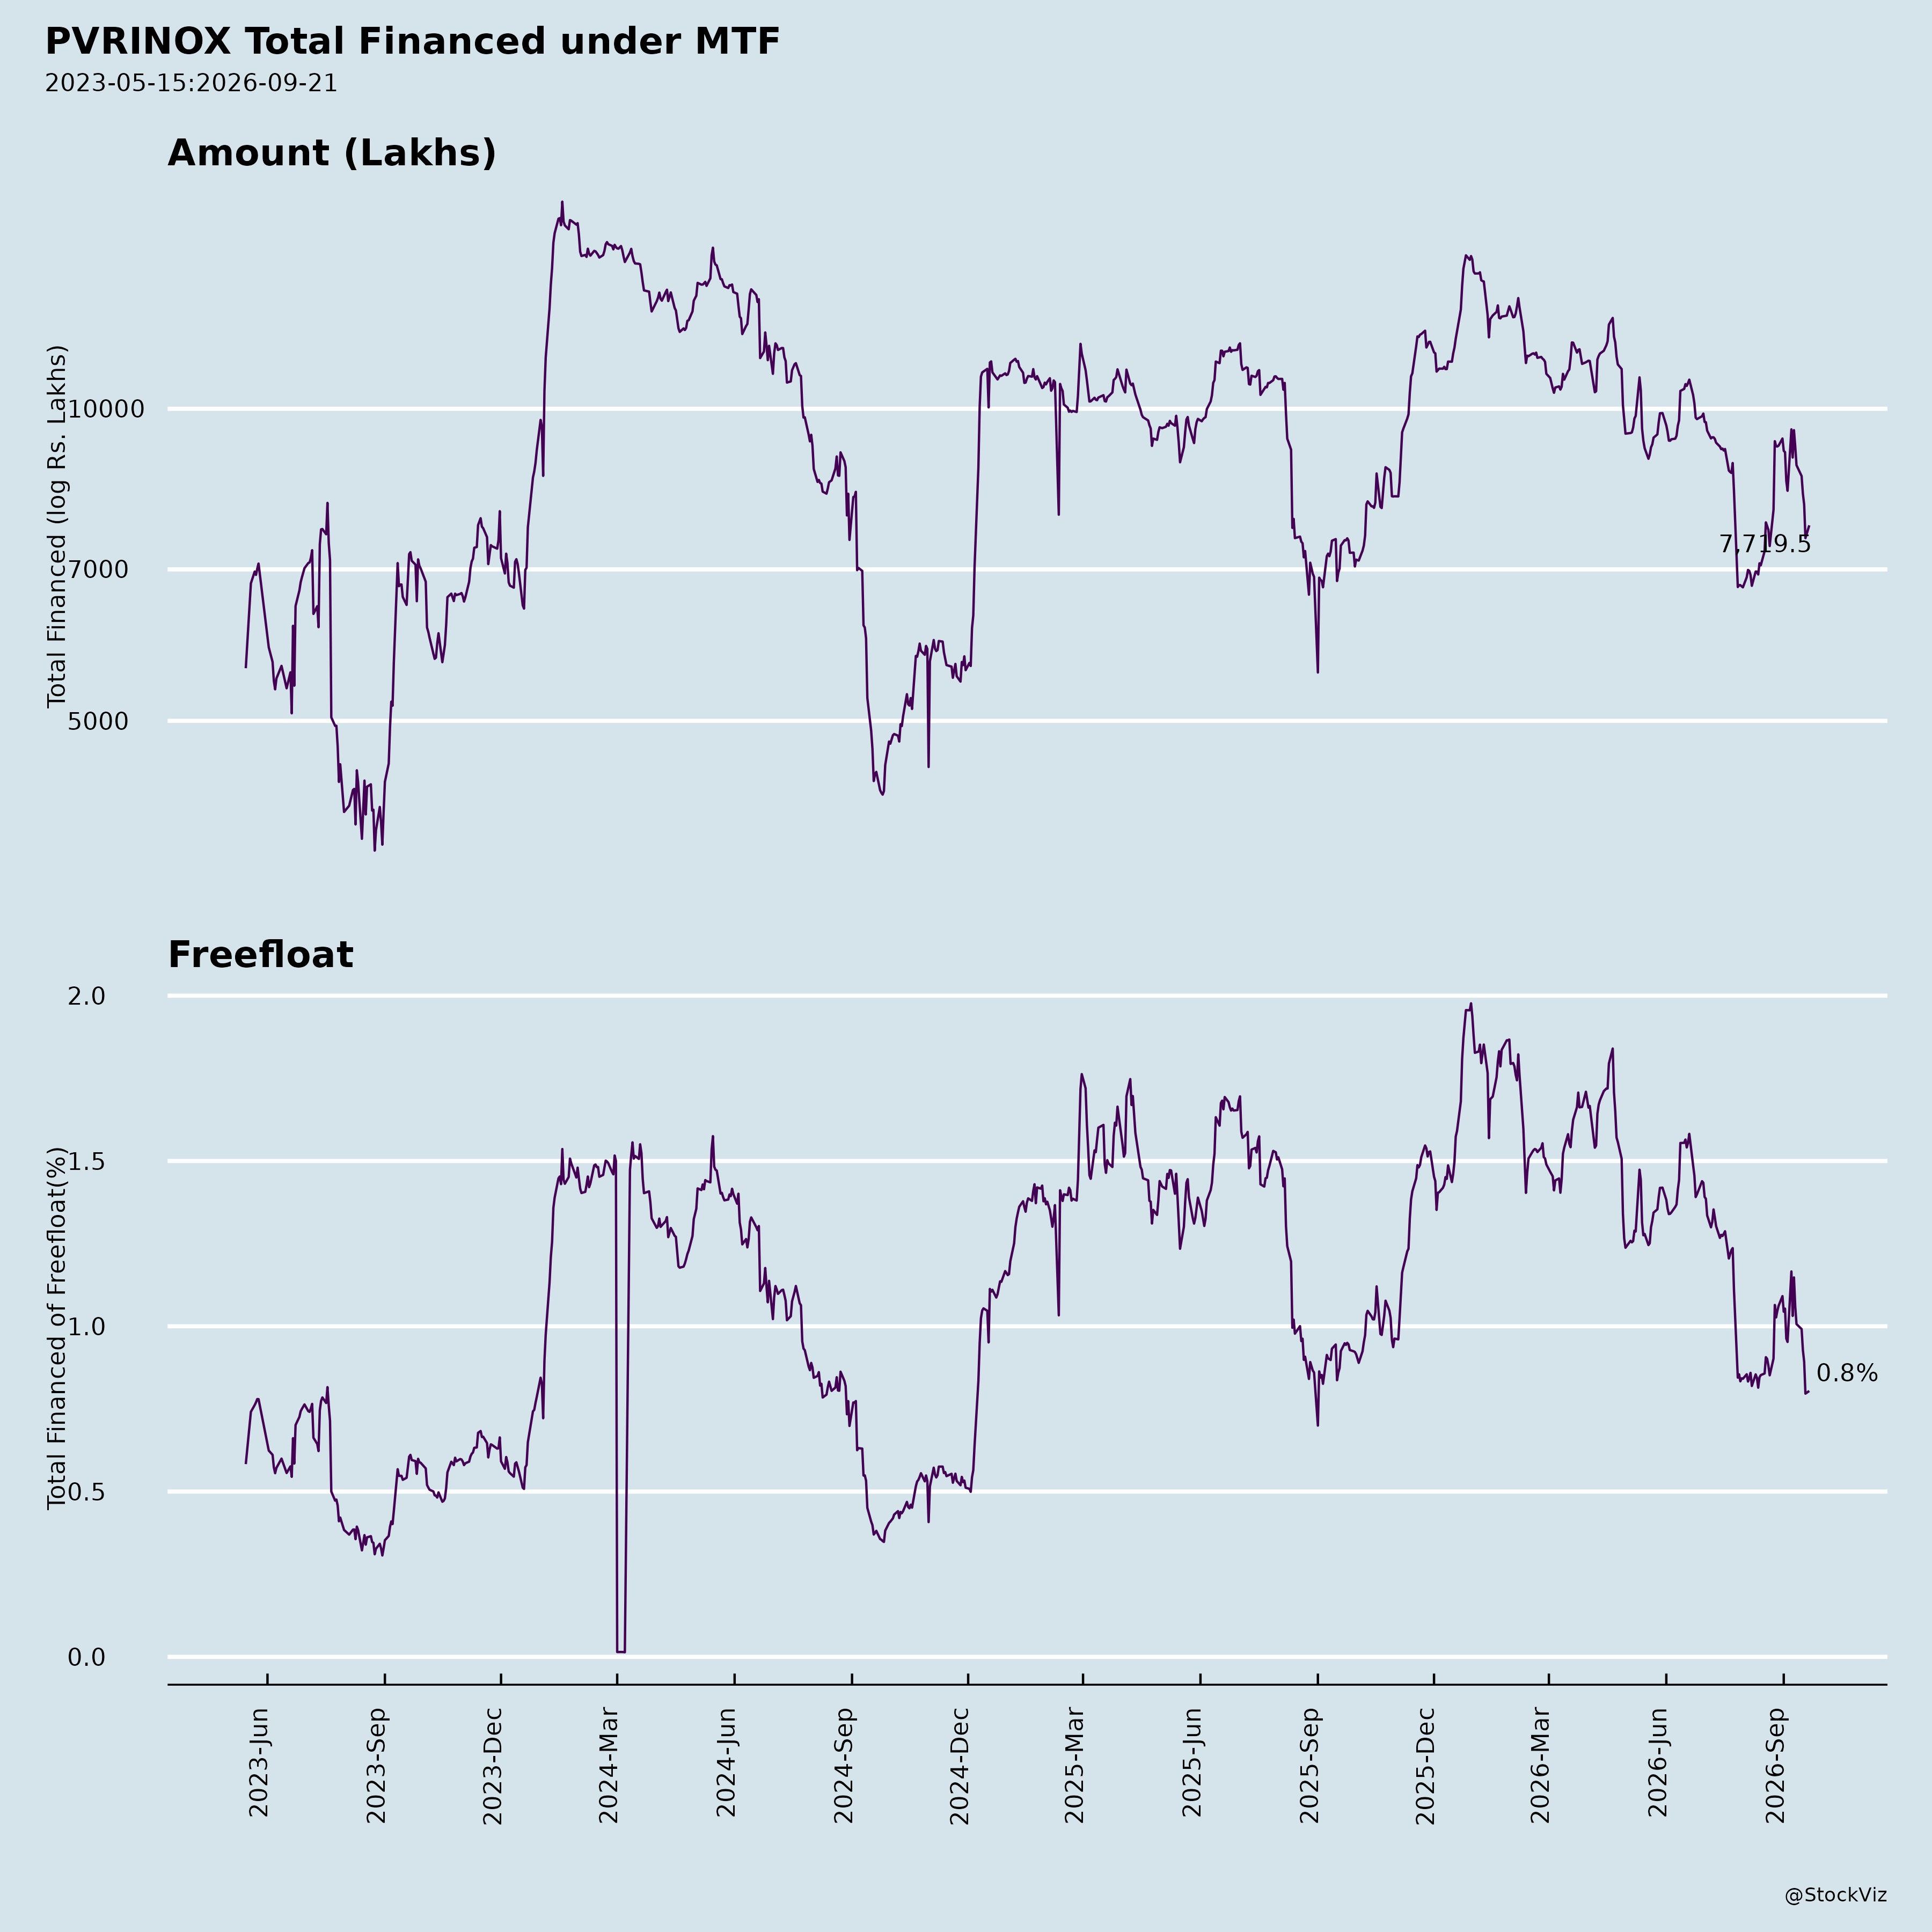
Margined
AI Summary
asof: 2026-09-17
PVR INOX: Recent Corporate Developments
1. Headwinds and Challenges
The company acknowledges that a multitude of factors — including changes in demand, competition, and technology — can cause actual events, performance, or results to differ significantly from any anticipated development. This general caution frames the environment in which the company is executing its expansion and innovation plans.
2. Tailwinds and Growth Prospects
PVR INOX operates the largest multiplex network with 1,789 screens at 356 properties across 114 cities in India and Sri Lanka. The company continues to focus on strengthening its presence in high-growth urban catchments, investing in continuous innovation, next-generation formats, and immersive experiences.
Recent expansion illustrates this strategy. PVR INOX added three new auditoriums at Soul Space Spirit, Bellandur, Bengaluru, comprising one 4DX screen (Bengaluru’s eighth) and two mainstream screens, bringing the property’s total to seven screens with a seating capacity of 1,143. The expanded property features a dedicated fifth-floor entrance, superior laser projection, Dolby Atmos Surround Sound, and Next Gen 3D.
Management remains focused on creating cinema destinations closer to where people live and work, and on continuing to evolve established properties in line with changing audience expectations.
Growth momentum is also reflected in screen additions: the company is on track to open 90–100 new screens in FY27, driven by strong content and audience engagement across regional and English languages. It also achieved a net cash positive milestone of -807 INR Mn as of 30 Jun’26.
3. Key Risks
The principal risk articulated is that changes in demand, competition, and technology may cause actual outcomes to diverge materially from anticipated developments. No further specific risks are detailed in the supplied material.
4. Management Guidance vs. Observed Performance
Guidance: Management stated that the company is on track to open 90–100 new screens in FY27.
Observed performance: In Q1 FY27, total income reached INR 16,423 Mn (12% YoY growth), EBITDA reached INR 2,296 Mn (90% YoY growth), and PAT reached INR 705 Mn. The company also reported a net cash positive milestone of -807 INR Mn as of 30 Jun’26. The Bellandur expansion (three new auditoriums) represents tangible progress against the screen-opening guidance.
Other Key Developments
- Buyback: PVR INOX proposed a buyback of up to 20,68,965 equity shares at INR 1,450 per share, for an aggregate amount not exceeding INR 300 crores, representing 2.11% of total paid-up equity share capital. The record date for eligible shareholders is Friday, 4th September 2026.
- AGM: All eight resolutions set out in the AGM notice of the 31st Annual General Meeting, held on September 11, 2026, were duly passed with the requisite majority, including adoption of financial statements, re-appointment and appointment of directors, and approval of remuneration for independent directors.
- Investor engagement: Company representatives participated in the Ashwamedh Elara India Dialogue 2026, organized by Elara Capital, on 2nd September 2026 at 11:00 AM (IST) in Mumbai, involving one-to-one and group meetings where no unpublished price sensitive information was shared.
Broker Narrative
The narrative shifted from a cautious Neutral in May 2023—focused on weak occupancy, content underperformance, OTT competition, elevated opex, rising net debt, slow ad recovery, and screen closures—to a Buy in July 2026—focused on best 1Q operating performance in four years, positive net cash, ATP/SPH premiumization, footfall growth, asset-light/FOCO expansion, and event-based monetization. Persistent themes were content-dependent footfall volatility, cost sensitivity, and the need for alternate revenue streams. What changed was the balance-sheet and operating trajectory: early fears of debt and margin collapse gave way to margin/cash-flow recovery and a more capital-efficient screen growth model.
Fears that came true
- Lower Occupancy Rates: Occupancy weakness persisted after 4QFY23, and the 2023-2024 slate of negative actual returns and repeated DISAPPOINTMENT calls confirm footfalls and profitability stayed under pressure.
- Underperformance of Bollywood Content: Lackluster Hindi releases in early 2023 proved a recurring drag, with many 2023-2024 Buy calls ending in DISAPPOINTMENT as content-dependent footfalls disappointed.
- Weak Hollywood Dry Patch: The absence of big Hollywood releases flagged in the first report contributed to weak theater traction and negative outcomes in 2023.
- Competition from OTT Platforms: The escalating OTT threat remained an overhang as theatrical footfalls failed to recover enough to meet bullish estimates in 2023-2024.
- Elevated Operating Expenses: The 39% QoQ opex jump and 85% YoY pre-Ind-AS EBITDA decline signaled cost pressure that contributed to DISAPPOINTMENT outcomes as profitability lagged.
- Increase in Net Debt: Net debt rising to INR14.3b in FY23 from INR9.3b in FY22 reflected balance-sheet strain that weighed on returns through subsequent negative actuals.
- Slow Recovery in Advertising Revenues: Ad revenue failing to recover quickly to pre-Covid levels was a persistent drag, undermining FY24 margin optimism and contributing to DISAPPOINTMENT calls.
- Screen Closures: The plan to shut ~50 underperforming screens signaled weak productivity in parts of the circuit, consistent with the poor returns that followed.
Optimism that failed
- Strong Content Pipeline: Despite big-ticket releases like Fast X, Spider-Man, Transformers, The Flash, Adipurush, Mission Impossible, and Oppenheimer, the 2023-2024 actual returns were often negative and many Buy calls disappointed.
- Operational Synergies: The expected ~INR2.2b merger synergies over 12-24 months did not prevent repeated DISAPPOINTMENT outcomes and weak profitability in FY24.
- Aggressive Screen Expansion: Plans to add 150-175 screens annually with INR6.5-7b capex did not generate the expected footfall or return uplift, as net debt increased and many calls disappointed.
- Cost Rationalization: The ~INR100m EBITDA savings from closing 50 screens proved insufficient to offset elevated opex, given the weak outcomes that followed.
- Recovery in Ad Revenue: Advertising revenue did not return to pre-Covid levels in FY24 as expected, and the slow recovery remained a recurring drag.
- Higher ATP and SPH Metrics: Although ATP and SPH grew in 4QFY23, these gains did not offset lower occupancy and footfalls enough to prevent the negative actual returns and DISAPPOINTMENT calls in 2023-2024.
- FY24 Financial Guidance: Management’s FY24 revenue guidance of INR60-70b and 19-20% EBITDA margin did not materialize, as evidenced by subsequent DISAPPOINTMENT outcomes and negative returns.
Broker Timeline
47 broker calls · 2023-05-16 to 2026-07-27
Copyright © 2023 SAS Data Analytics Pvt. Ltd. All rights reserved.