POLYCAB
Equity Metrics
October 23, 2026
Polycab India Limited
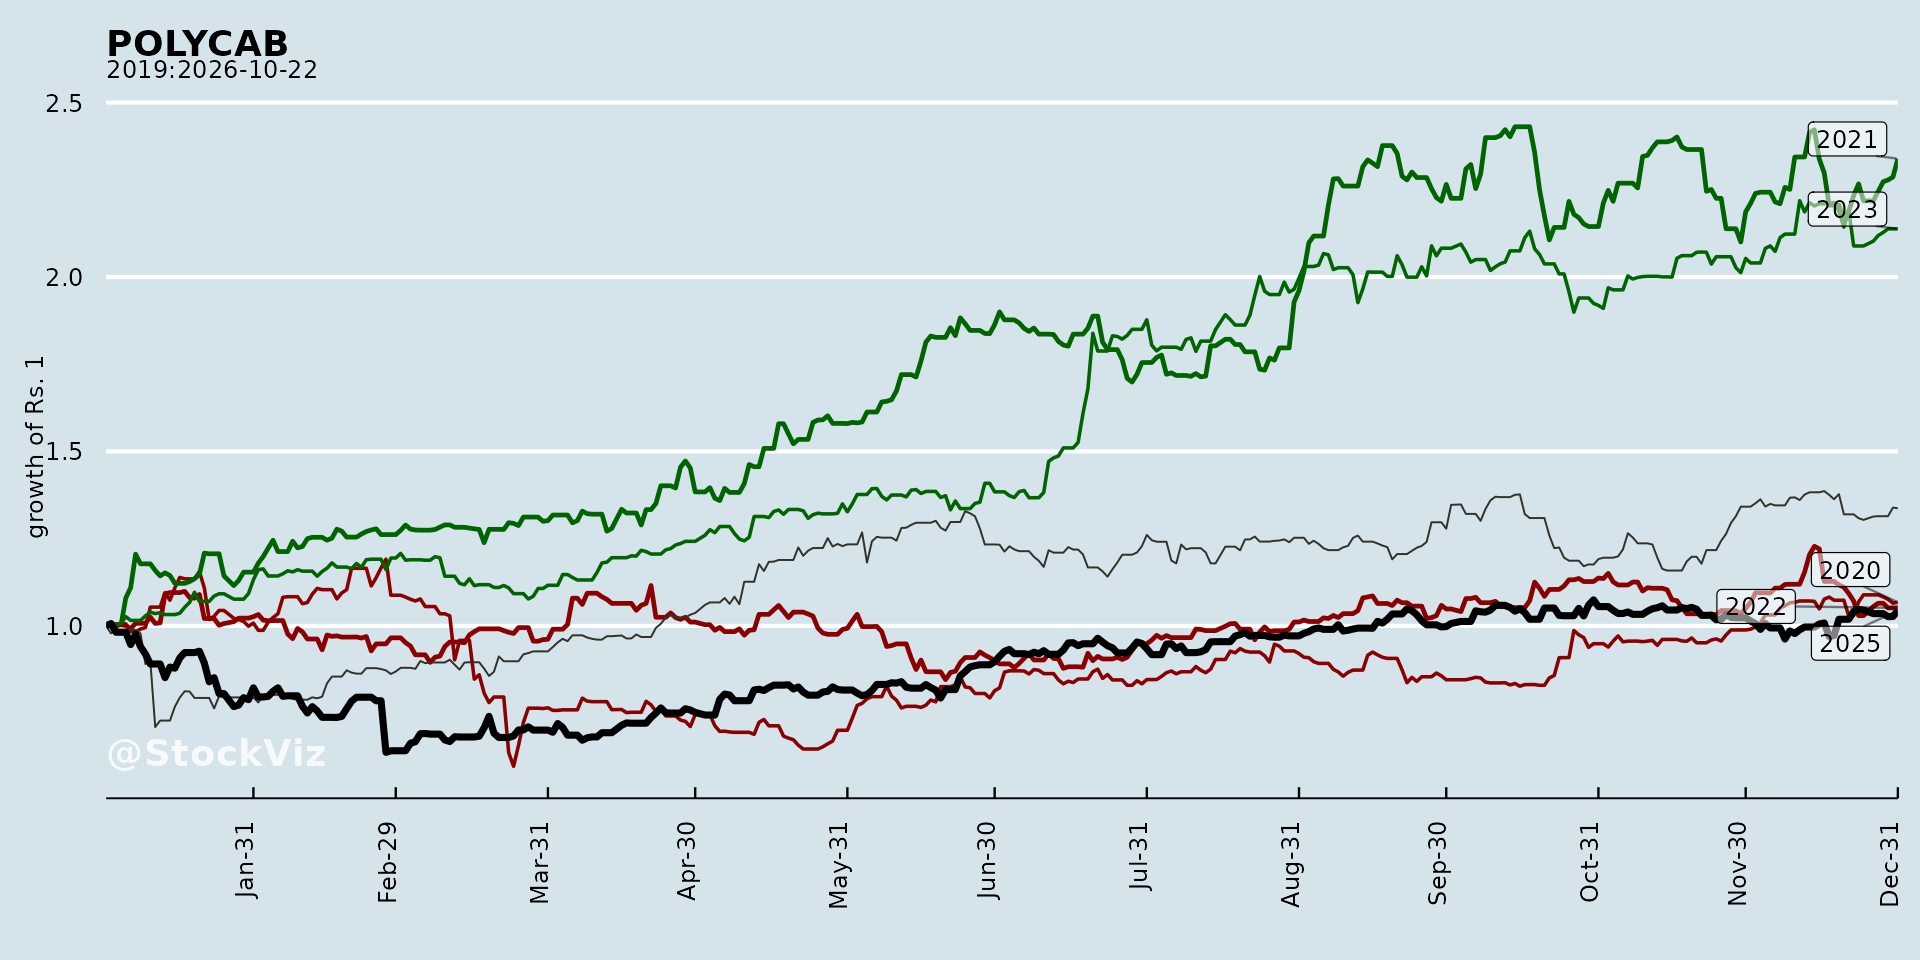
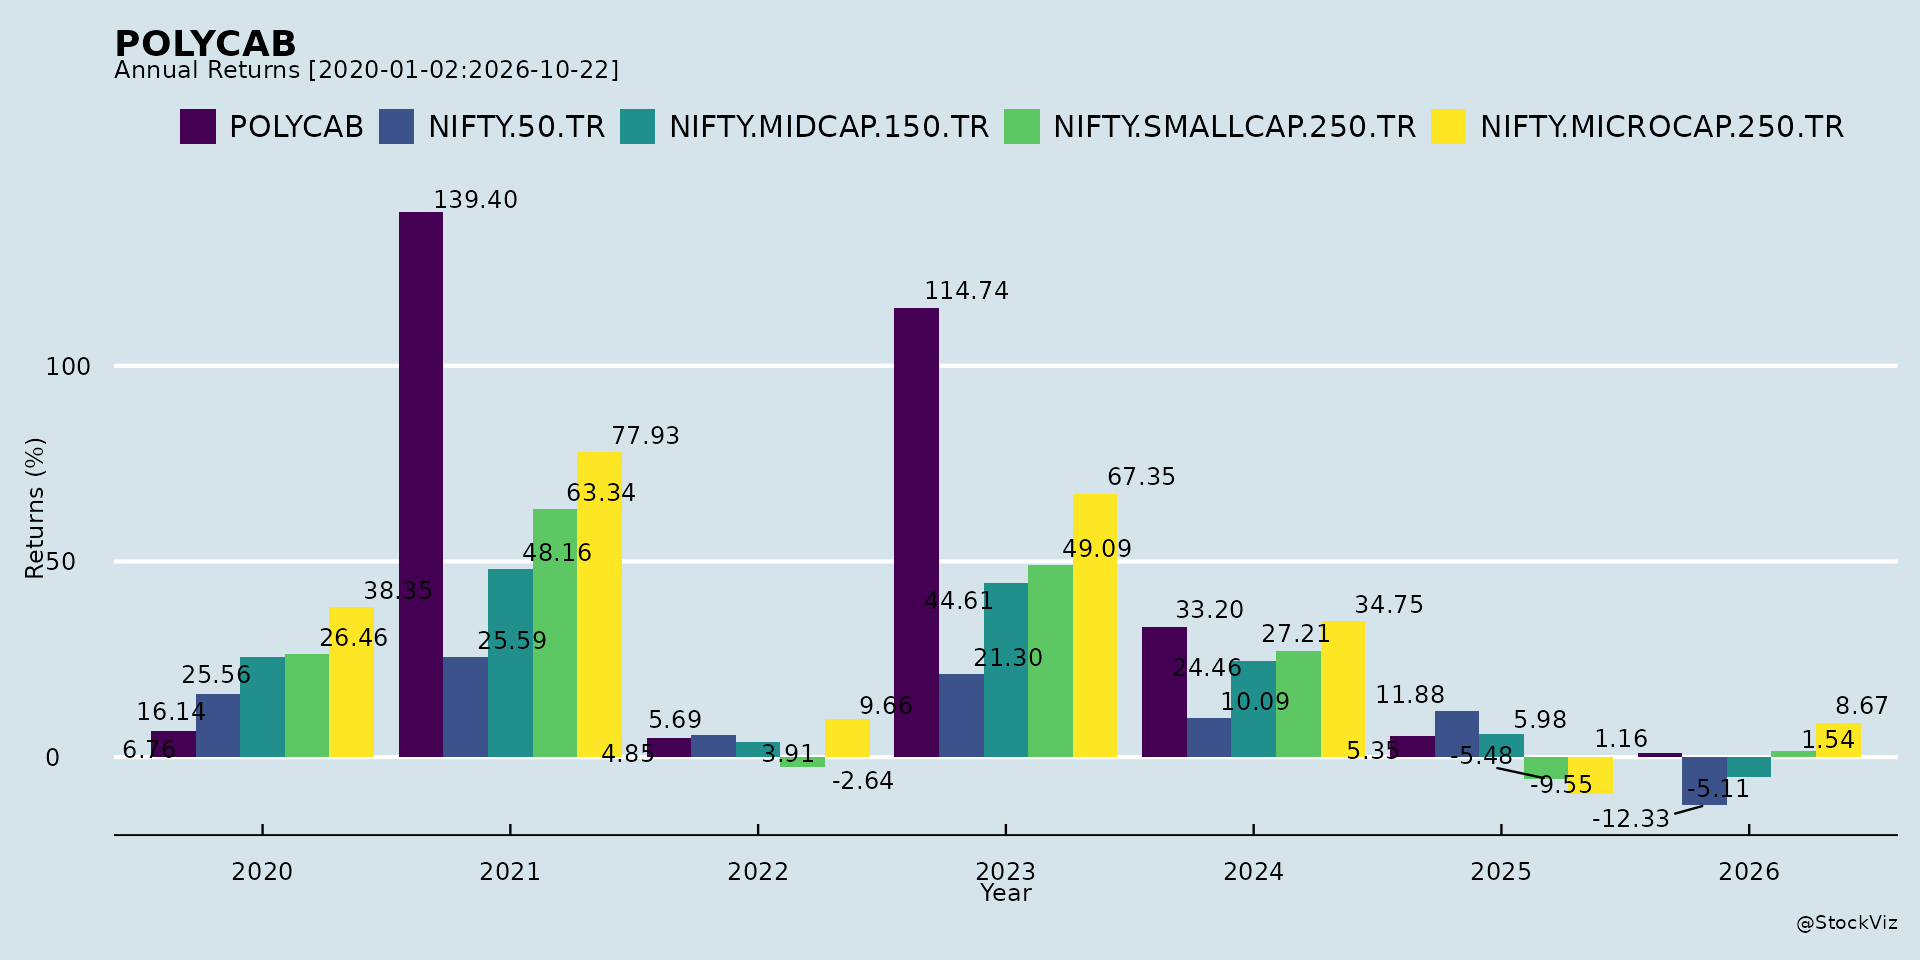
Annual Returns
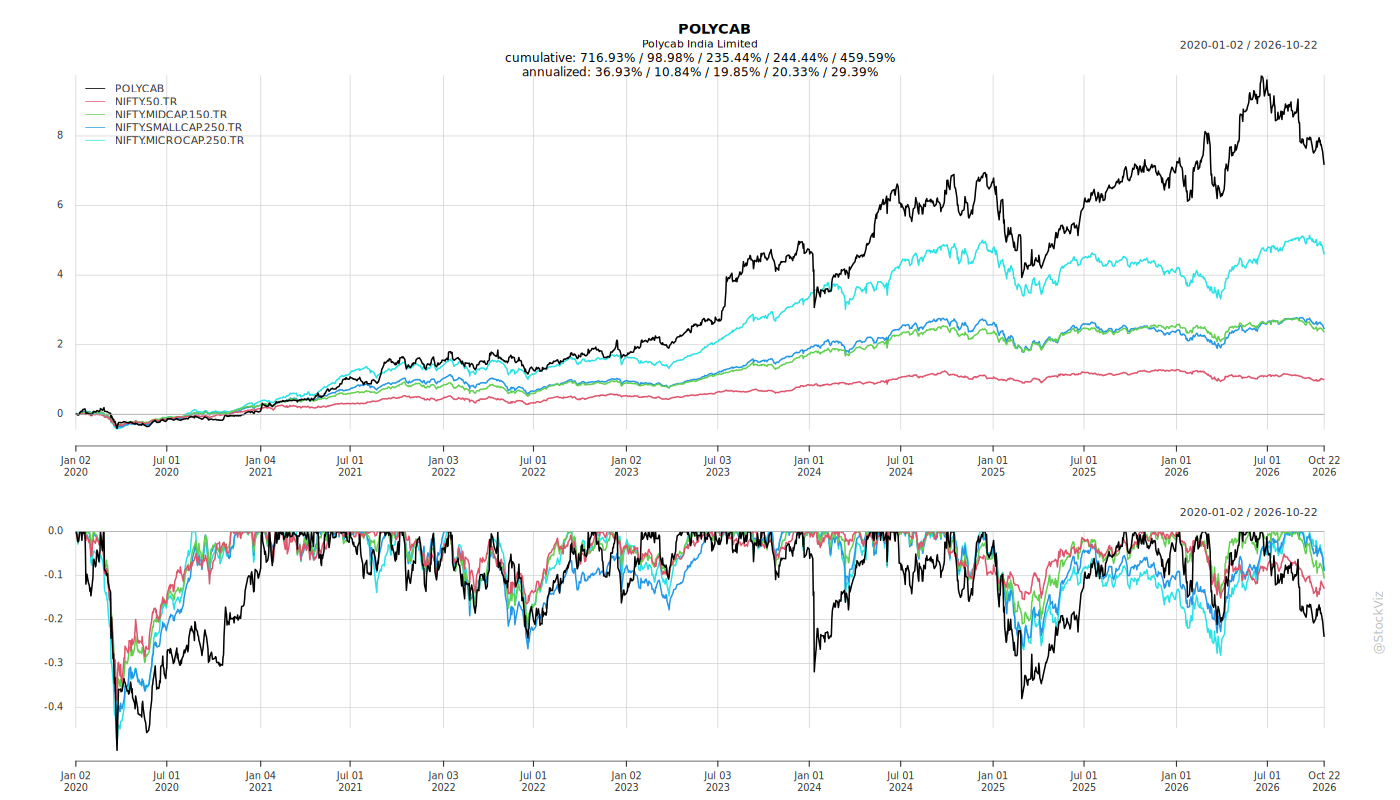
Cumulative Returns and Drawdowns
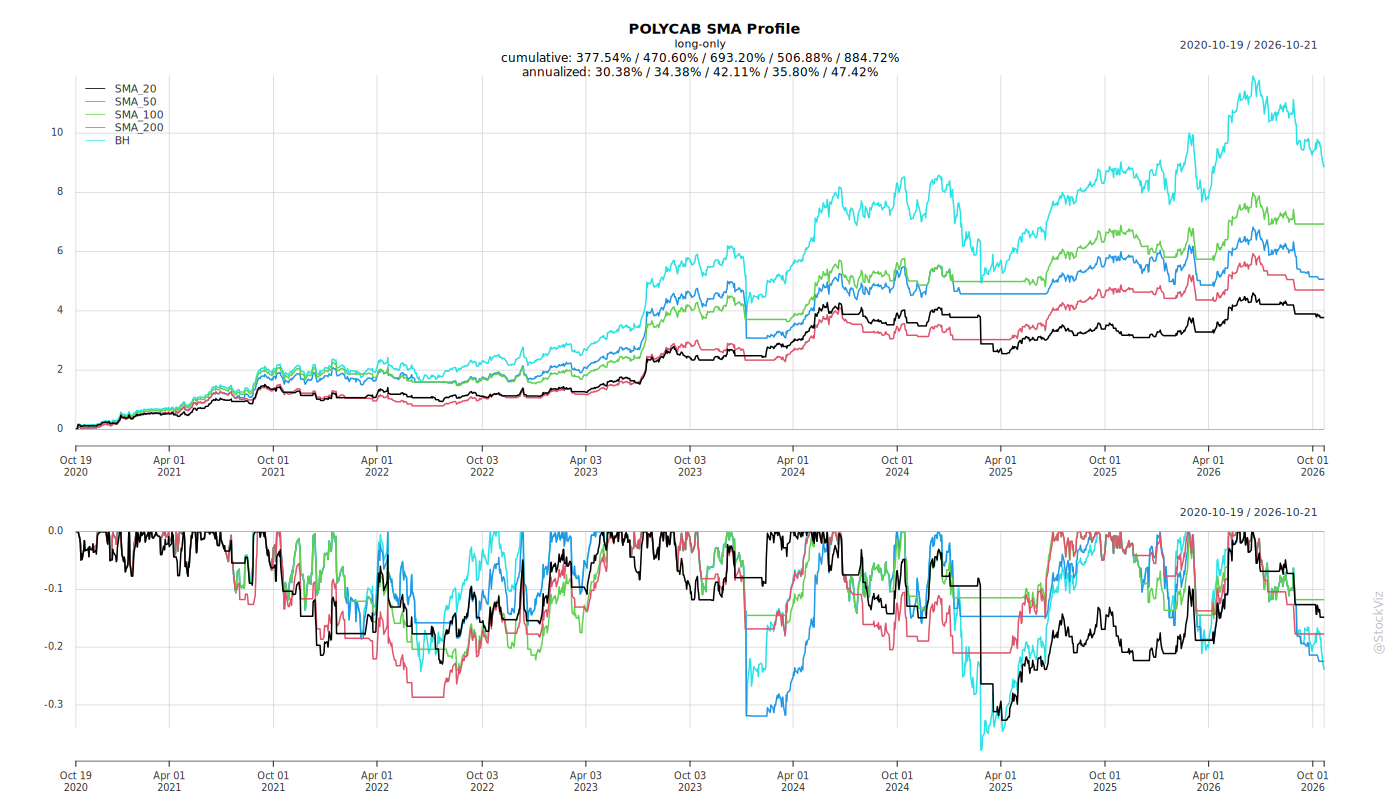
Fundamentals
Ownership
Margined
AI Summary
asof: 2026-09-14
Polycab India — Q1 FY27 Corporate Announcements Summary
1. Headwinds and Challenges
Global macroeconomic and geopolitical disruption. Management described a global landscape shaped by ongoing geopolitical developments, with disruptions across energy markets and global trade routes — particularly around the Strait of Hormuz — contributing to inflationary pressures during the first half of 2026. Oil prices moderated from April peaks but remained volatile, and uncertainty around the energy crisis, supply chains and global trade flows was expected to persist in the near term.
Tighter global monetary stance. The IMF projected global growth of approximately 3% for 2026 with global inflation forecasts revised higher. The Fed held rates at 3.5%–3.75% in June but turned notably more hawkish, expecting rates to rise later in the year. The Bank of England held at 3.75% to gauge the impact of the U.S.-Iran war. The RBI held the repo rate at 5.25% with a neutral stance, flagging accrued-driven inflation and rupee volatility as key swing factors.
International business decline. The international business witnessed a year-on-year decline, reflecting the impact of near-term geopolitical developments. The press release quantified this as a 13% YoY degrowth in the international business. Middle East geographies were impacted from March, and certain geographies continued to be affected.
Weak EPC revenue. EPC revenues of ₹3,077 million in Q1 FY27 declined 11% YoY, attributed to the timing and execution cycle of projects, with milestone-linked payouts meaning revenue recognition can shift between quarters.
Soft volume growth on a high base. W&C volume growth was low to mid-single digits YoY, against a very strong Q1 FY26 base (approximately 26% volume growth for cables and wires combined, with cables north of 25% and wires north of 20%). Wires recorded high single-digit growth while cables were low to mid-single digit.
Subdued channel stocking. Channel stocking did not meet expectations, impacted by falling raw material prices — aluminium fell roughly 18–20% point-to-point from June 1 to June 30, and copper fell from almost ₹14,000 to ₹13,100–13,200. Management noted stocking occurs when prices rise and destocking when prices fall.
Margin drags. Export contribution did not meaningfully contribute in the quarter, and operating leverage did not move favourably, partly offsetting gains from a favourable wires-versus-cables mix and higher channel-versus-institutional sales.
Working capital normalization. The average working capital cycle improved to 15 days in Q1 FY27, aided by a temporary increase in payable days from use of letters of credit for raw material procurement. Management expects the cycle to settle back within the long-term operating range of 45 to 50 days as these effects normalize.
2. Tailwinds and Growth Prospects
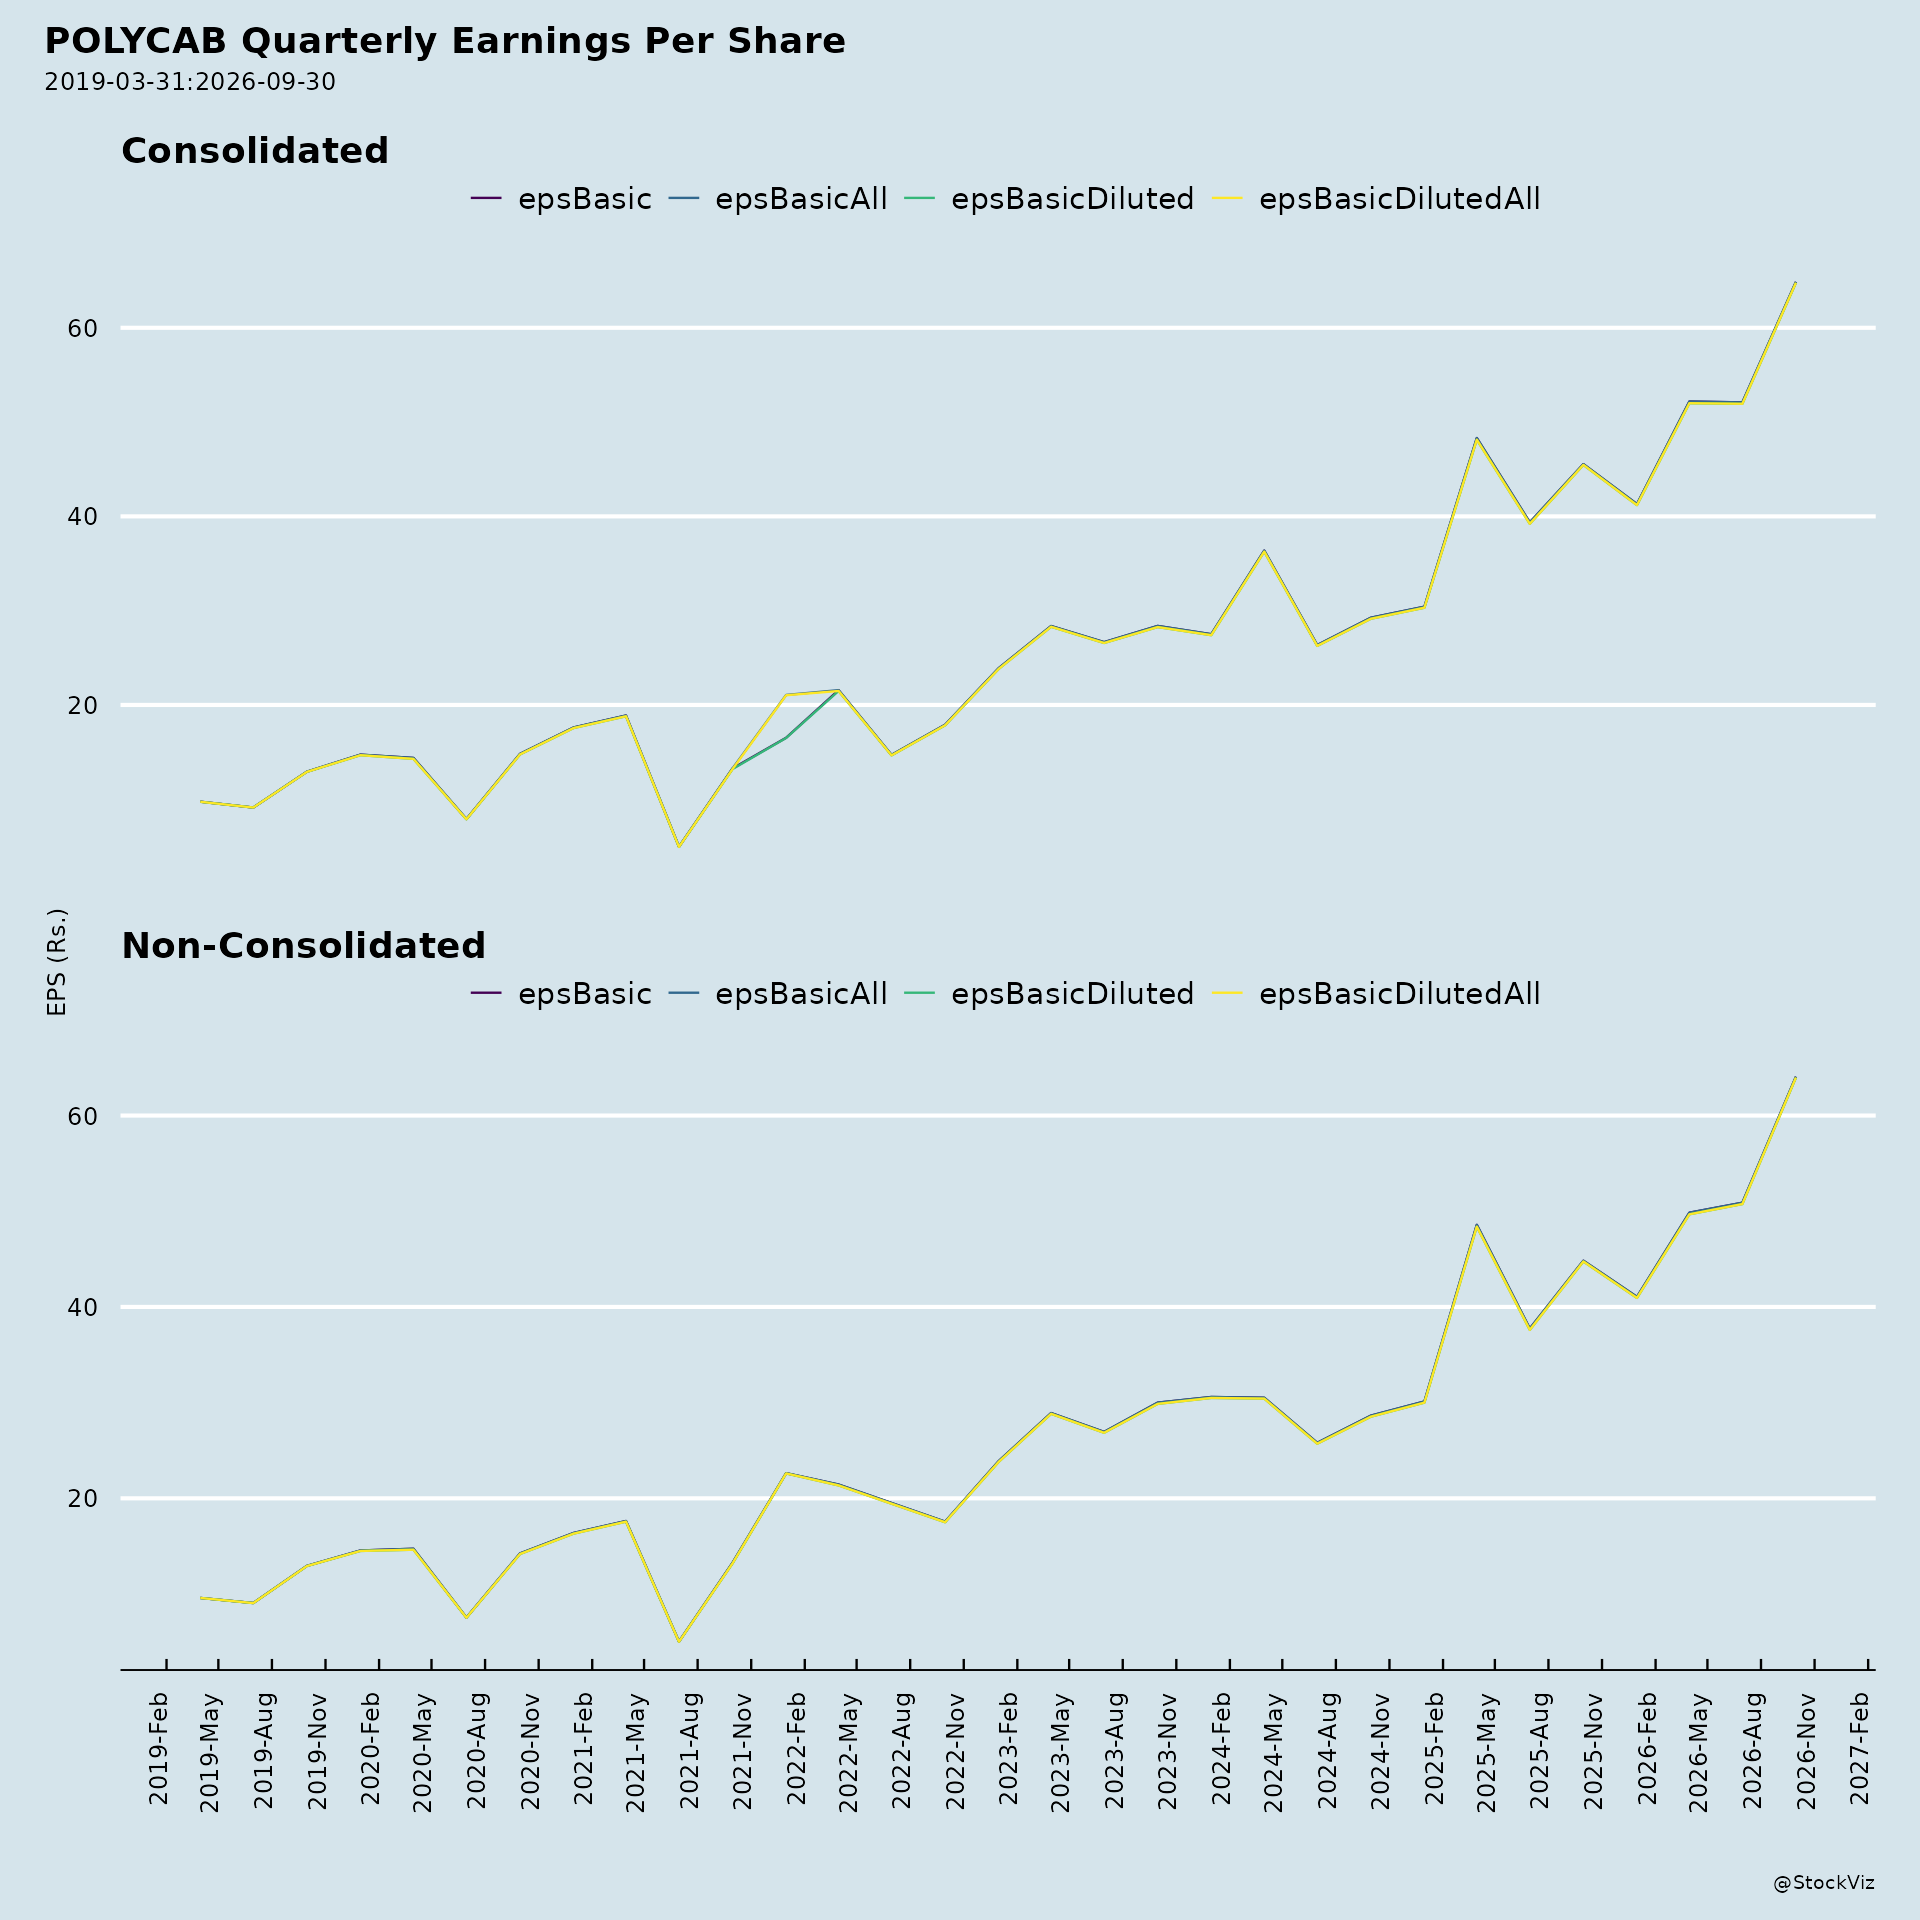
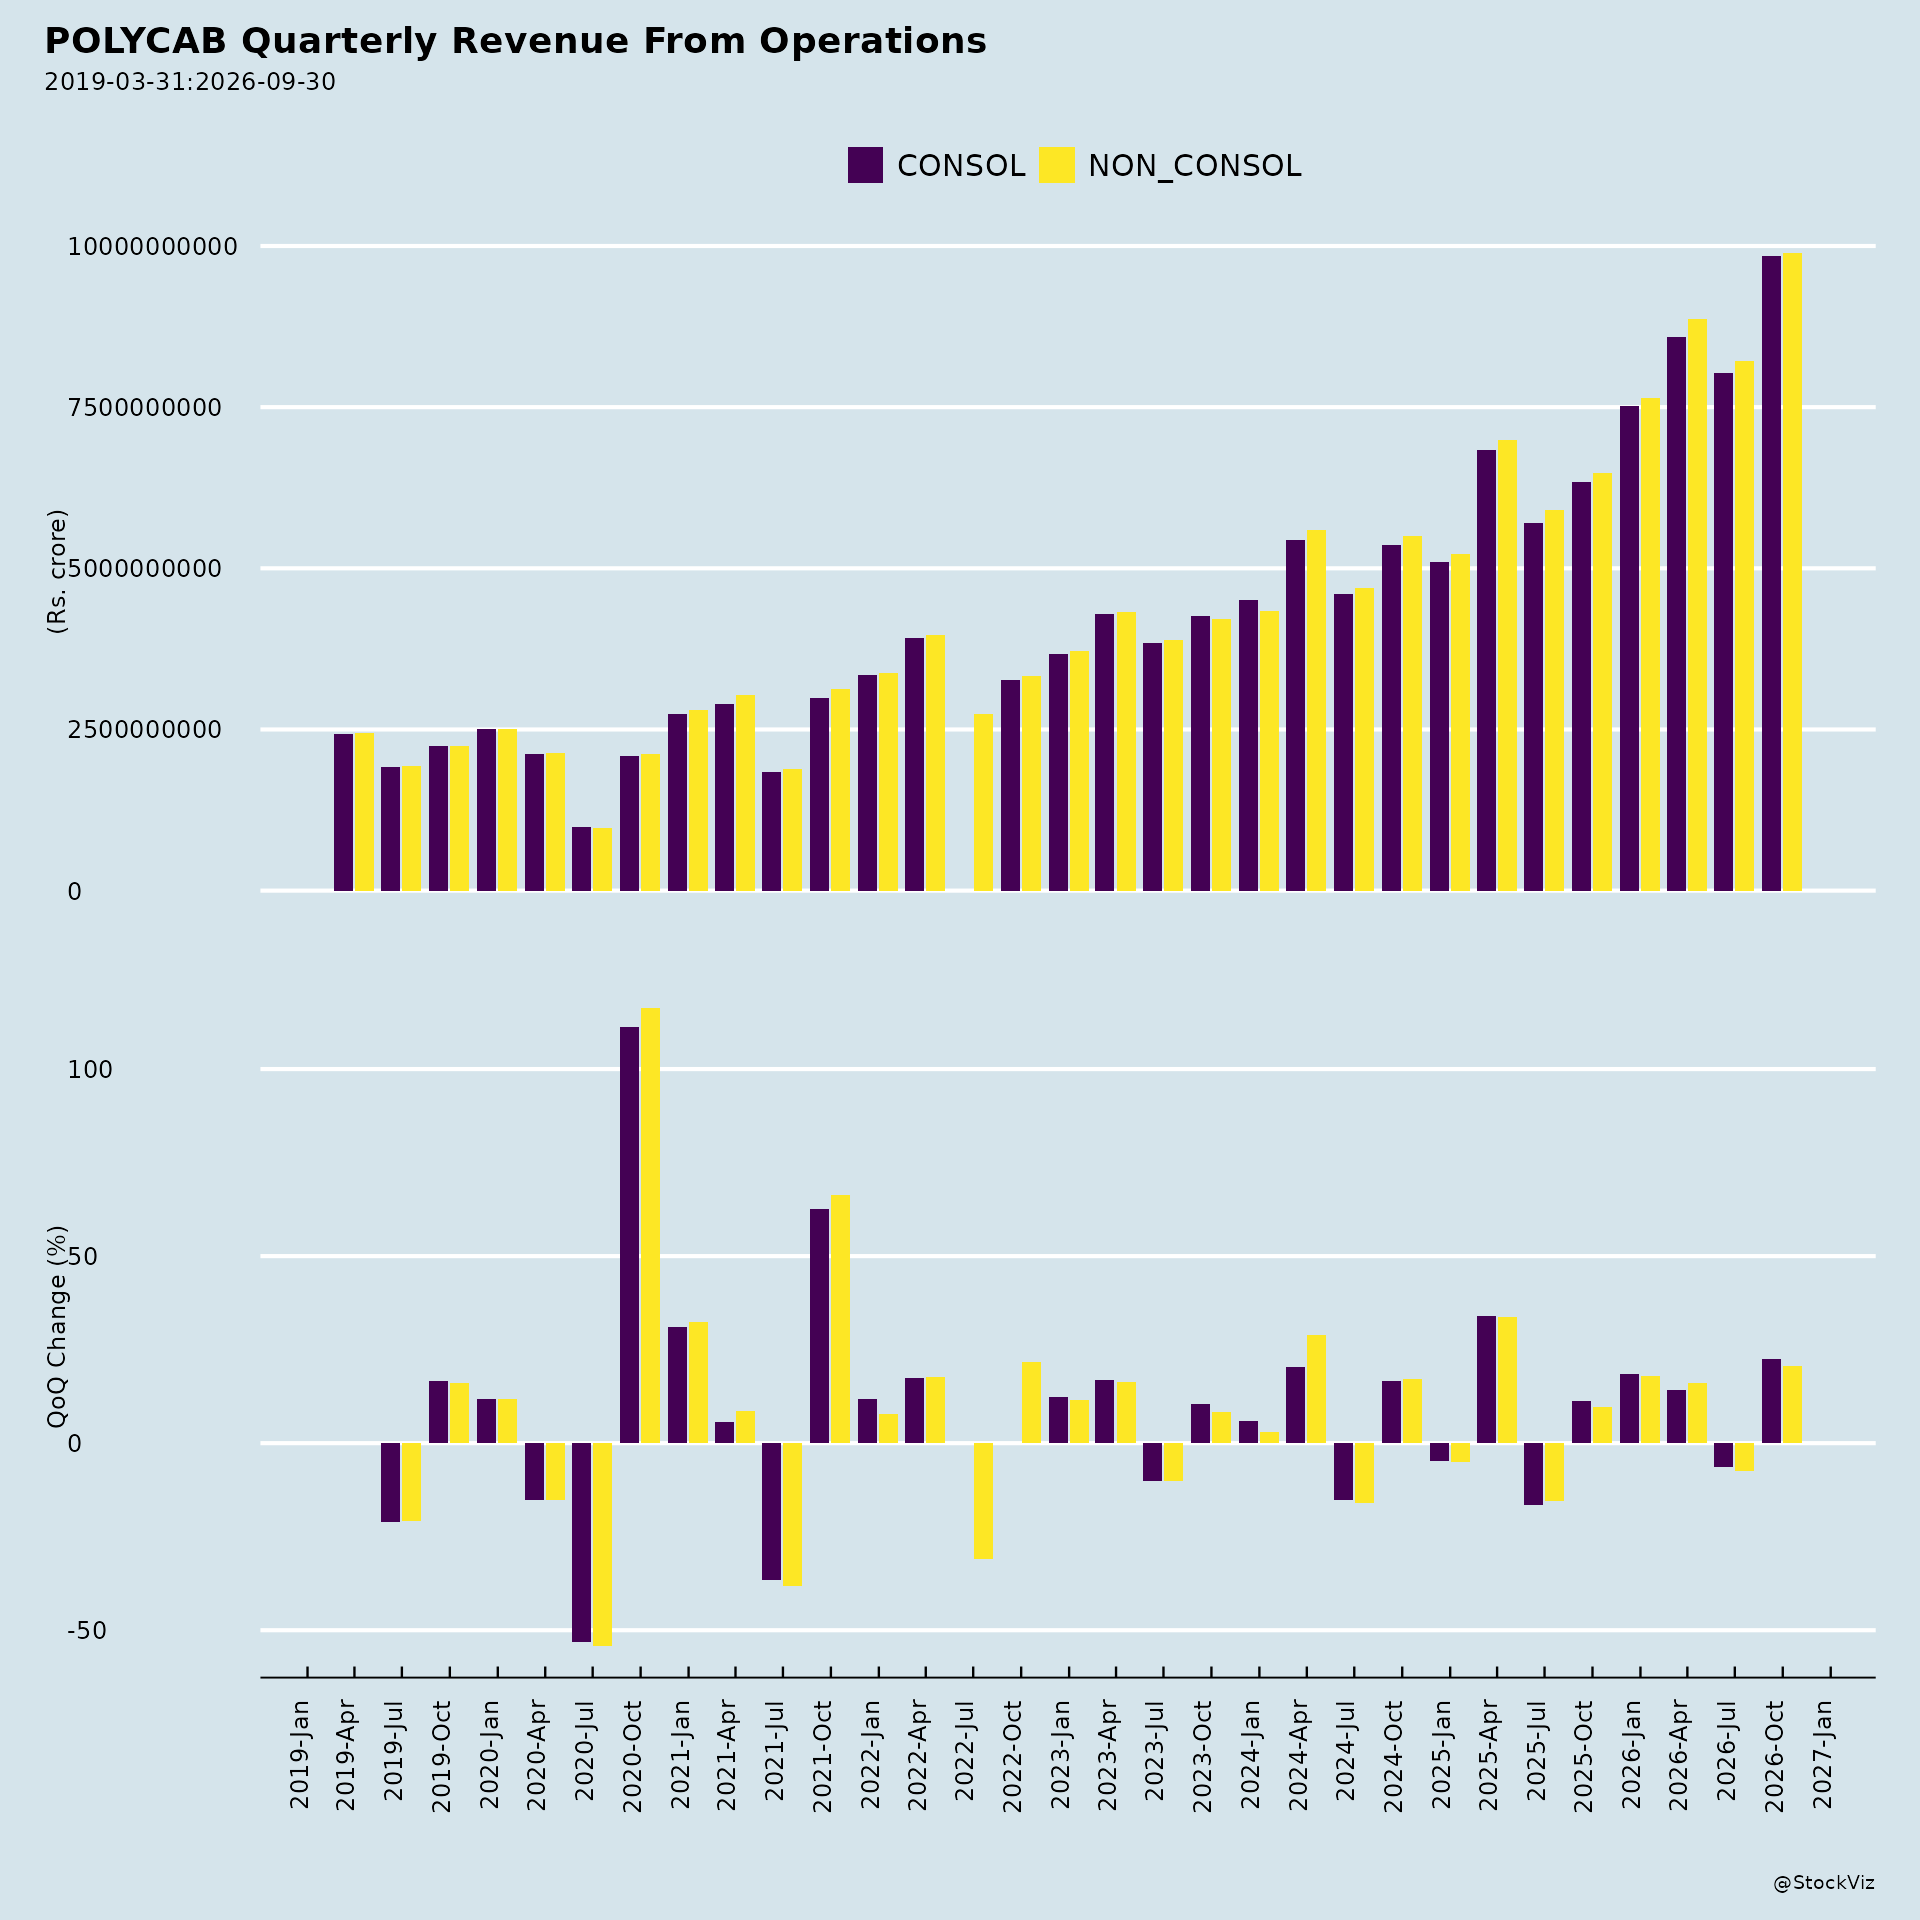
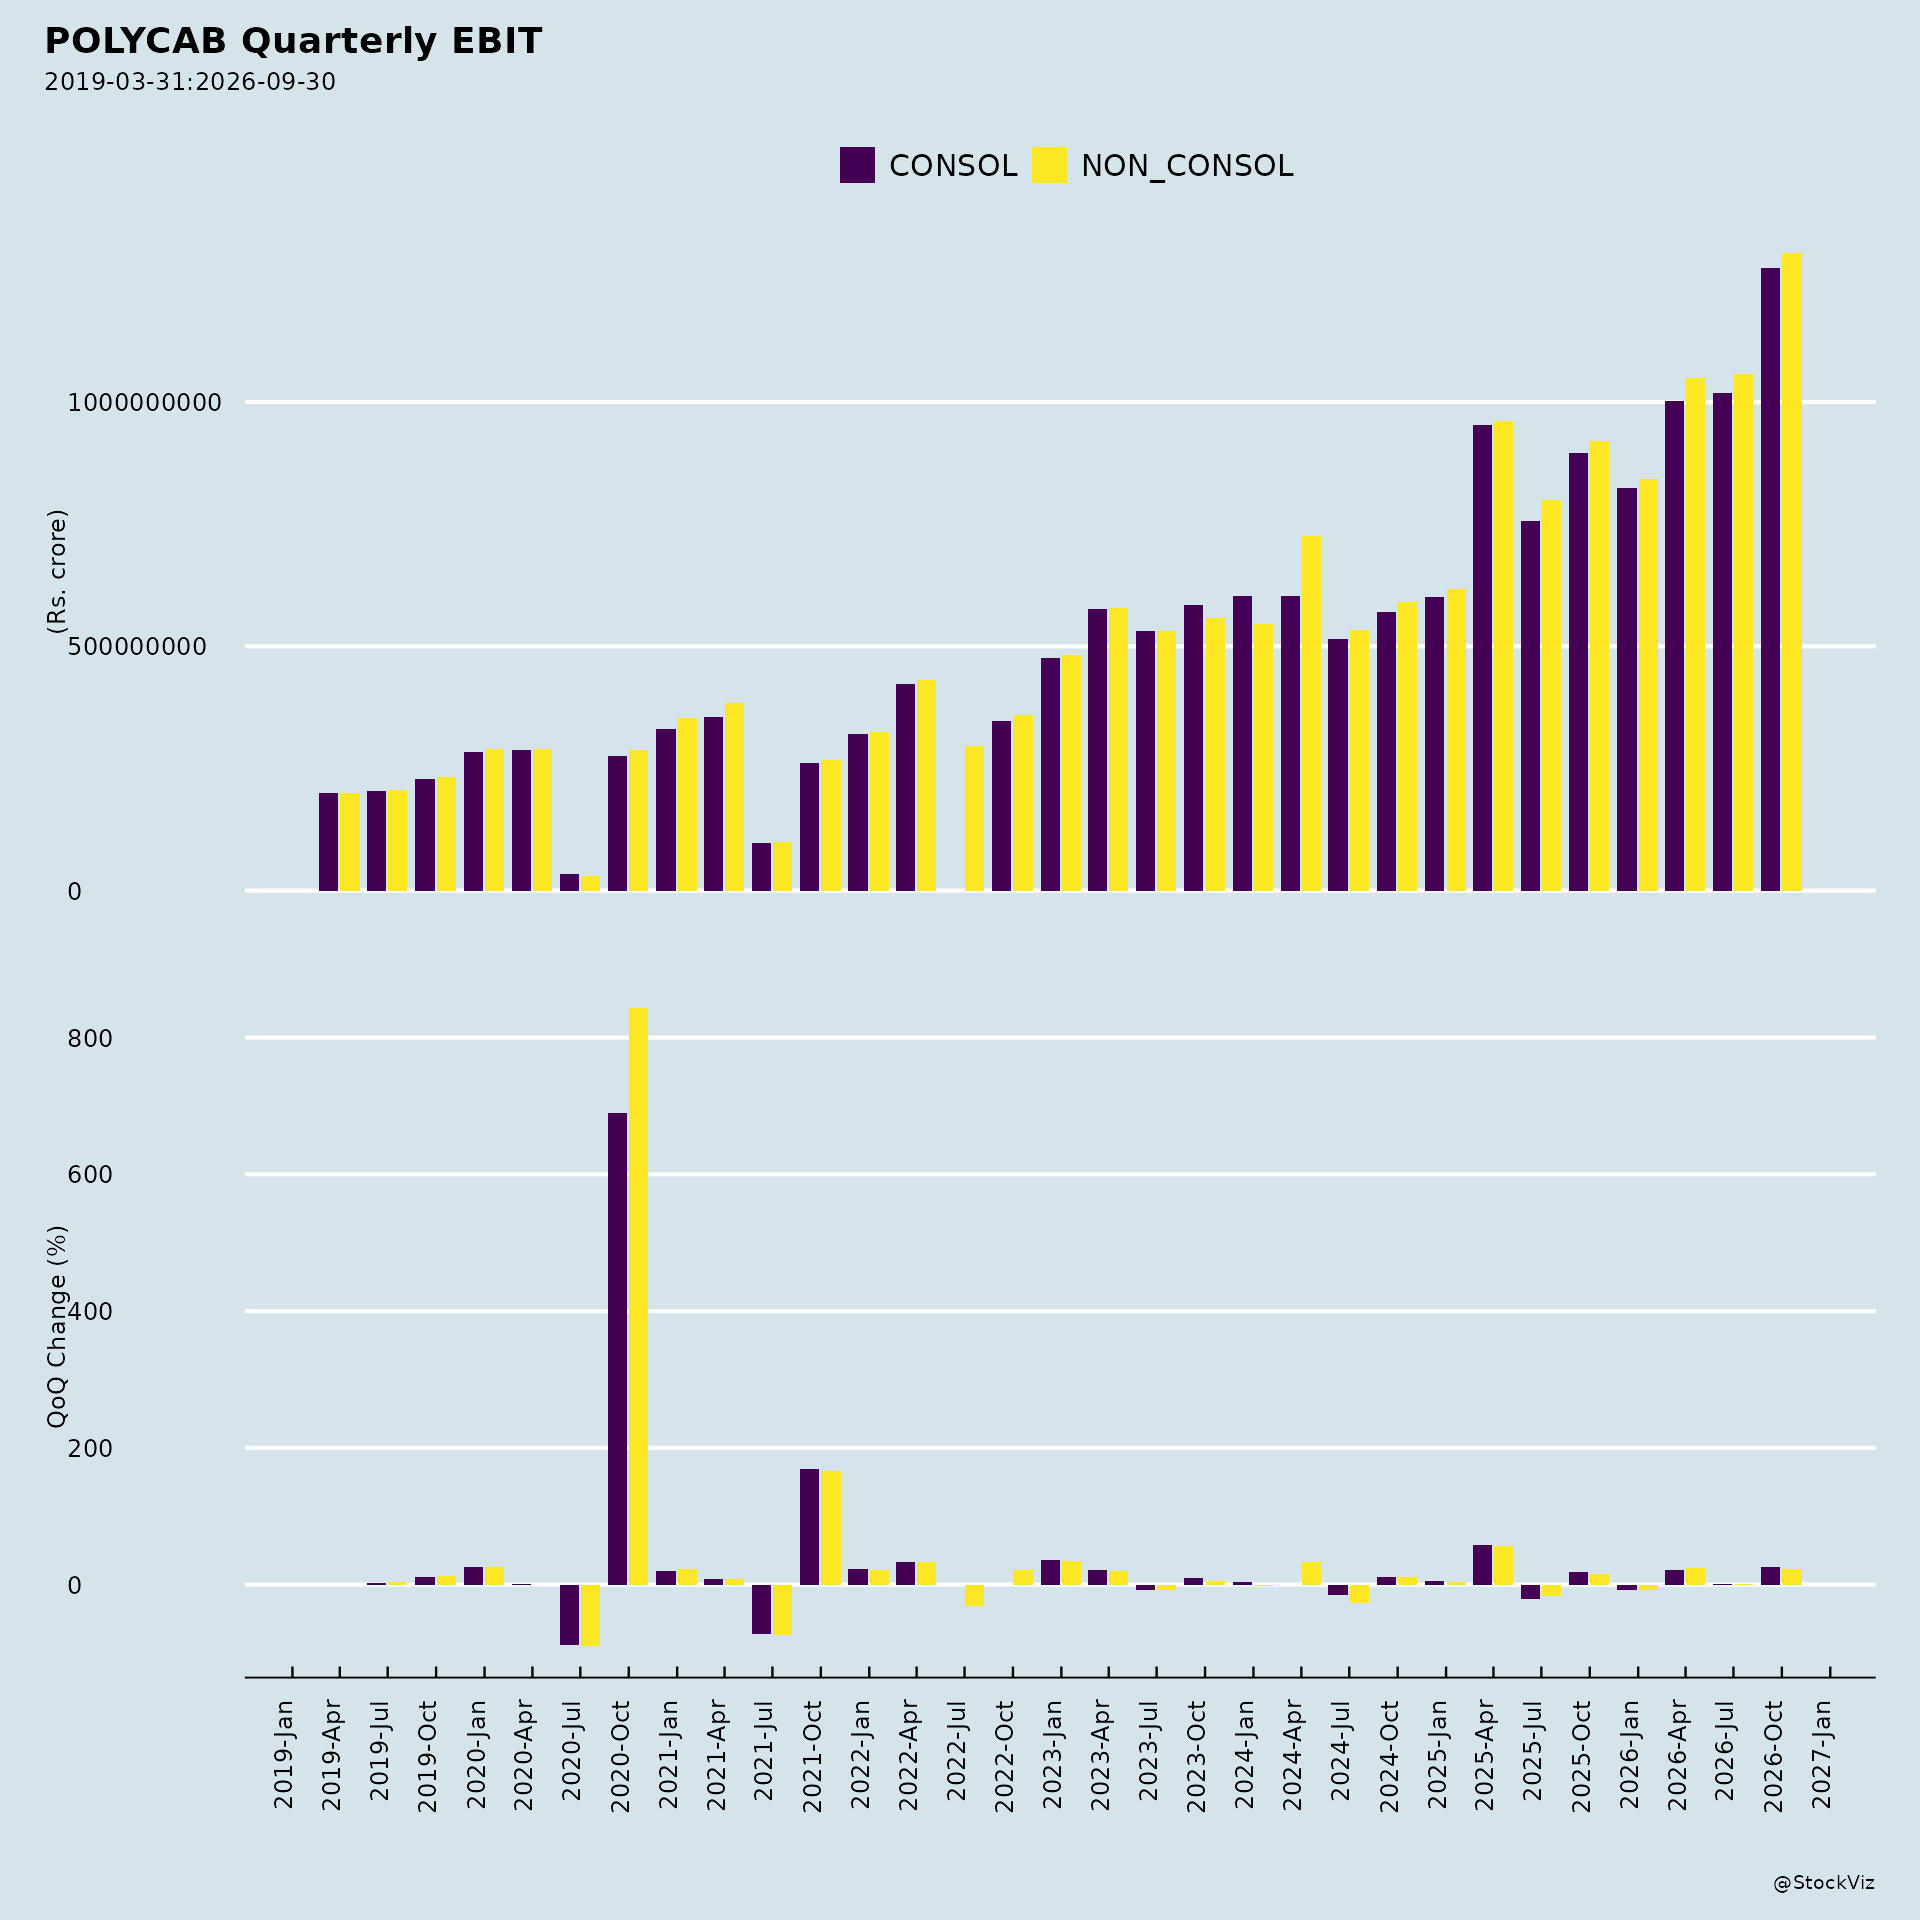
Strong consolidated performance. Consolidated revenues grew 39% YoY to ₹82,097 million. EBITDA rose 32% YoY to ₹11,362 million with margins at 13.8%, an improvement of approximately 70 basis points sequentially. PAT reached the highest ever quarterly level at ₹7,967 million, up 33% YoY, with PAT margins at 9.7%. Finance costs were ₹800 million and other income ₹1,049 million. The balance sheet had a net cash position of ₹39.9 billion, and capex for the quarter was ₹3.2 billion.
Wires & Cables momentum. The segment grew 39% YoY, with domestic revenues up 43%, supported by robust market demand, execution across key channels and favourable commodity-linked realizations. Wires grew faster than cables; channel sales outperformed institutional sales. The West was the strongest region, followed by North, South and East. EBIT margins stood at 13.3%, with sequential improvement from favourable business mix and operational excellence.
FMEG outperformance. FMEG grew 71% YoY with strong contributions across all product categories — the tenth consecutive quarter of outperforming industry growth rates. Solar, the largest category, delivered more than twofold YoY growth, benefiting from PM Surya Ghar Yojana, state-level incentives and rising consumer adoption of renewable energy. Fans, lighting, switches, switchgears, conduit pipes and fittings also grew healthily. EBIT margins were 8%, in line with Project Spring milestones. Premium mix rose to almost 25% of the overall FMEG portfolio, 33% in fans and 38% in lighting and luminaires. Category order by topline was solar, fans, pipes and conduits, then lights, switchgears and switches.
Data centre opportunity. Management cited an installed base of about 1.6 gigawatts, with estimates of 8 to 16–18 gigawatts over 5 to 8 years. One megawatt was estimated to translate into around ₹3.5 crores of cables, with 50–60% conventional and the balance optical fibre, implying a ₹20,000–25,000 crores market over 6–8 years. Polycab supplied conventional cables to Vodafone Idea data centres in Mohali, Pune and South India.
Power T&D and generation pipeline. Around 55–56 gigawatts of renewable generation was added in the last financial year. Under the National Generation Adequacy plan, capacity must reach approximately 1,120 gigawatts by FY36, with 70% from renewables; solar must rise from about 150 gigawatts to over 500 gigawatts. Average transmission line capacity addition was around 15,000 circuit kilometres in FY20–FY25, expected to rise above 20,000–21,000 circuit kilometres on average in FY26–FY30, with CEA predicting at least 17,000 circuit kilometres in FY27. About 2,000 circuit kilometres were already executed in April and May. MNRE spent about 90%-plus of its ₹24,000 crores budget last year. Transformer companies’ order books were around 2.5x revenue. Roughly ₹100 spent on T&D translates to about 15% cable requirement.
Private capex and mobility. BSE 500 companies ex-BFSI committed around ₹11.6 lakh crores for capacity enhancement and new capex over the next 12 to 18 months, largely in metals, semiconductors, manufacturing and renewables. Mobility accounts for 10–12% of cable demand, with about 10,000 kilometres of road and highway construction annually and 800 new Vande Bharat trains expected by 2030. Defence, EV charging infrastructure and data centres were around 4–5% today but could create another layer of demand.
Exports recovery. Management reported good momentum returning in exports with a healthy order book across the U.S., Europe and Latin America. In Q1, the Middle East contributed about 20–24% of business (Oman, Saudi, UAE), North America about 45–50%, and Europe about 18–20%. Ten new geographies were added last year, taking the footprint to 94 countries. The U.S. distribution setup was described as more or less complete, with market representatives appointed and a healthy order book and inquiry bank.
Bharat Net and RDSS. The overall Bharat Net order is around ₹8,000 crores, with a ₹4,500 crores execution piece over three years; fibre has been secured for the execution period of the next 2 to 3 years, with the supply portion around 30% of overall value. Combined Bharat Net and RDSS order book stands at around ₹10,900 crores. RDSS order book at the start of execution was around ₹3,250 crores.
Government capex support. Government capex in the first two months of FY27 was ₹2.51 lakh crores versus ₹2.21 lakh crores in April–May of the prior year, a 14% growth. India was described as one of the strongest performing major economies, benefiting from robust domestic demand, public investment, healthy credit expansion and increasing private sector capex, with real estate and formalization trends supportive of medium-term growth.
3. Key Risks
- Persistent geopolitical uncertainty around energy, supply chains and global trade flows, with volatility in oil prices and potential recurrence of Middle East tensions.
- Hawkish global central bank stances and higher global inflation forecasts, with the RBI flagging accrued-driven inflation and rupee volatility.
- Exposure of the international business to geopolitical developments, as evidenced by the 13% YoY decline and the Middle East impact from March.
- Raw material price volatility (copper and aluminium) affecting channel stocking and destocking behaviour, and the pass-through cost-plus model.
- Timing and milestone-linked revenue recognition in EPC, causing quarterly revenue variability.
- Dependence of the solar category on government policies and incentive programs such as PM Surya Ghar Yojana and state incentives.
- Uncertainty over the pace of data centre capacity translation from estimates to reality, with management noting it could not give a bullish number and that timing is uncertain.
- Potential delays in T&D capex, acknowledged in discussion as a possible risk to volume growth.
- Working capital cycle normalization from the temporarily low 15 days back to the 45–50 day range.
- Competitive intensity, with management noting significant competition entering the cables and wires sector.
- Seasonality in FMEG categories such as fans and lights.
4. Management Guidance Versus Observed Performance
Wires & Cables margins. Medium- to long-term margin guidance of 11% to 13% under Project Spring. Observed: EBIT margin of 13.3% in Q1 FY27, with sequential improvement from favourable mix and operational excellence.
FMEG profitability. Project Spring targets EBITDA margins of 8% to 10% by FY30, with growth at 1.5x to 2x industry growth. Observed: EBIT margin of 8.0% in Q1 FY27, described as in line with Project Spring milestones, with the business having turned profitable in Q4 FY25 and steadily enhancing earnings. Management characterized the current trajectory as very good but noted seasonality and reiterated the full-year ambition of 8% to 10% EBITDA margins.
EPC margins. Guidance of sustainable operating margins in the high single-digit range over the medium to long term. Observed: Q1 FY27 EBIT margin of 11.0%, which management said should be viewed against the long-term high single-digit expectation.
Volume growth. Guidance of growing at 1.5x of market growth, a mix of volume and value, reiterated through FY30. Observed: Q1 FY27 volume growth of low to mid-single digits on a high base; FY26 full-year volume growth of 18%. Management noted three months is not a good indicator and that 10 to 12 months is appropriate for assessing trends, citing a double-digit volume CAGR over the last 5 to 7 years.
Exports. Guidance of exports going north of 10% of overall topline by 2030, implying export growth higher than domestic. Observed: international business declined 13% YoY in Q1 FY27, though management reported momentum returning, a healthy order book and expectation of sizable pickup in U.S. and overall exports in coming quarters of the financial year.
Bharat Net and RDSS revenue. Management indicated roughly one-third of the ₹4,500 crores Bharat Net execution piece could translate into revenue, implying ₹800 crores to ₹1,000 crores from Bharat Net alone, and about ₹800-odd crores from RDSS this year. Observed: EPC revenue declined 11% YoY in Q1 FY27 due to project execution timing.
Working capital. Long-term operating range guided at 45 to 50 days. Observed: 15 days in Q1 FY27, aided by a temporary increase in payable days from LC-based raw material procurement, expected to normalize.
Market share. Management updated that overall market share gains of 3% to 4% were reported in the prior quarter, noting that quarter-on-quarter analysis may not be meaningful and that structural gains appear only after 8 to 10 months, once peers have declared results.
Price revisions. Management confirmed a price correction/revision of about 3% to 4% in the first fortnight of July, with translation into volumes expected gradually.
Broker Narrative
Broker narrative evolved from cautious accumulation driven by FMEG weakness and channel headwinds, to bullish calls on C&W growth, international momentum and Switches traction; however, late-2026 fears around EHV delays and margin compression reasserted, causing sharp losses and resetting the optimistic tone.
Fears that came true
- FMEG segment margin erosion persisted through FY2024-26, directly manifesting as the observed EBITDA margin contraction and gross margin compression, leading to negative stock returns in mid-2026.
Optimism that failed
- International business momentum that had grown export revenue by 50% YoY in FY23 faded by late 2026, contributing to the sharp stock decline.
- Switches category traction that grew 1.5x YoY in Q4FY23 faded by mid-2026.
- Premiumization and channel realignment targets (10-12% EBITDA margins by FY26E) were not met, as margins continued to compress.
- Solar product multi-fold growth that was initially strong deteriorated by late 2026.
- The positive medium-term demand outlook that brokers relied on failed to materialize, with results turning negative after early successes.
Broker Timeline
60 broker calls · 2023-05-15 to 2026-10-16
Copyright © 2023 SAS Data Analytics Pvt. Ltd. All rights reserved.