PHOENIXLTD
Equity Metrics
September 24, 2026
The Phoenix Mills Limited
Residential Commercial Projects
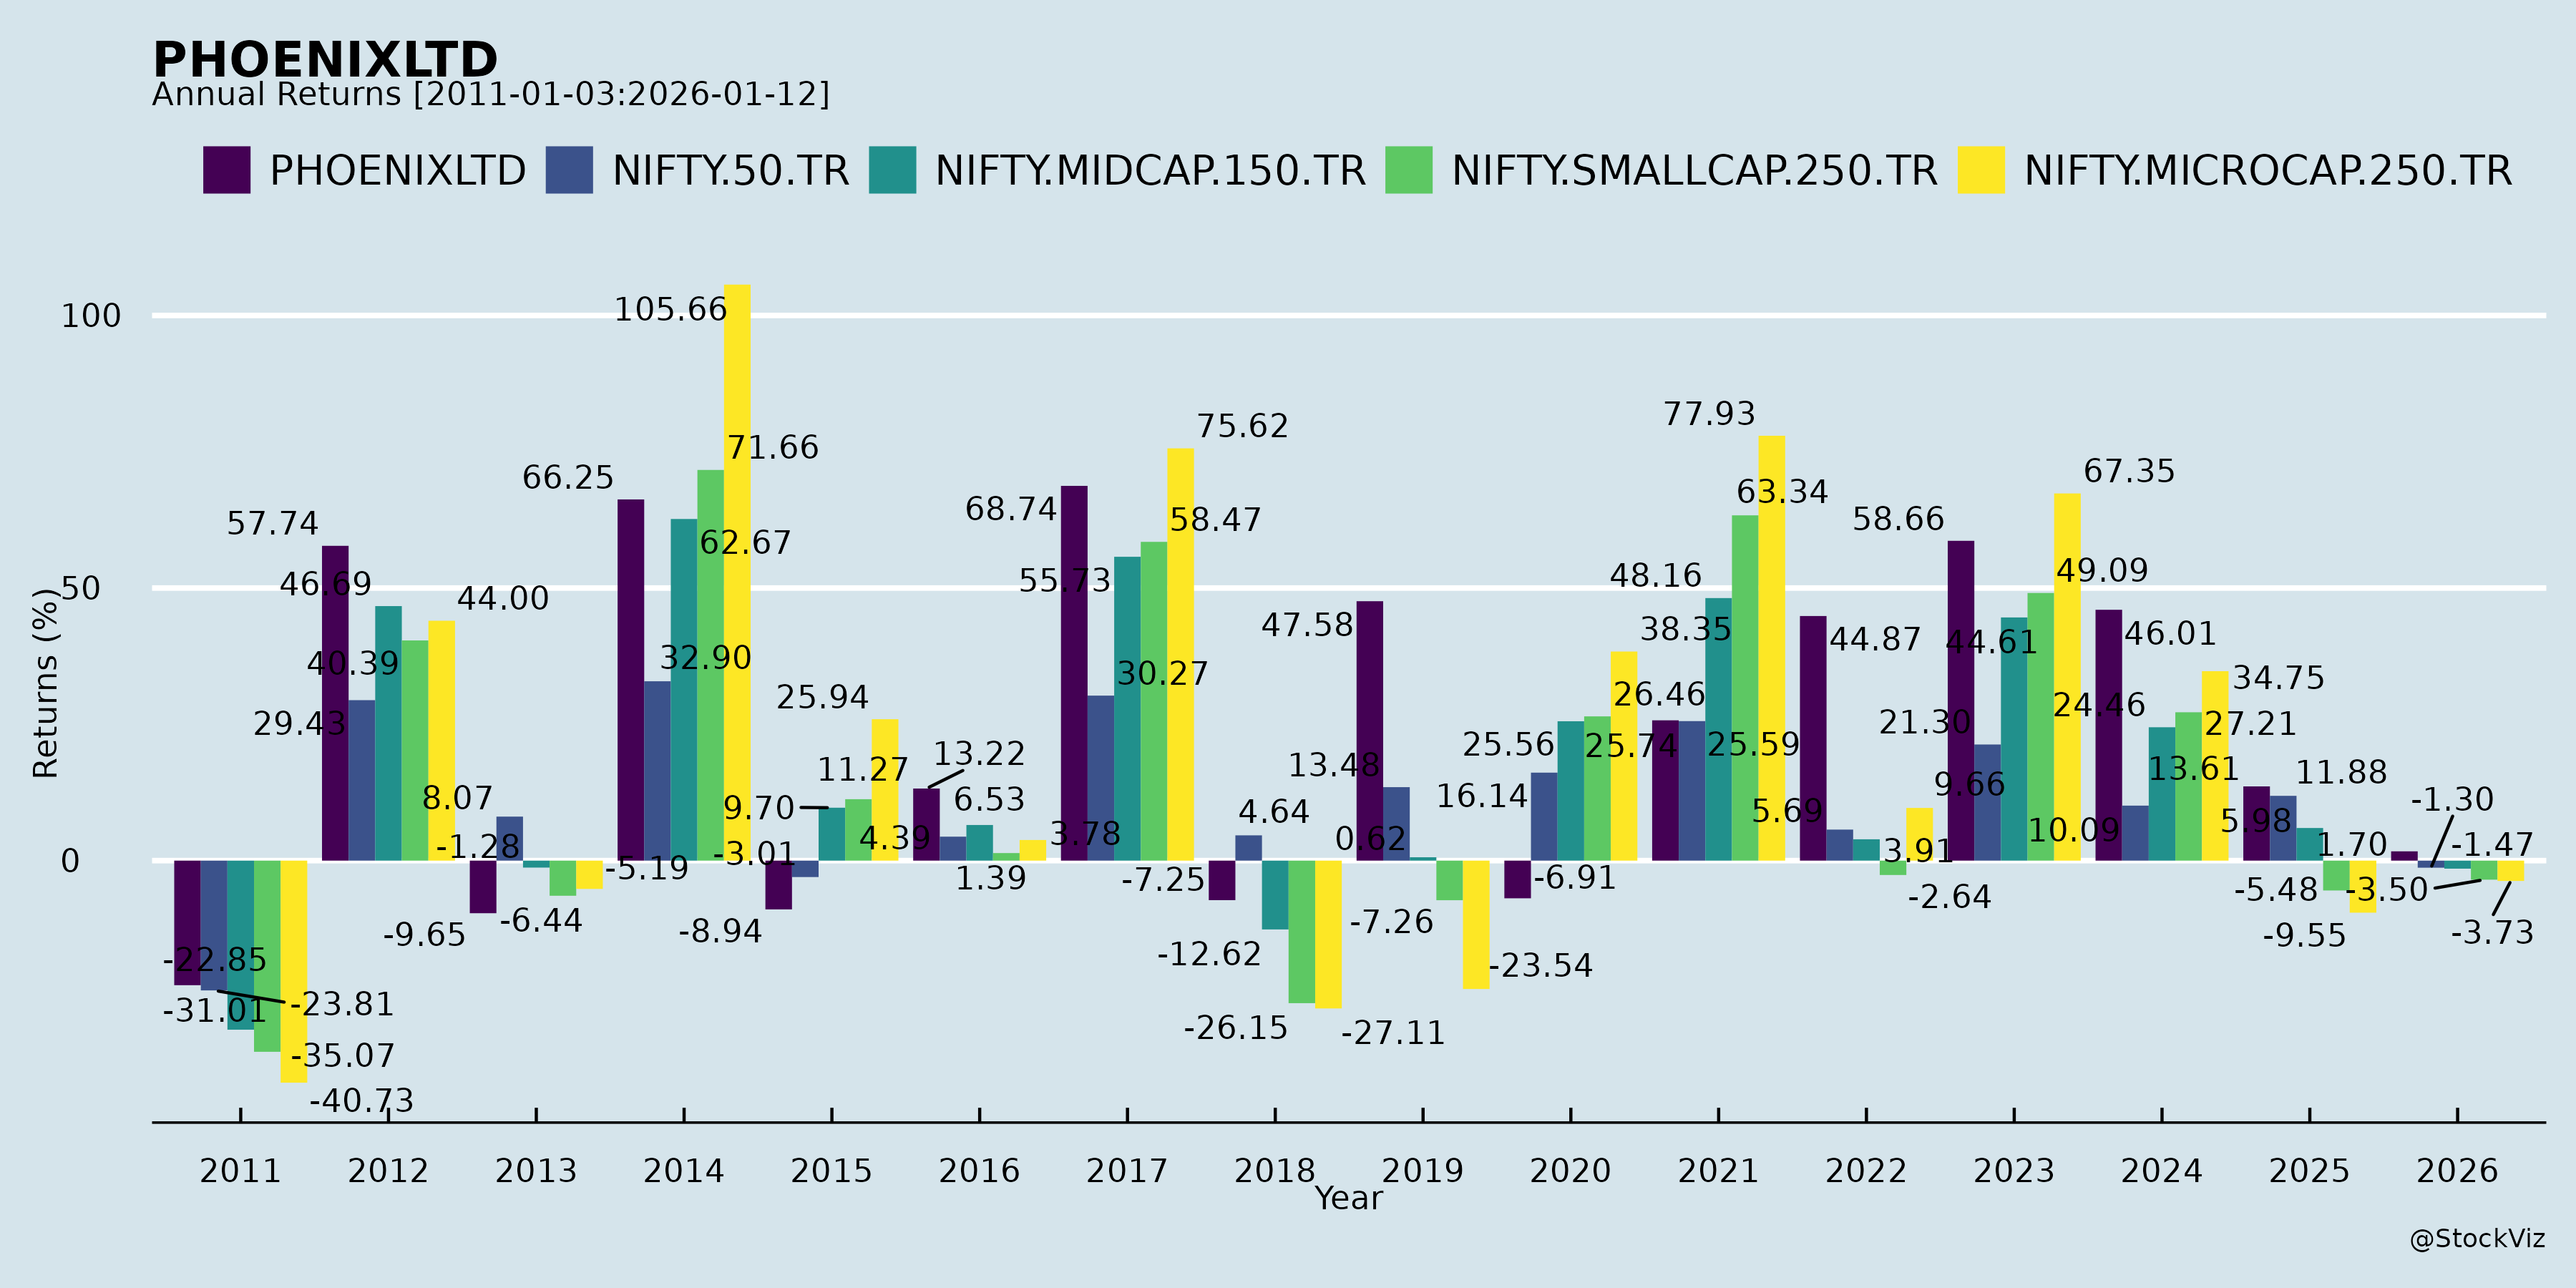
Annual Returns
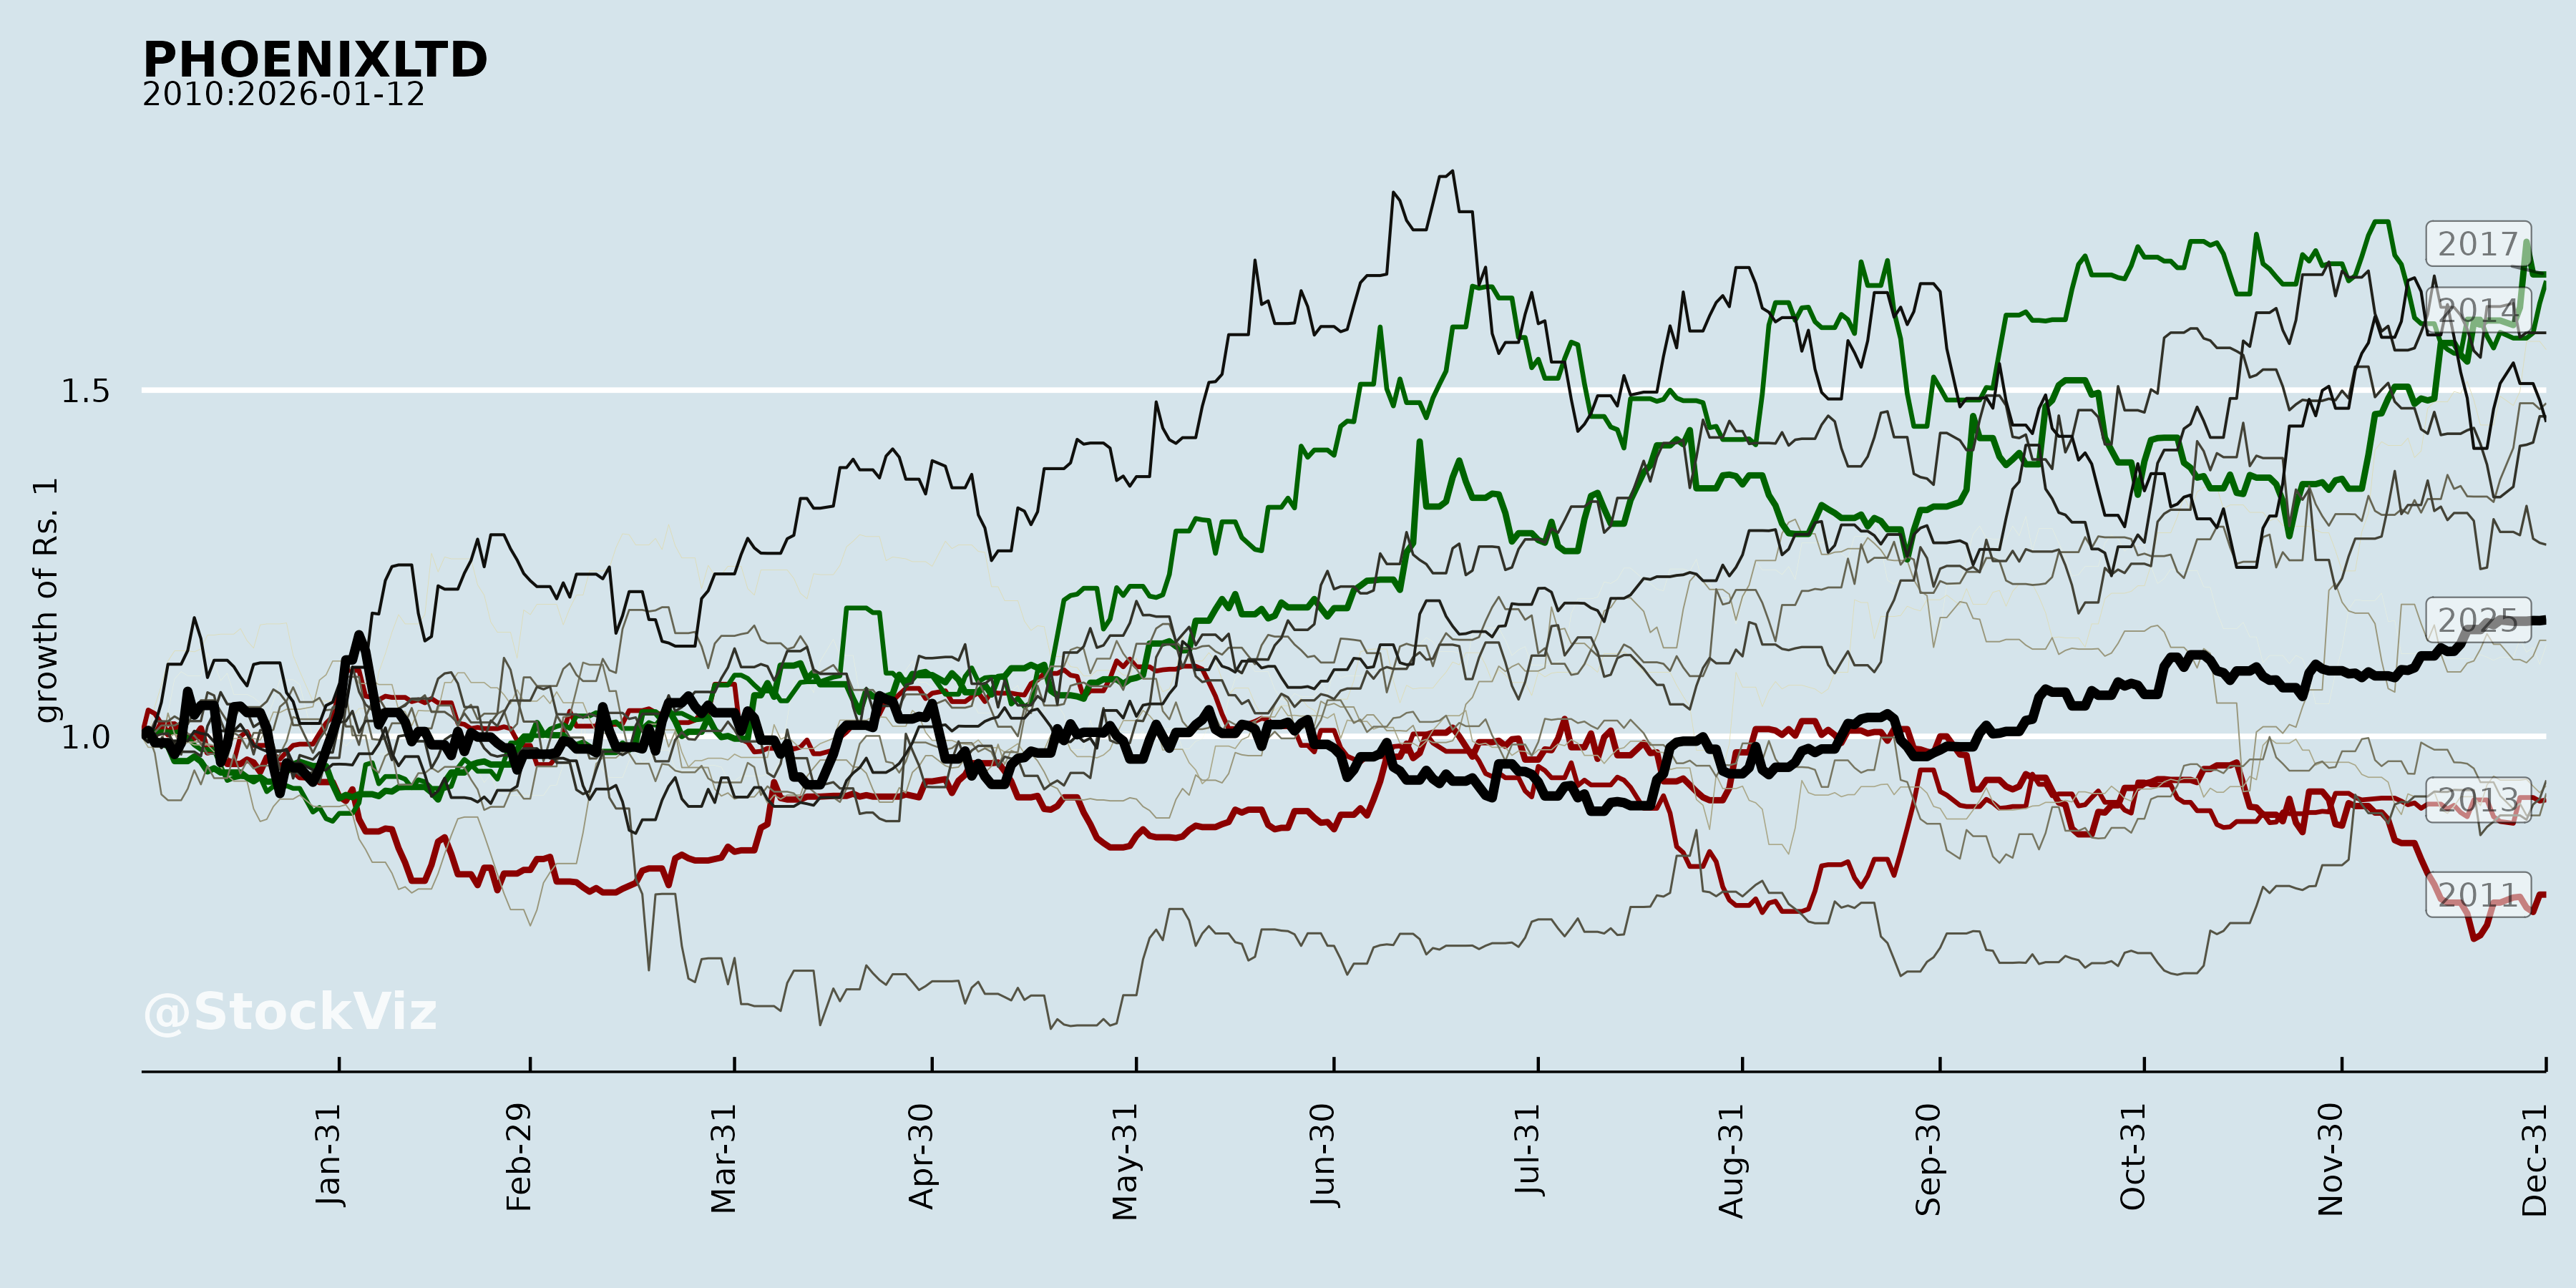
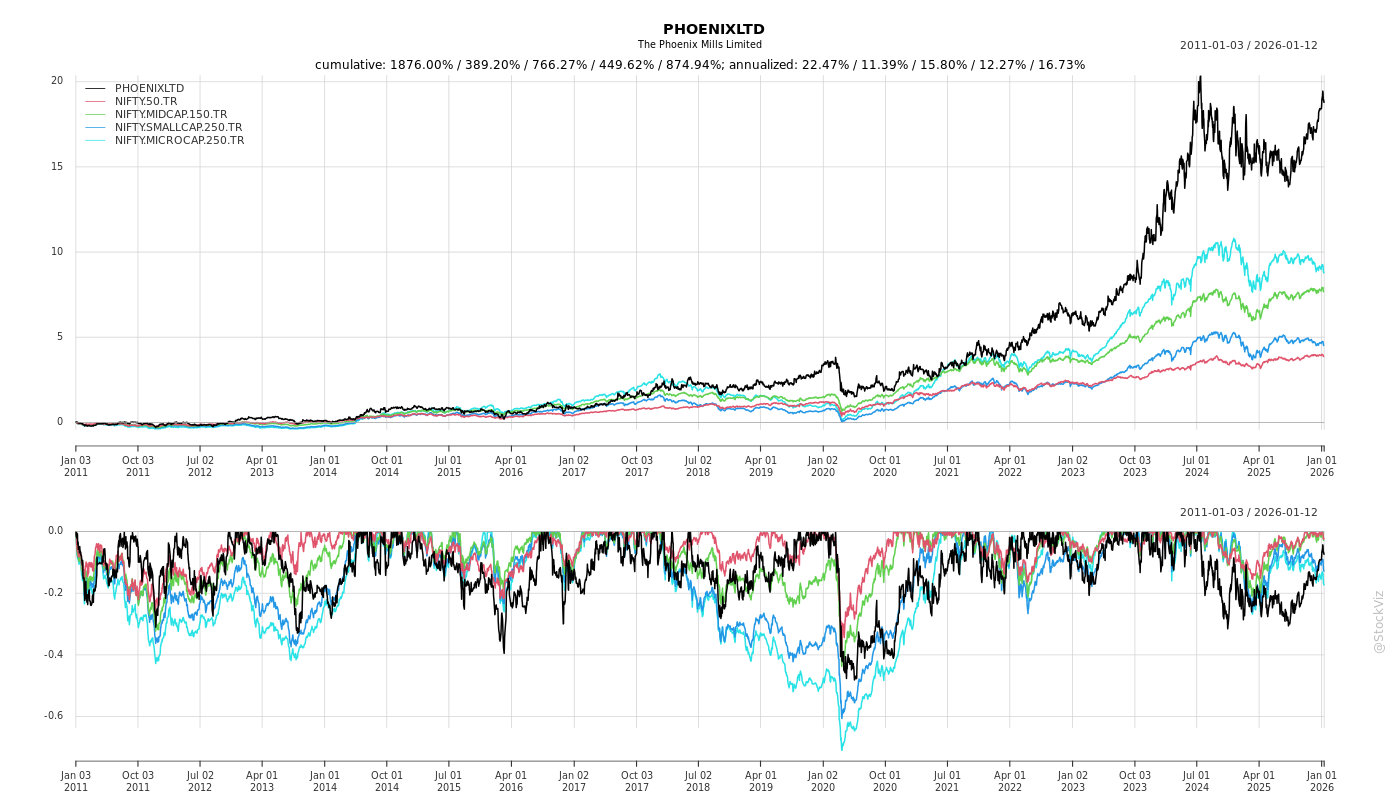
Cumulative Returns and Drawdowns
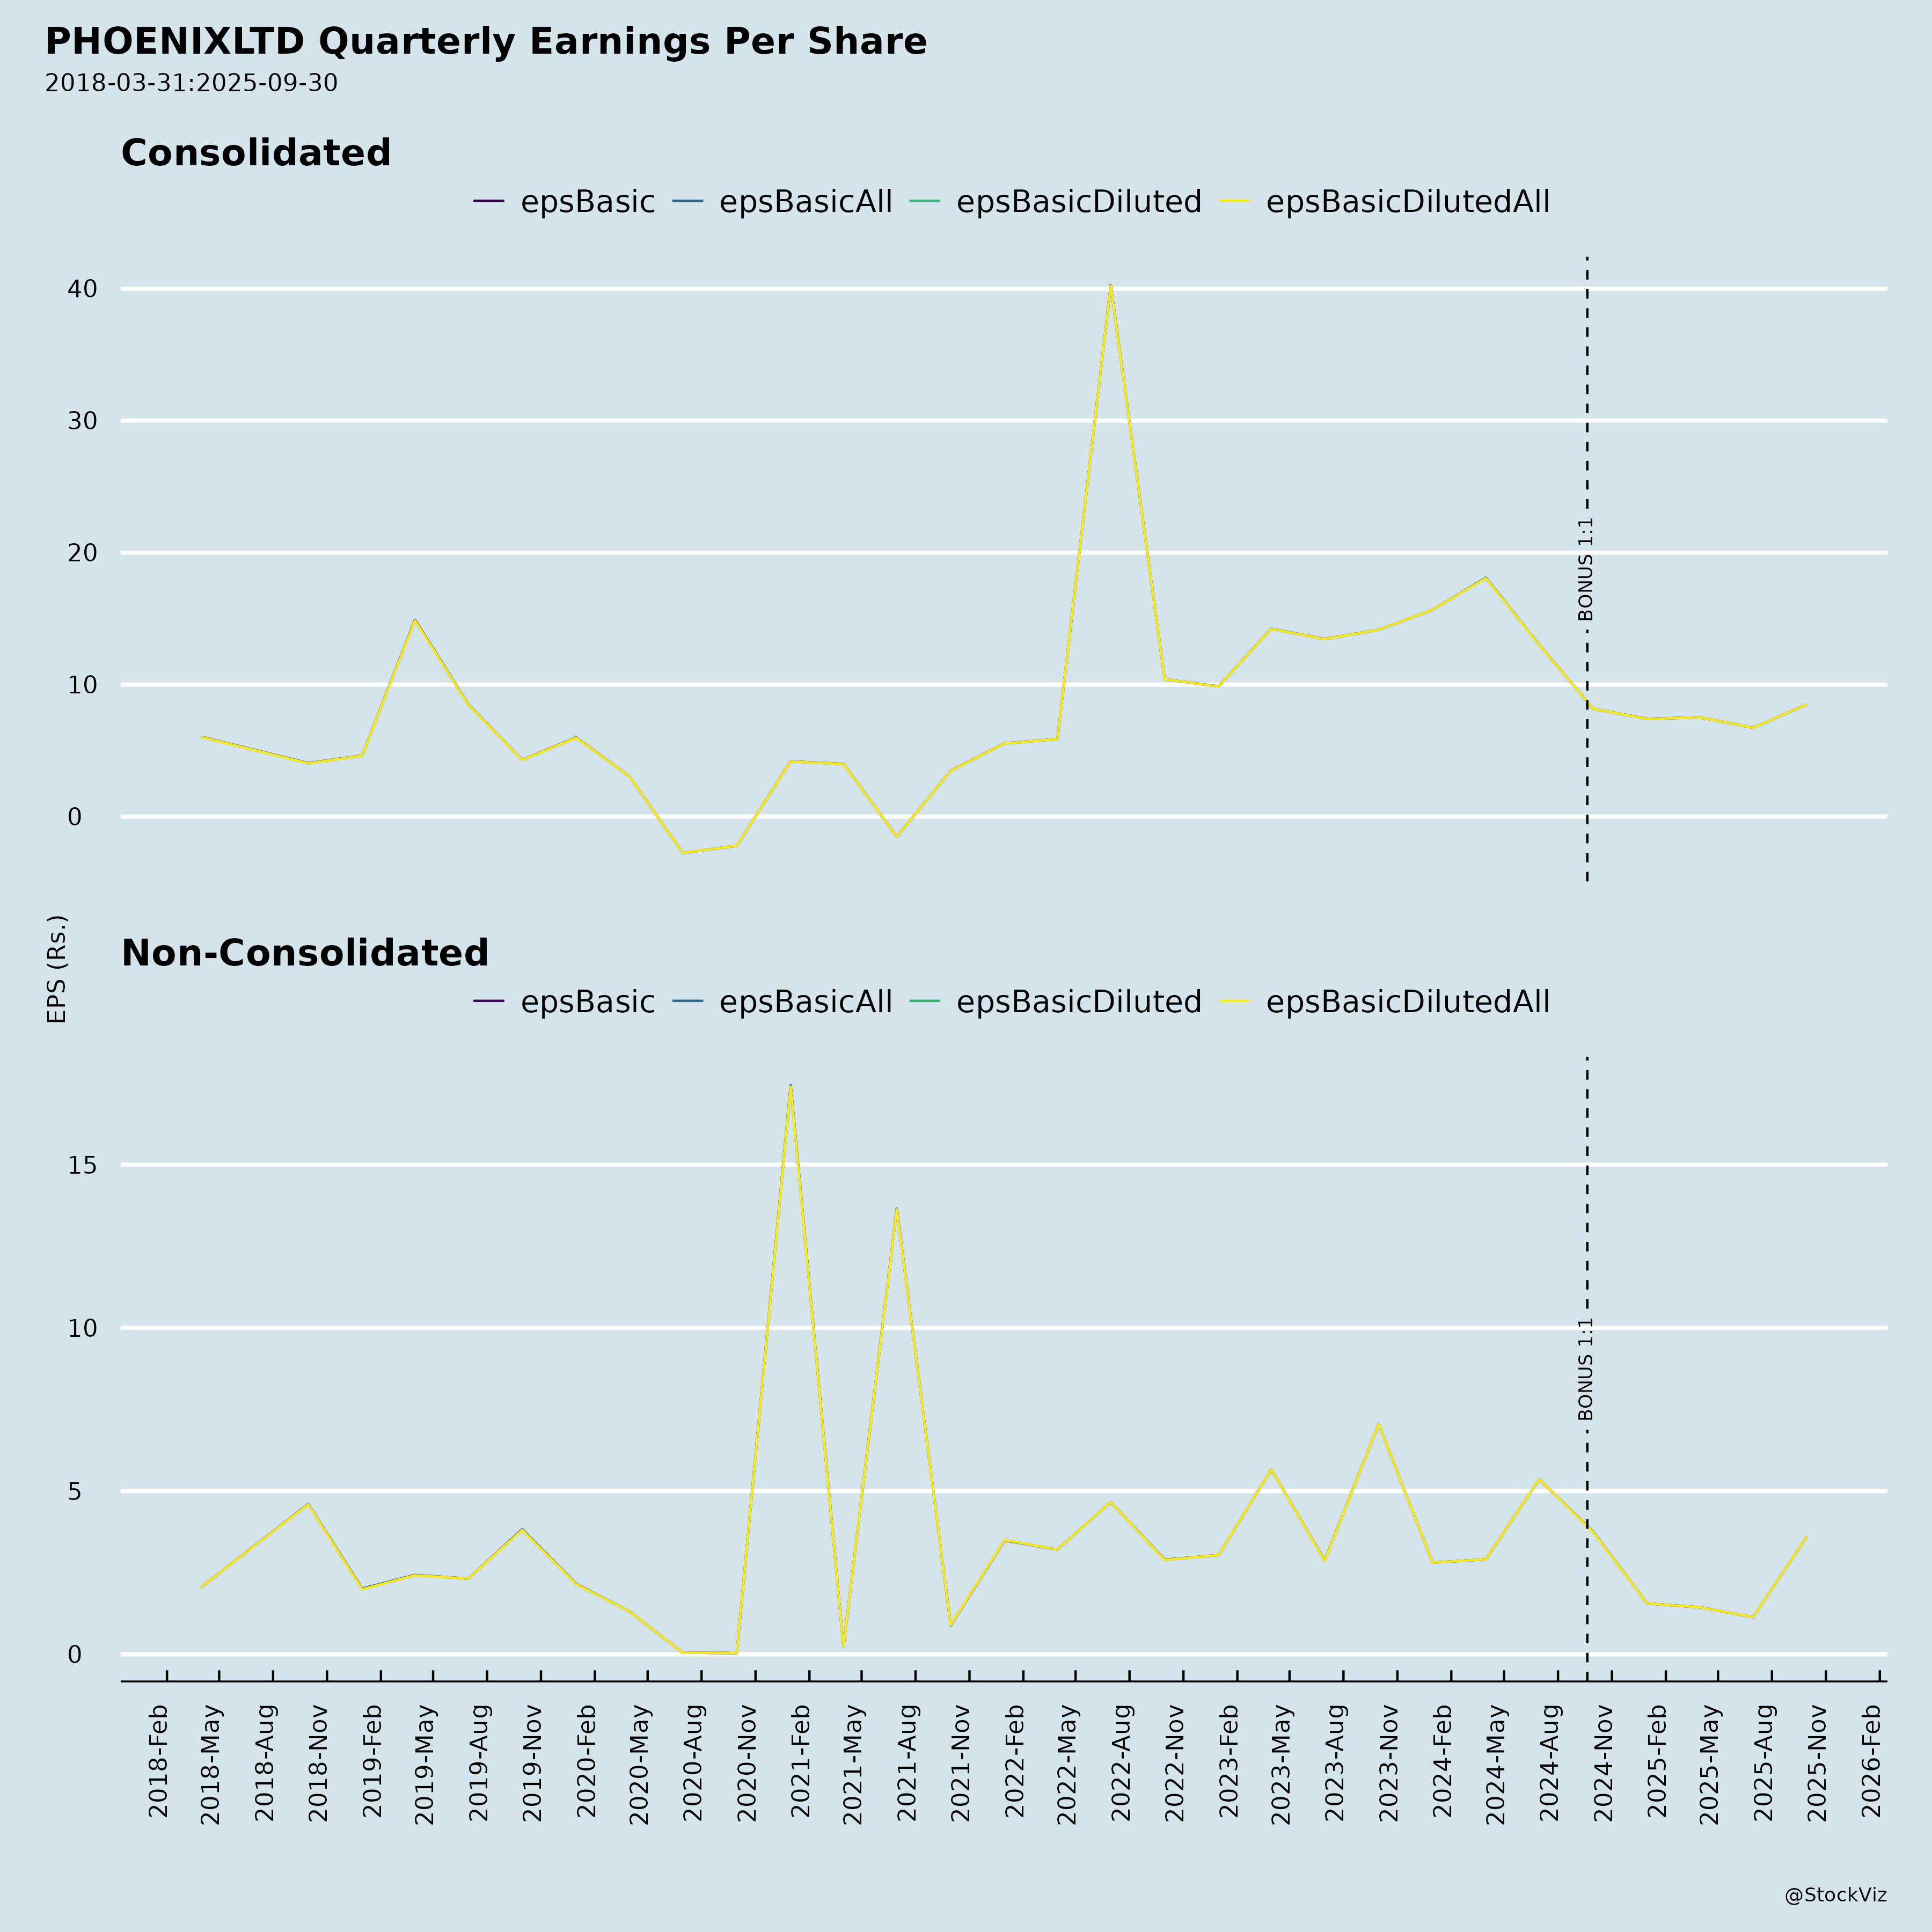
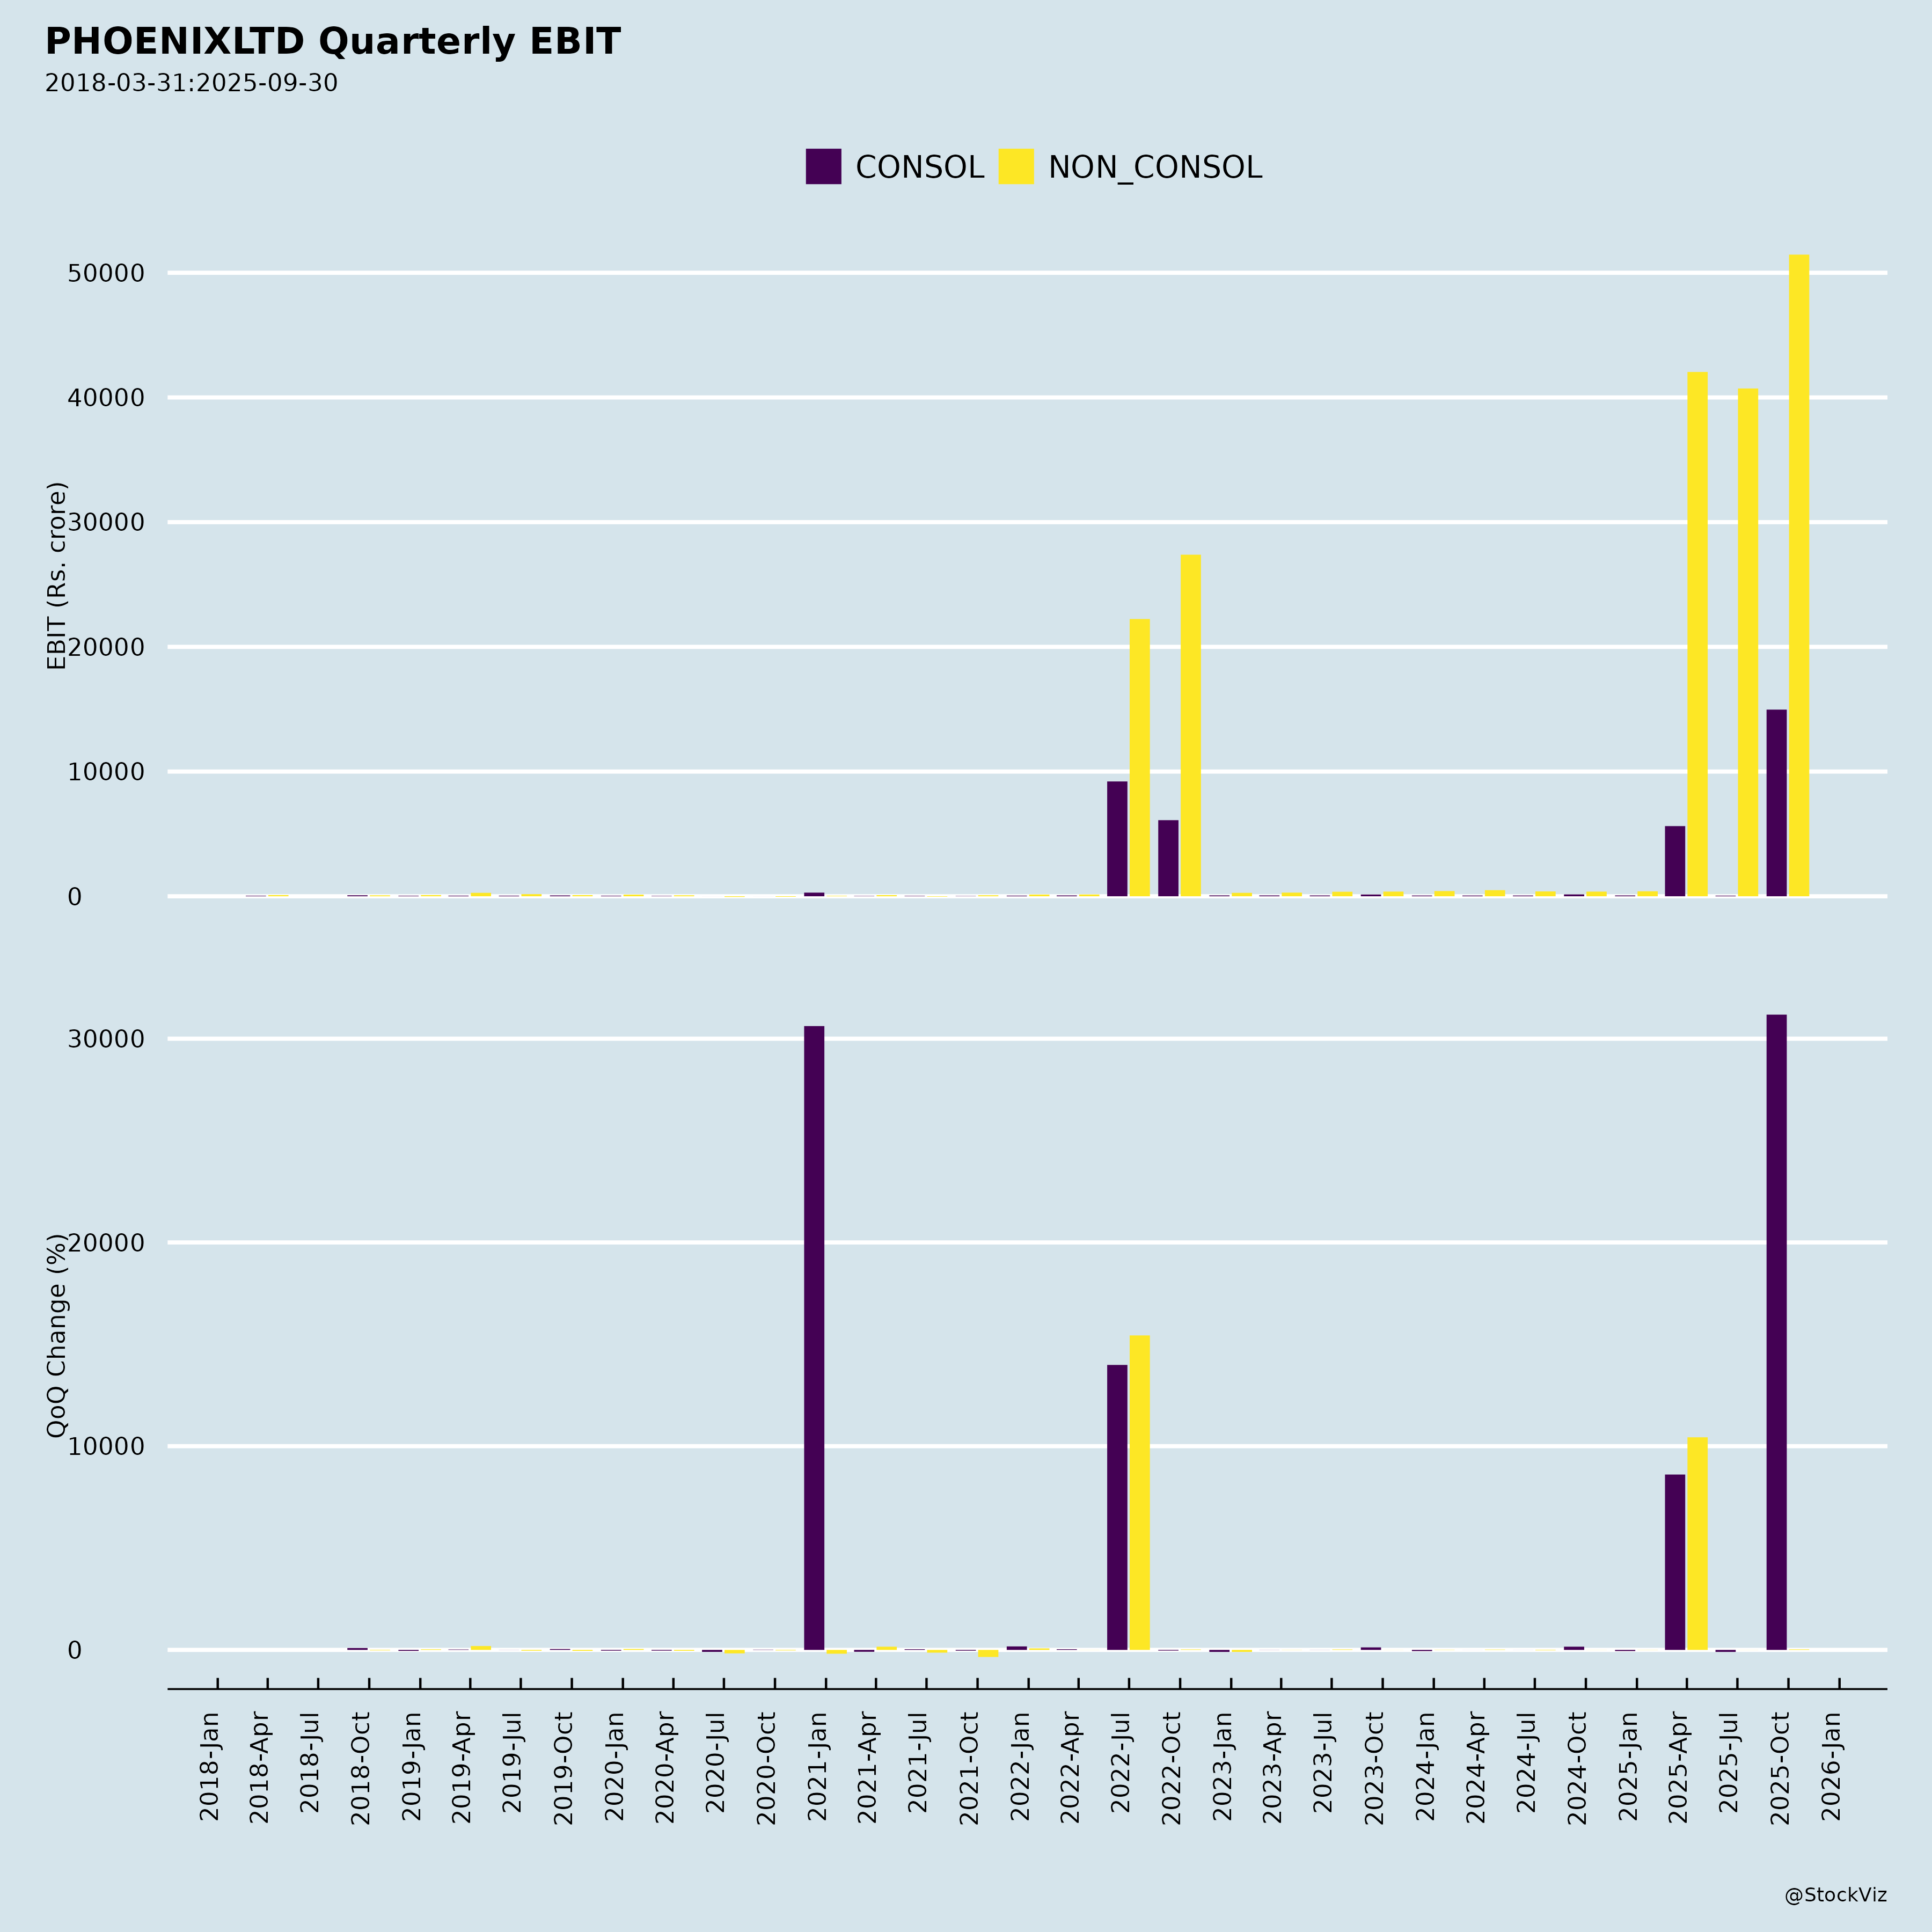
Fundamentals

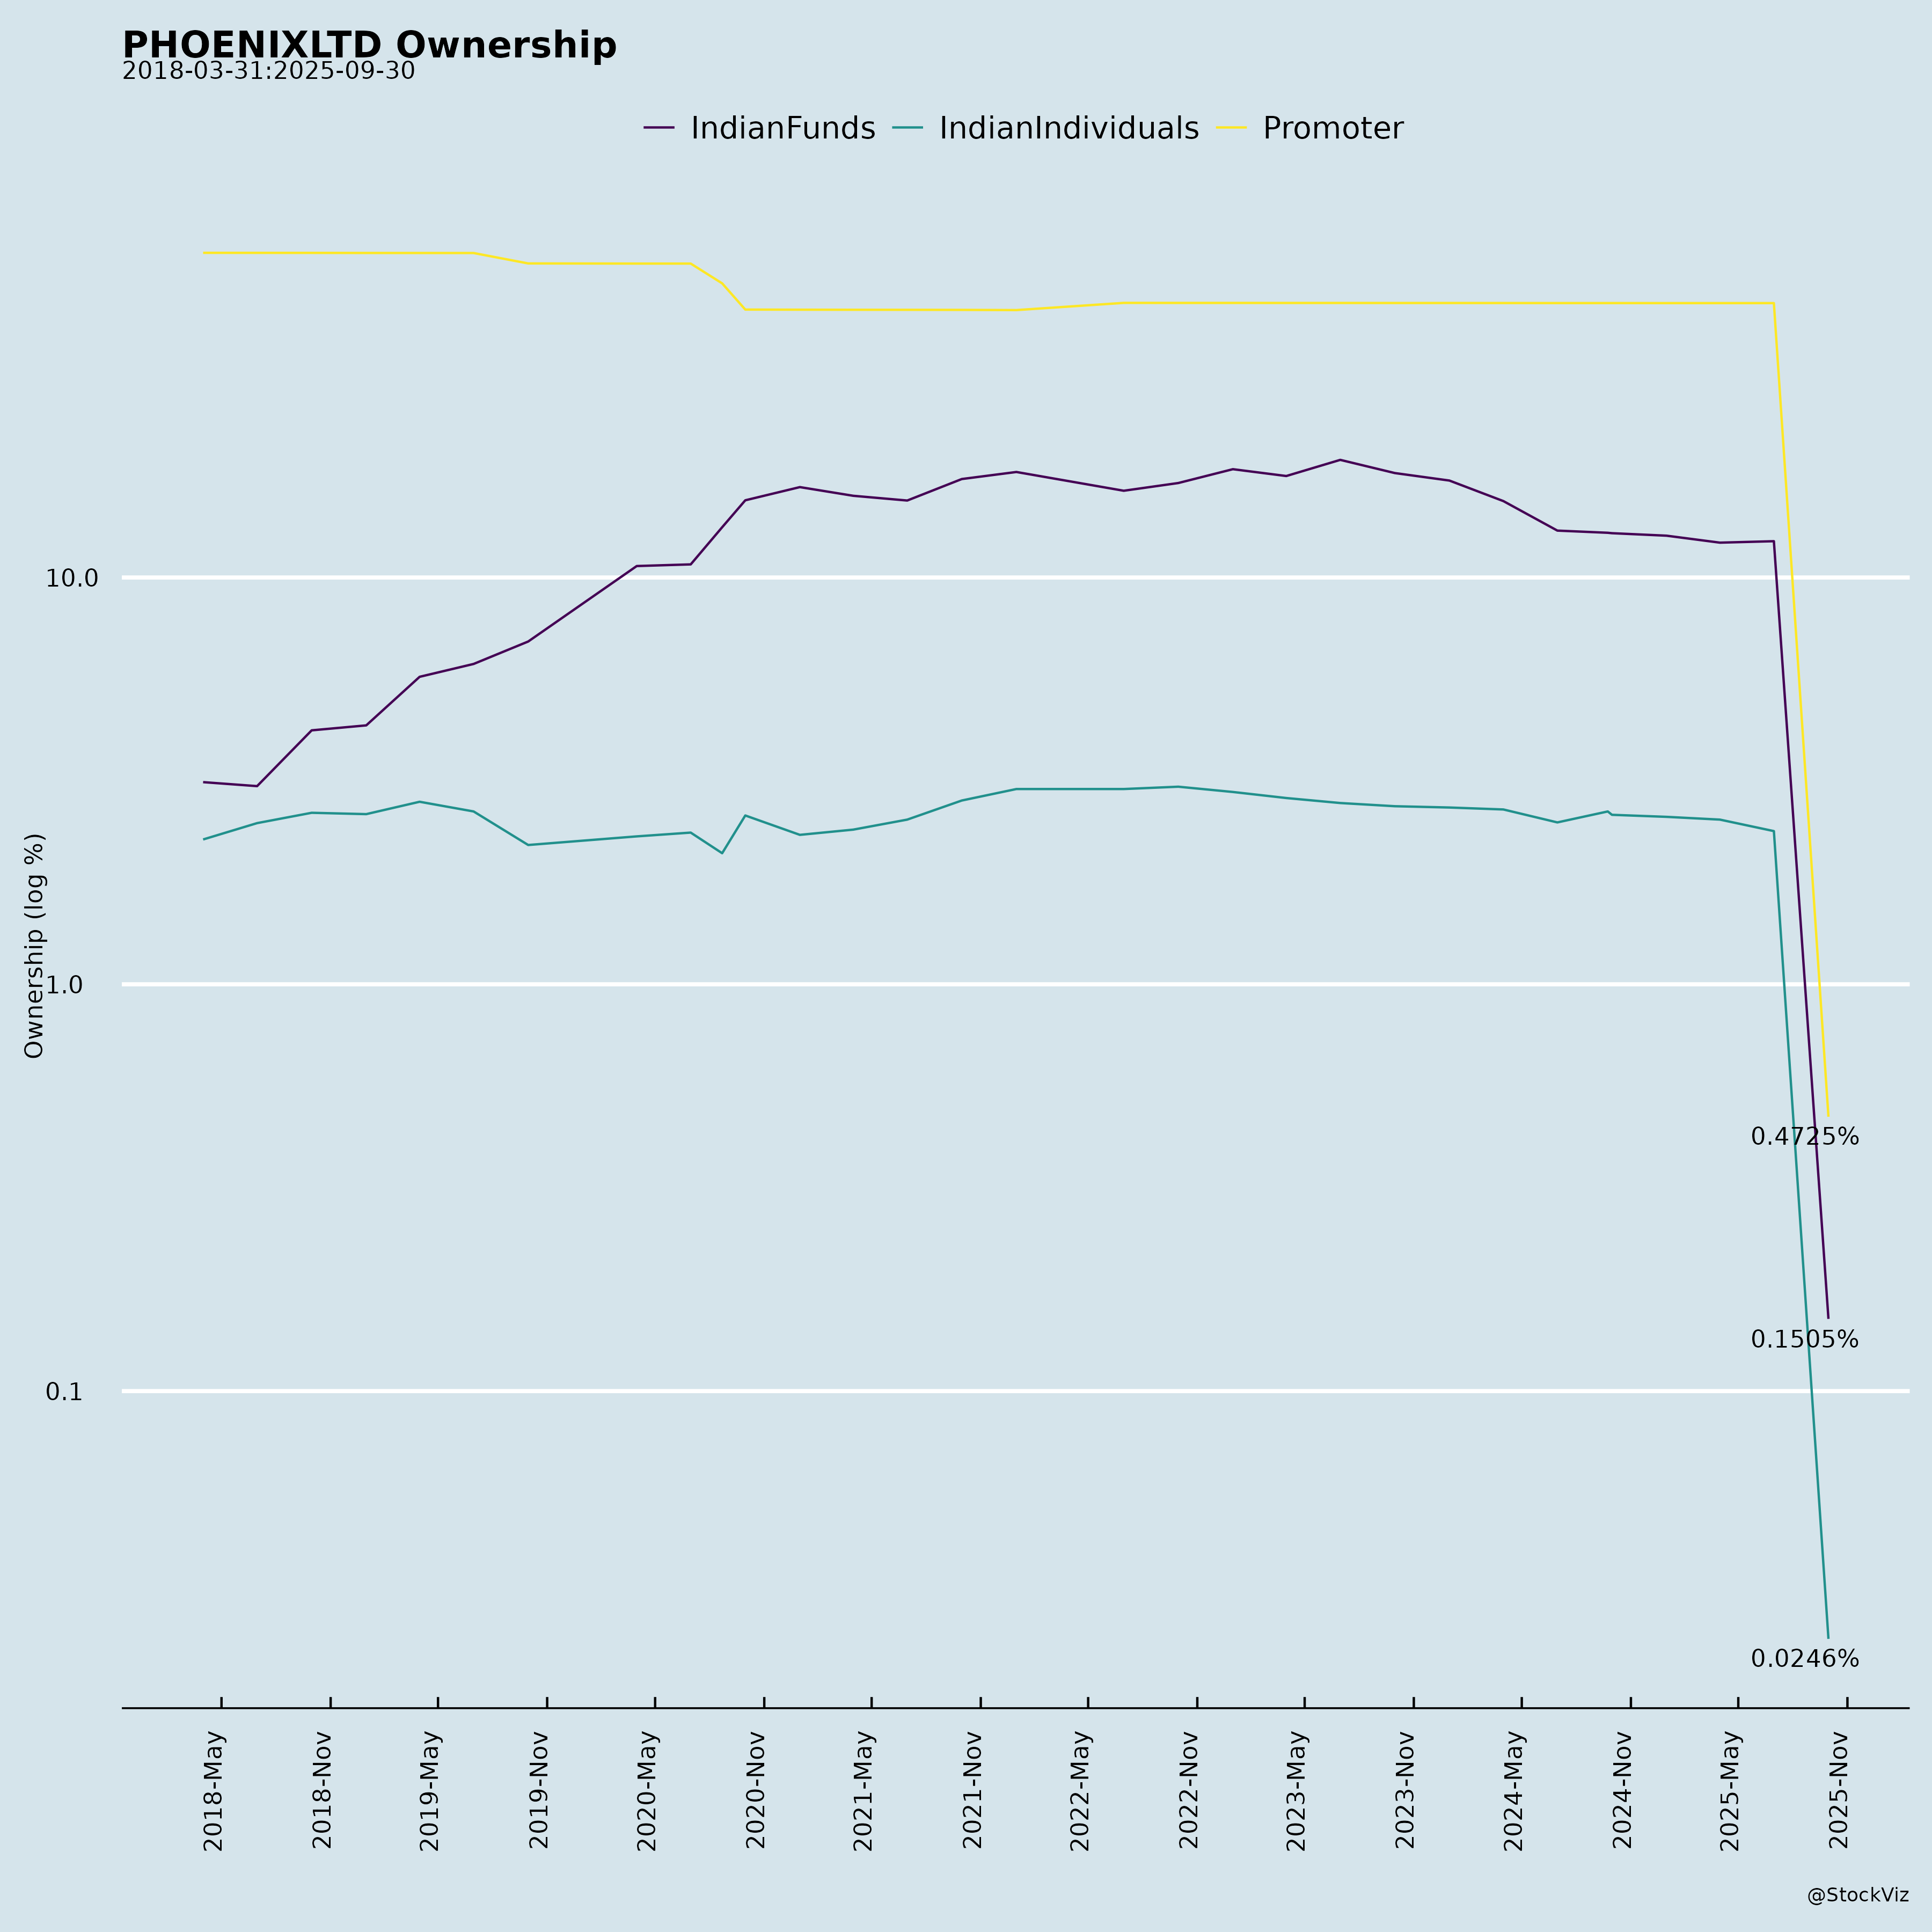
Ownership
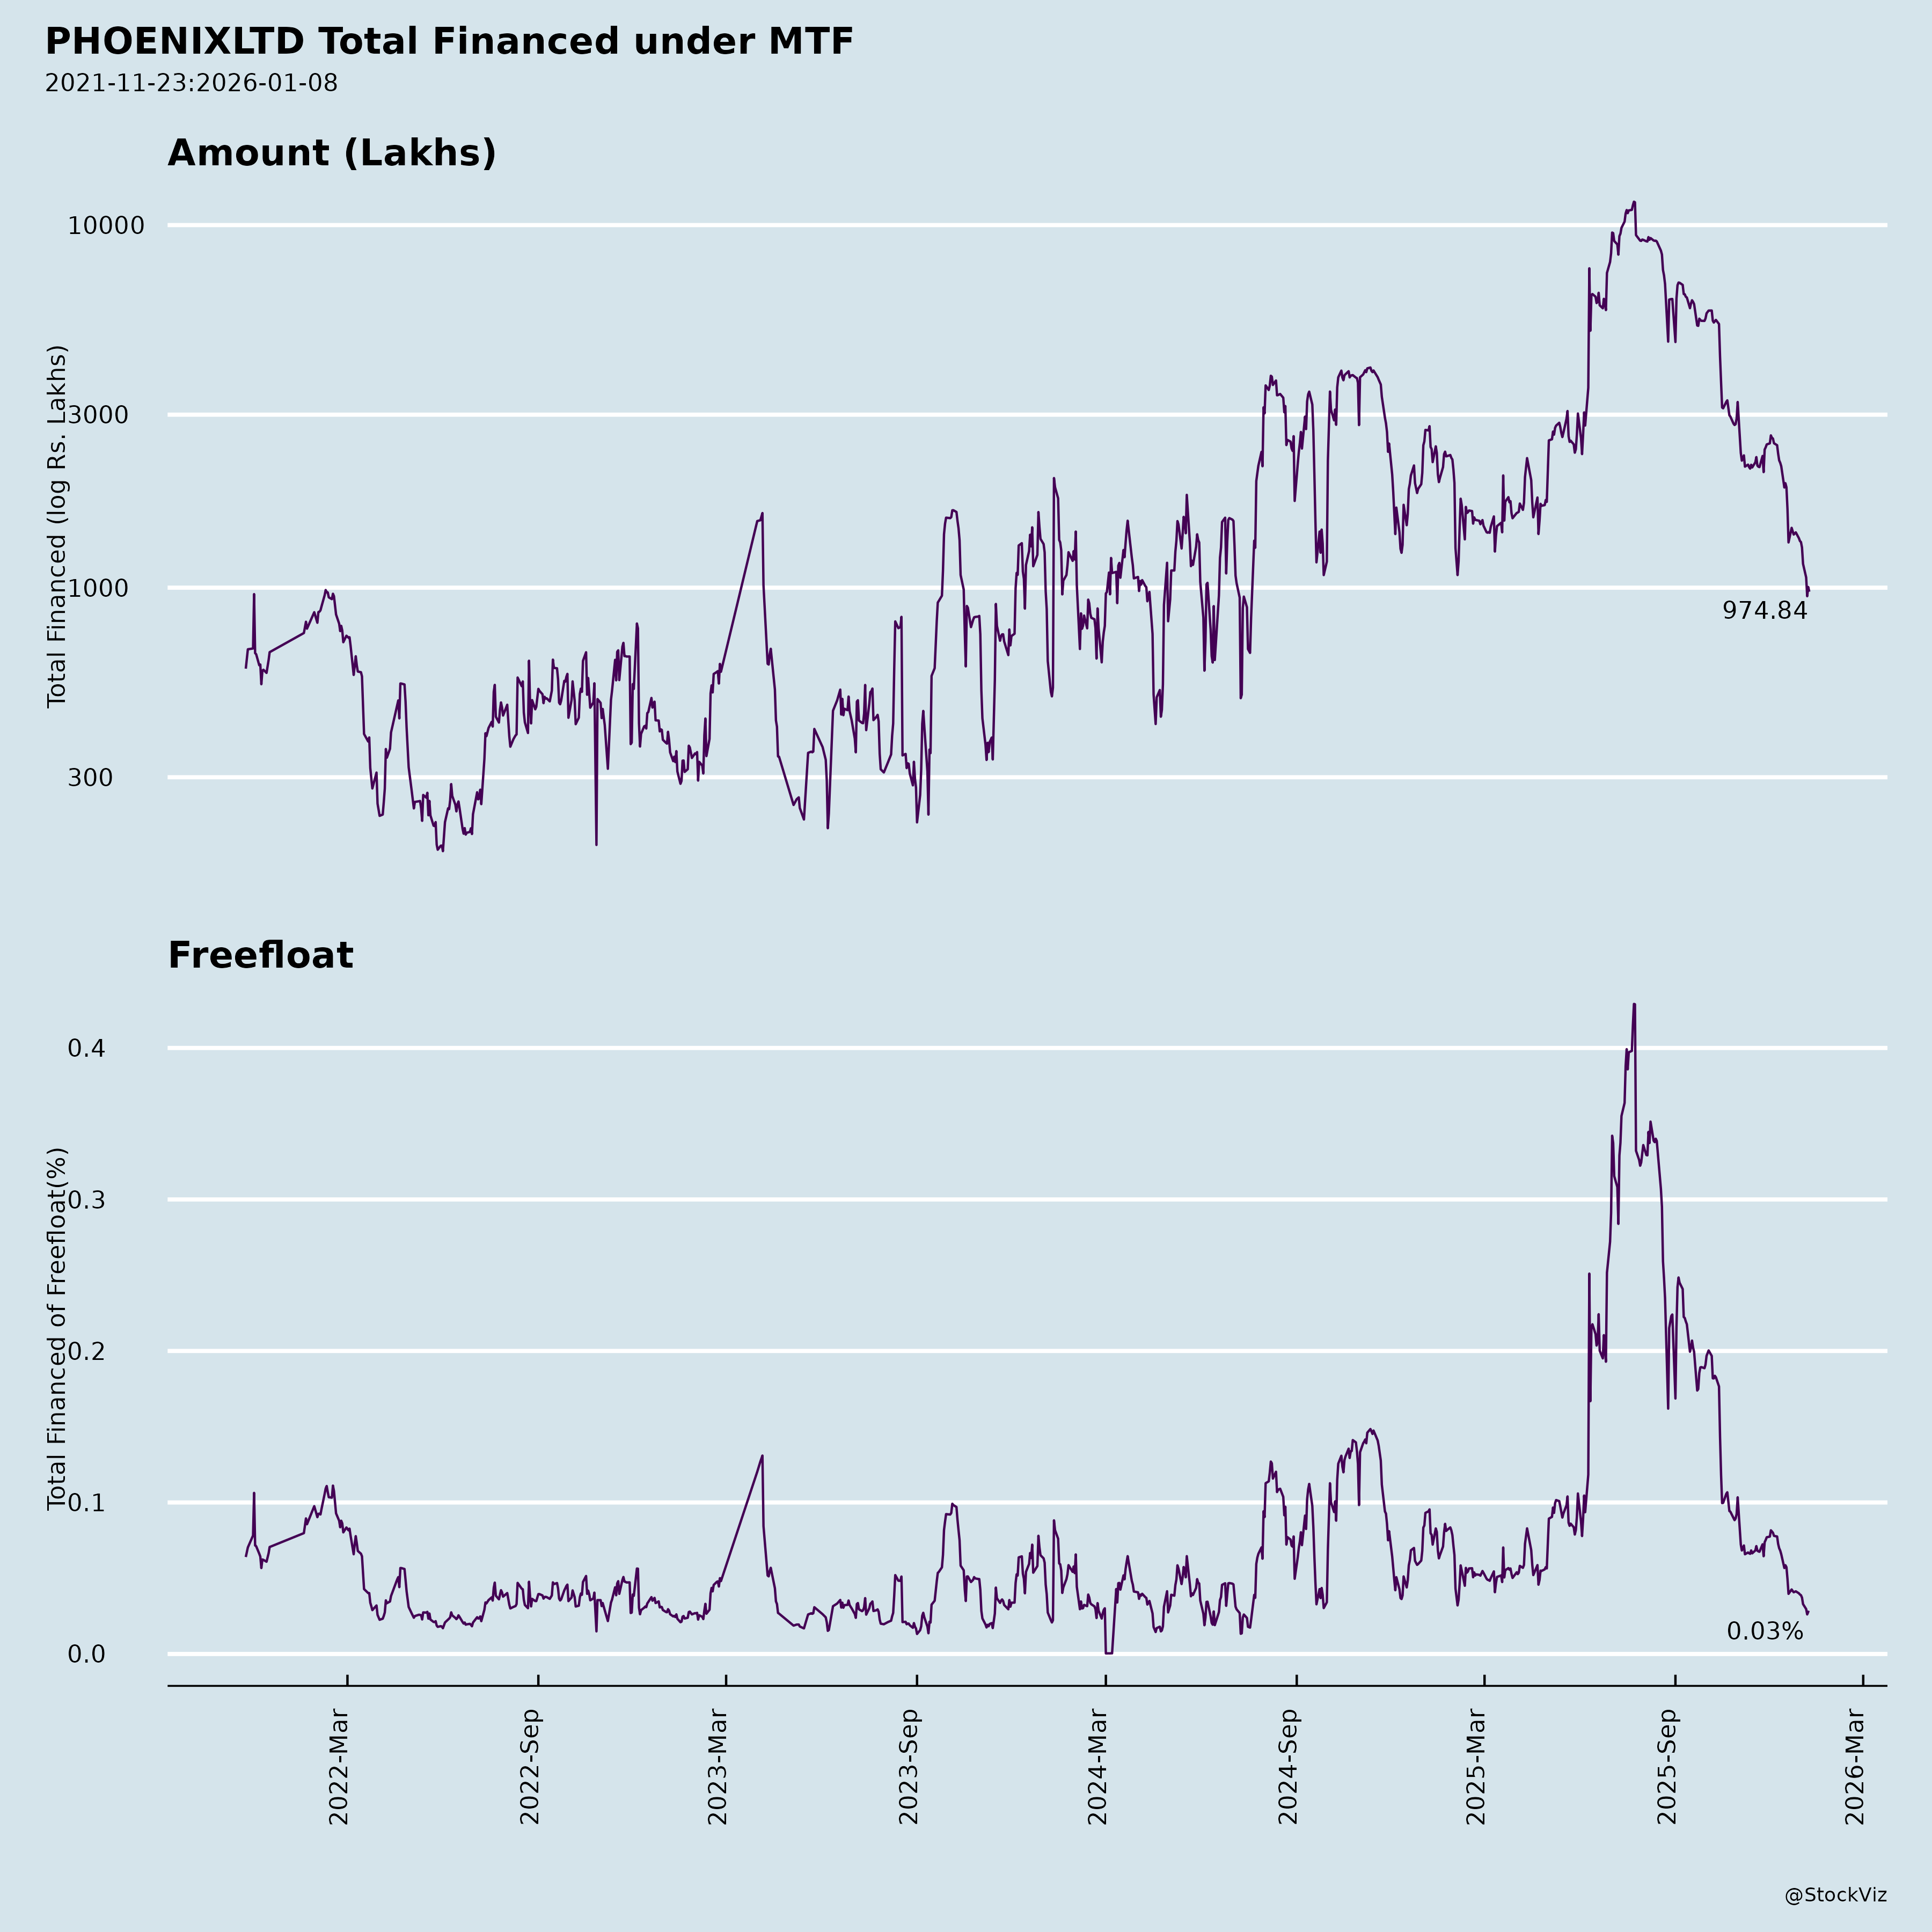
Margined
AI Summary
asof: 2026-09-16
PHOENIXLTD — Recent Corporate Announcements: Summary
1. Headwinds and Challenges
Residential segment drag. The residential and “others” line contracted sharply in Q1 FY27. Revenue from Residential & Others fell 42% year on year (to Rs. 42 cr from Rs. 72 cr), and EBITDA from Residential & Others turned negative at Rs. (8) cr versus Rs. 20 cr positive in Q1 FY26 — a swing of -137%. On a segment basis, the Residential Business reported a loss before tax and interest of Rs. (1,190.52) lakhs in Q1 FY27, against a profit of Rs. 1,845.40 lakhs in Q1 FY26. This reflects the lumpy, project-completion-linked nature of residential revenue recognition.
Hotel performance divergence. While The St. Regis, Mumbai posted 19% total income growth and 20% operating EBITDA growth with margins steady at 45%, Courtyard by Marriott, Agra was weaker: total income up only 5%, operating EBITDA down 22%, and EBITDA margin down 4 pps to 11%. F&B and banquet revenue at Agra declined 5%.
Office ramp-up costs. The three offices completed during 2025 (Phoenix Asia Towers, Millennium Towers, One National Park) are still in lease-up. Phoenix Asia Towers was only 40% leased and Millennium Towers 79% as of June 2026. These new assets contributed Rs. 15 cr of income but only breakeven EBITDA (Rs. 0 cr, versus Rs. (3) cr in Q1 FY26), with Phoenix Asia Towers and Millennium Towers individually posting negative EBITDA. The Centrium, Mumbai saw income fall 21% and EBITDA fall 71%.
Occupancy softness at select malls. Phoenix Palassio Lucknow saw leased occupancy fall to 96% from 99% and trading occupancy to 93% from 96%. Phoenix Citadel Indore saw leased occupancy decline to 90% from 92% and trading occupancy to 88% from 91%. Phoenix United Lucknow’s rental rate declined 6%.
Rising debt. Gross debt rose to Rs. 5,658 cr as of 30 June 2026, up Rs. 494 cr versus March 2026, and net debt rose Rs. 498 cr to Rs. 3,658 cr. Net Debt/EBITDA ticked up to 1.3x from 1.2x. Under-development asset debt rose sharply to Rs. 936 cr from Rs. 338 cr, driven largely by the Chandigarh retail development (Rs. 519 cr).
Going-concern and impairment matters. The consolidated results include Savannah Phoenix Private Limited, a wholly owned subsidiary whose financial statements were not prepared on a going concern basis, with assets and liabilities recognized at realizable/expected settlement values (auditor’s Emphasis of Matter). The prior financial year included exceptional losses: Rs. 2,948.97 lakhs standalone (impairment of investments in subsidiaries/associate) and Rs. 2,898.21 lakhs consolidated (impairment of goodwill from past acquisitions). Q1 FY27 also carried accelerated depreciation of Rs. 462.48 lakhs on a mall building portion proposed for demolition and redevelopment.
Hypermarket space optimization. The presentation notes focused initiatives to optimize hypermarket space across the portfolio, with Gourmet & Hypermarket contributing only 2% of consumption and growing just 7% — the slowest category.
2. Tailwinds and Growth Prospects
Strong consolidated operating momentum. Q1 FY27 consolidated revenue was Rs. 1,075 cr (up 13% YoY), EBITDA Rs. 642 cr (up 14%), net profit Rs. 297 cr (up 23%), and operating free cash flow Rs. 602 cr (up 20%). Double-digit revenue growth was achieved without adding new mall capacity in the quarter.
Retail consumption and rental growth. Q1 FY27 consumption was Rs. 4,730 cr, up 32% YoY, with growth across all malls. Retail rental income rose 17% to Rs. 594 cr and retail asset EBITDA rose 17% to Rs. 625 cr. Growth spanned categories: Electronics +61%, Jewellery +55%, Others +31%, F&B +26%, Fashion & Accessories +24%, FEC & Multiplex +19%.
Repositioning and re-leasing. Phoenix MarketCity Pune was rebranded Phoenix Avenue of Stars, Pune, with a premium brand mix (UNIQLO, IKEA, BOSS, Michael Kors, Coach, Victoria’s Secret, etc.). Trading density there rose 26% and rental income 13%. Phoenix Mall of Asia, Bengaluru was the standout: rental income +47%, asset EBITDA +56%, consumption +96%, trading density +72%, with trading occupancy at 95% and leased occupancy 98%.
Embedded growth levers. Management cites rental uplift on rechurned space, contractual lease expiries unlocking repricing with zero new capex, luxury/star brand additions (e.g., Phoenix Mall of Asia upper ground at Rs. 550 pspm++ versus mall average of Rs. 196 pspm), office portfolio ramp-up, campus densification (Lower Parel adding 1.6 msft offices + 0.5 msft retail by FY27; PMC-B growing from ~1 msft to 4+ msft), and infrastructure-led catchment uplift at zero cost.
ISMDPL acquisition. PML is consolidating 100% ownership of Island Star Mall Developers (4.4 msft operational retail + 2.2 msft completed offices) via a structured buyout of CPP Investments’ 49% stake for ~Rs. 5,449 cr, payable over 36 months in four tranches (Tranche 1 completed Nov-25), funded substantially from surplus cash, internal accruals, and incremental debt at ISMDPL. Described as PAT-accretive and self-funded.
Development pipeline. Thane (~1.30 msft retail, all approvals secured, excavation to commence soon), Coimbatore (~1 msft, excavation commenced), Chandigarh (~1.70 msft, excavation commenced), and Bangalore Phase 3 expansion (approvals secured, civil contracts awarded). Portfolio targets by 2030: >18 msft retail, ~9 msft offices, ~2,188 hotel keys, ~7 msft residential.
Residential cash engine. Q1 FY27 gross sales of Rs. 64 cr, collections Rs. 51 cr, average sales price ~Rs. 36,000 psf, with ~0.15 msft constructed and ready-to-sell inventory and ~1.81 msft total inventory across Bengaluru and Kolkata.
Balance sheet strength. Liquidity of Rs. 2,000 cr as of 30 June 2026, cost of debt at 7.69% (244 bps spread over repo), and Net Debt/EBITDA at 1.3x.
3. Key Risks
- Execution and approval risk on the development pipeline. The presentation notes that areas for Phase 2/3 expansion and balance FSI potential are “subject to planning and regulatory approvals and payment of premiums, charges etc.”
- Lease-up risk in new offices. The 2025-completed offices are only 64% leased in aggregate, with Phoenix Asia Towers at 40%; failure to ramp occupancy would delay the expected EBITDA contribution.
- Residential earnings volatility. The segment swung to a loss in Q1 FY27, and revenue recognition depends on project completion and monetisation.
- Leverage and funding risk. Gross debt is rising, including at under-development assets, and the ISMDPL buyout relies partly on incremental debt and internal accruals.
- Asset-specific operational risk. Occupancy declines at Palassio Lucknow and Citadel Indore, and weak hotel performance at Agra, illustrate variability across the portfolio.
- Going-concern and impairment risk. The Savannah Phoenix subsidiary is not prepared on a going-concern basis, and prior-year goodwill/investment impairments indicate valuation risk in past acquisitions.
- Demolition/redevelopment disruption. Accelerated depreciation on a mall building portion proposed for demolition and redevelopment signals near-term disruption at that asset.
4. Management Guidance Versus Observed Business Performance
Guidance/forward-looking elements in the material: - Portfolio targets by 2030: >18 msft retail GLA, ~9 msft offices, ~2,188 hotel keys, ~7 msft cumulative residential saleable area. - Interim milestones: retail >14 msft by 2027; offices ~7 msft by 2027; hotels ~988 keys by 2027; residential ~4.5 msft by 2027. - ISMDPL consideration of ~Rs. 5,449 cr to be paid over 36 months in four tranches. - Development timelines: Thane excavation to commence soon; Coimbatore and Chandigarh excavation commenced; Bangalore Phase 3 civil contracts awarded. - Lower Parel adding 1.6 msft offices + 0.5 msft retail by FY27; PMC-B growing from ~1 msft to 4+ msft. - Trading occupancy across repositioned malls “inching back to 95%.”
Observed performance against these: - The 2030 retail target of >18 msft compares with ~11 msft operational across 12 malls in 8 cities, implying substantial delivery ahead. - The 2027 office target of ~7 msft compares with ~5 msft operational, with the 2025 completions (2.88 msft) still at 64% leased — the ramp-up is in progress but not yet complete. - The 2027 hotel target of ~988 keys compares with 2 operational hotels (~588 keys); Courtyard by Marriott, Agra’s Q1 FY27 EBITDA decline shows current hospitality performance is mixed. - The ISMDPL Tranche 1 was completed in Nov-25, consistent with the stated four-tranche structure. - Trading occupancy at Phoenix Mall of Asia reached 95% (leased 98%) and at Phoenix MarketCity Bangalore 88% (leased 99%), while Palassio Lucknow and Citadel Indore moved away from the 95% level, indicating uneven progress toward the stated target. - Q1 FY27 delivered double-digit consolidated revenue, EBITDA, and net profit growth without new mall capacity, consistent with the “embedded portfolio growth” thesis, though the residential segment’s negative contribution partially offset annuity business strength (annuity EBITDA +19% versus consolidated EBITDA +14%).
Broker Narrative
The broker narrative evolved from a residential real estate cycle view focused on interest rates, launches, and bookings to a consumption-led retail and commercial portfolio story. The persistent theme was robust demand and market share gains, but the risks shifted from supply-side concerns (moderate launches, weak bookings) to demand-side and execution risks (consumption slowdown, leasing, project delays). Optimism increasingly centered on the company’s aggressive portfolio scaling and rental income growth.
Broker Timeline
28 broker calls · 2023-06-01 to 2026-07-30
Copyright © 2023 SAS Data Analytics Pvt. Ltd. All rights reserved.