MOTILALOFS
Equity Metrics
September 24, 2026
Motilal Oswal Financial Services Limited
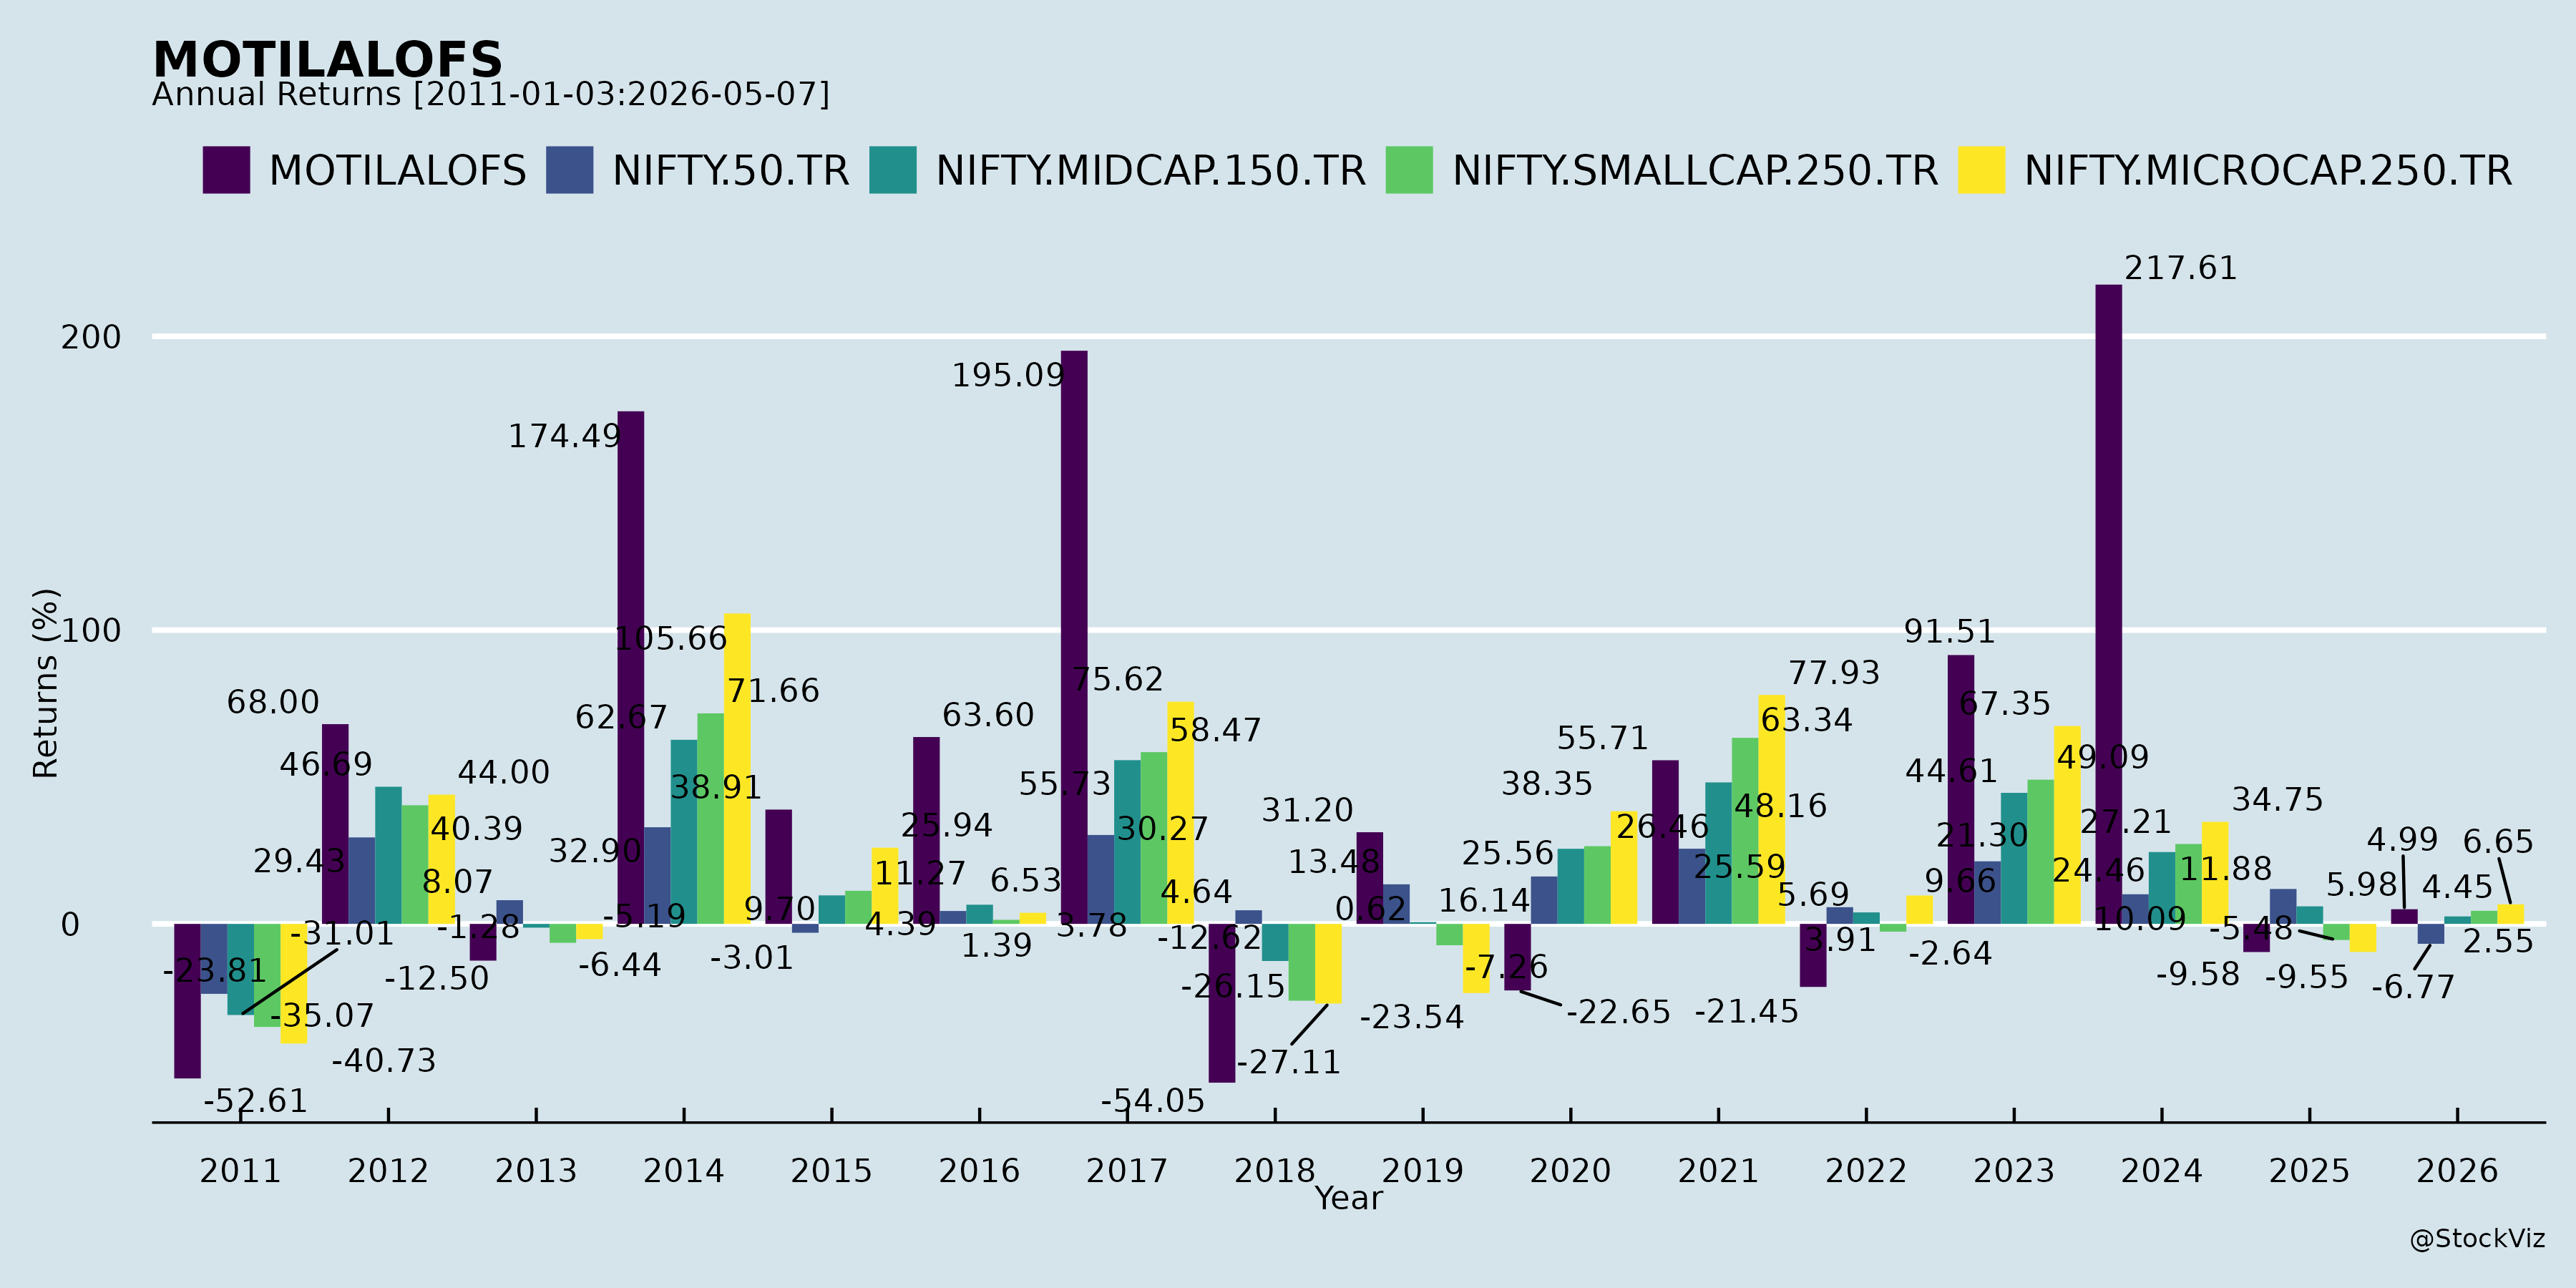
Annual Returns
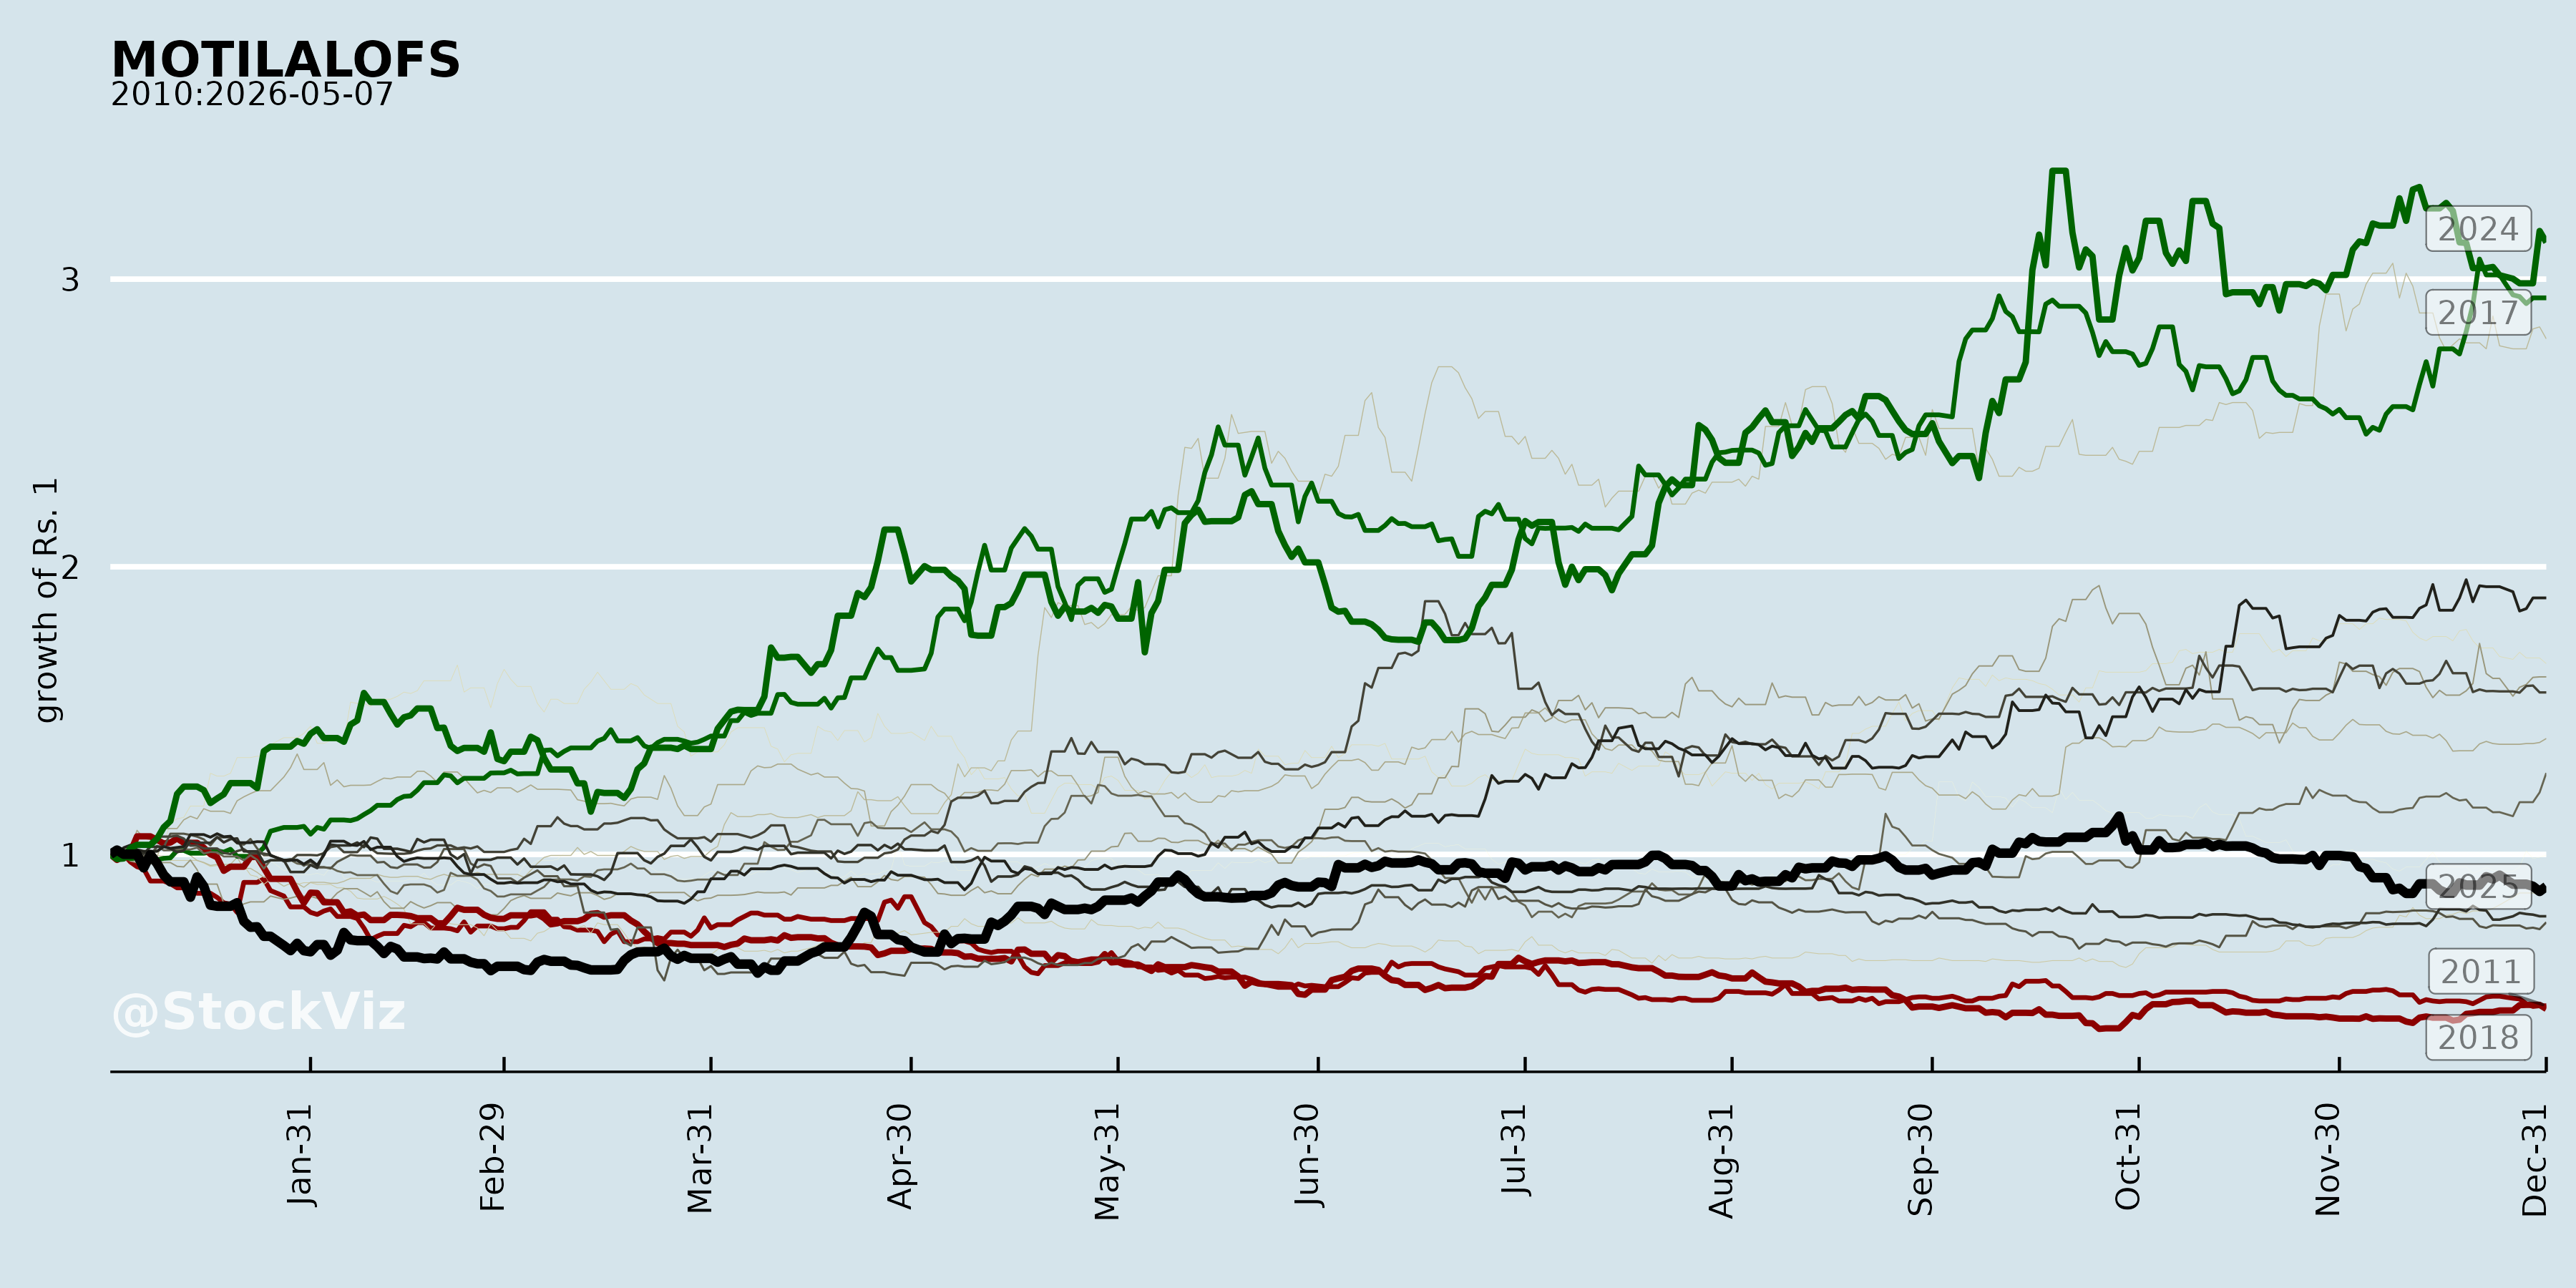
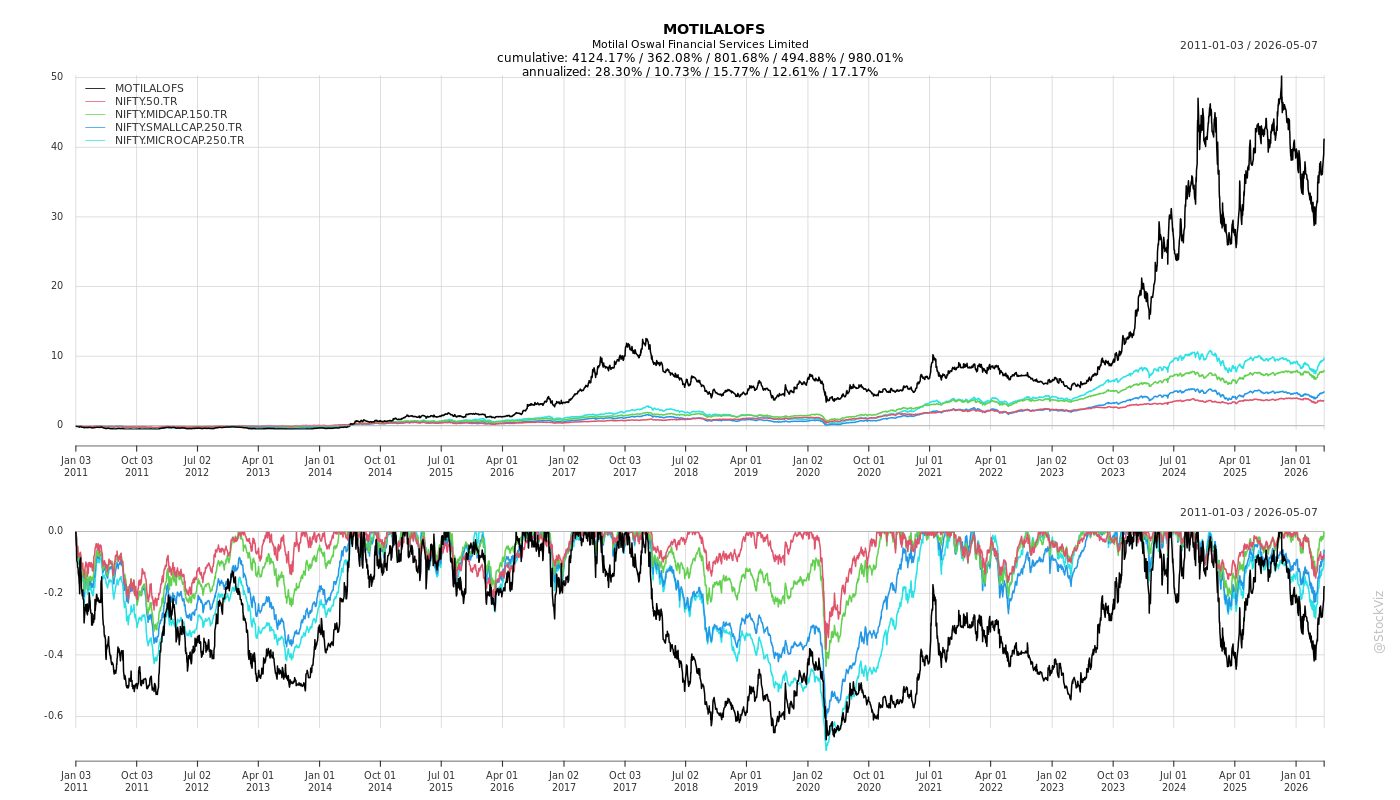
Cumulative Returns and Drawdowns
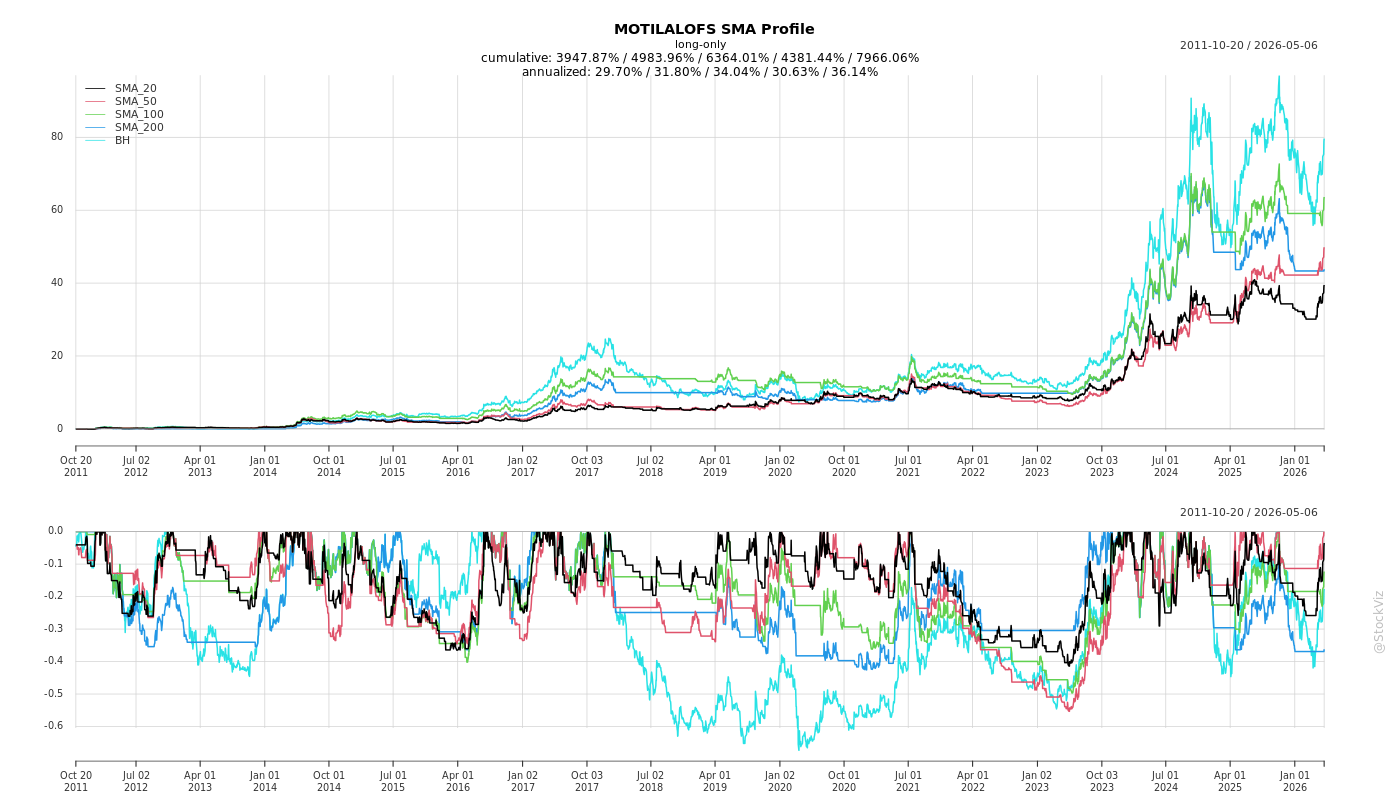
Fundamentals
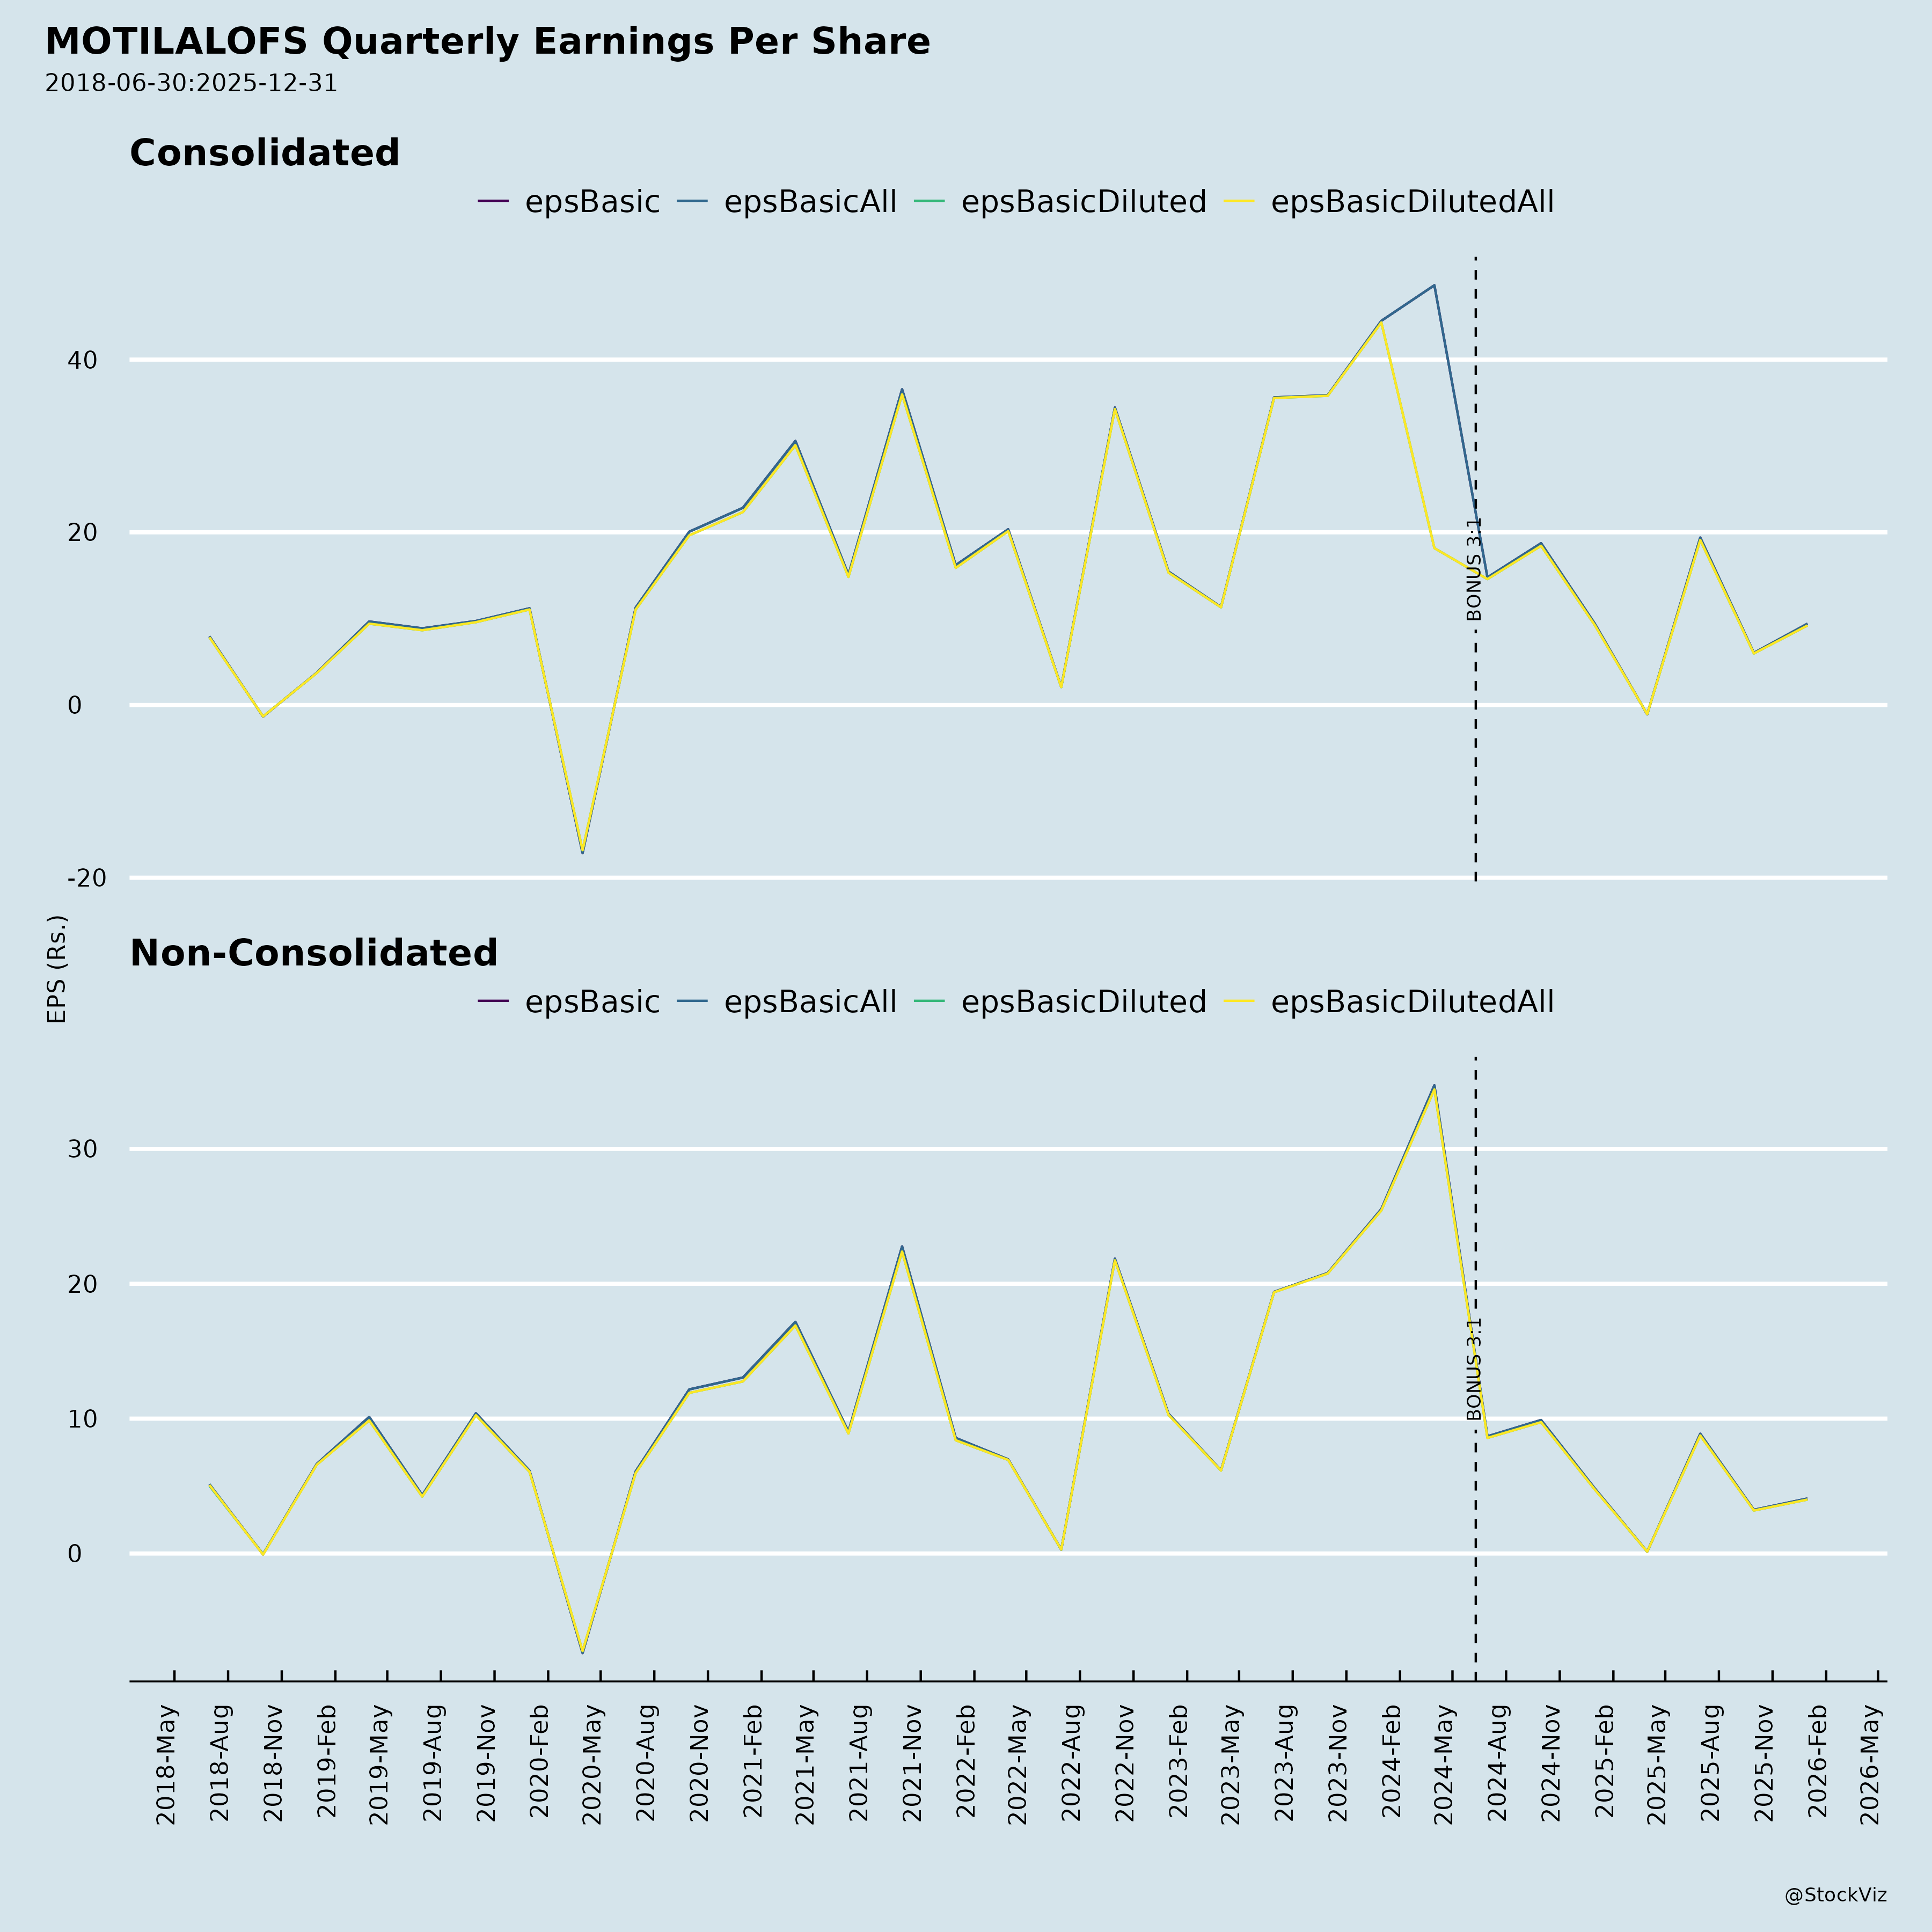
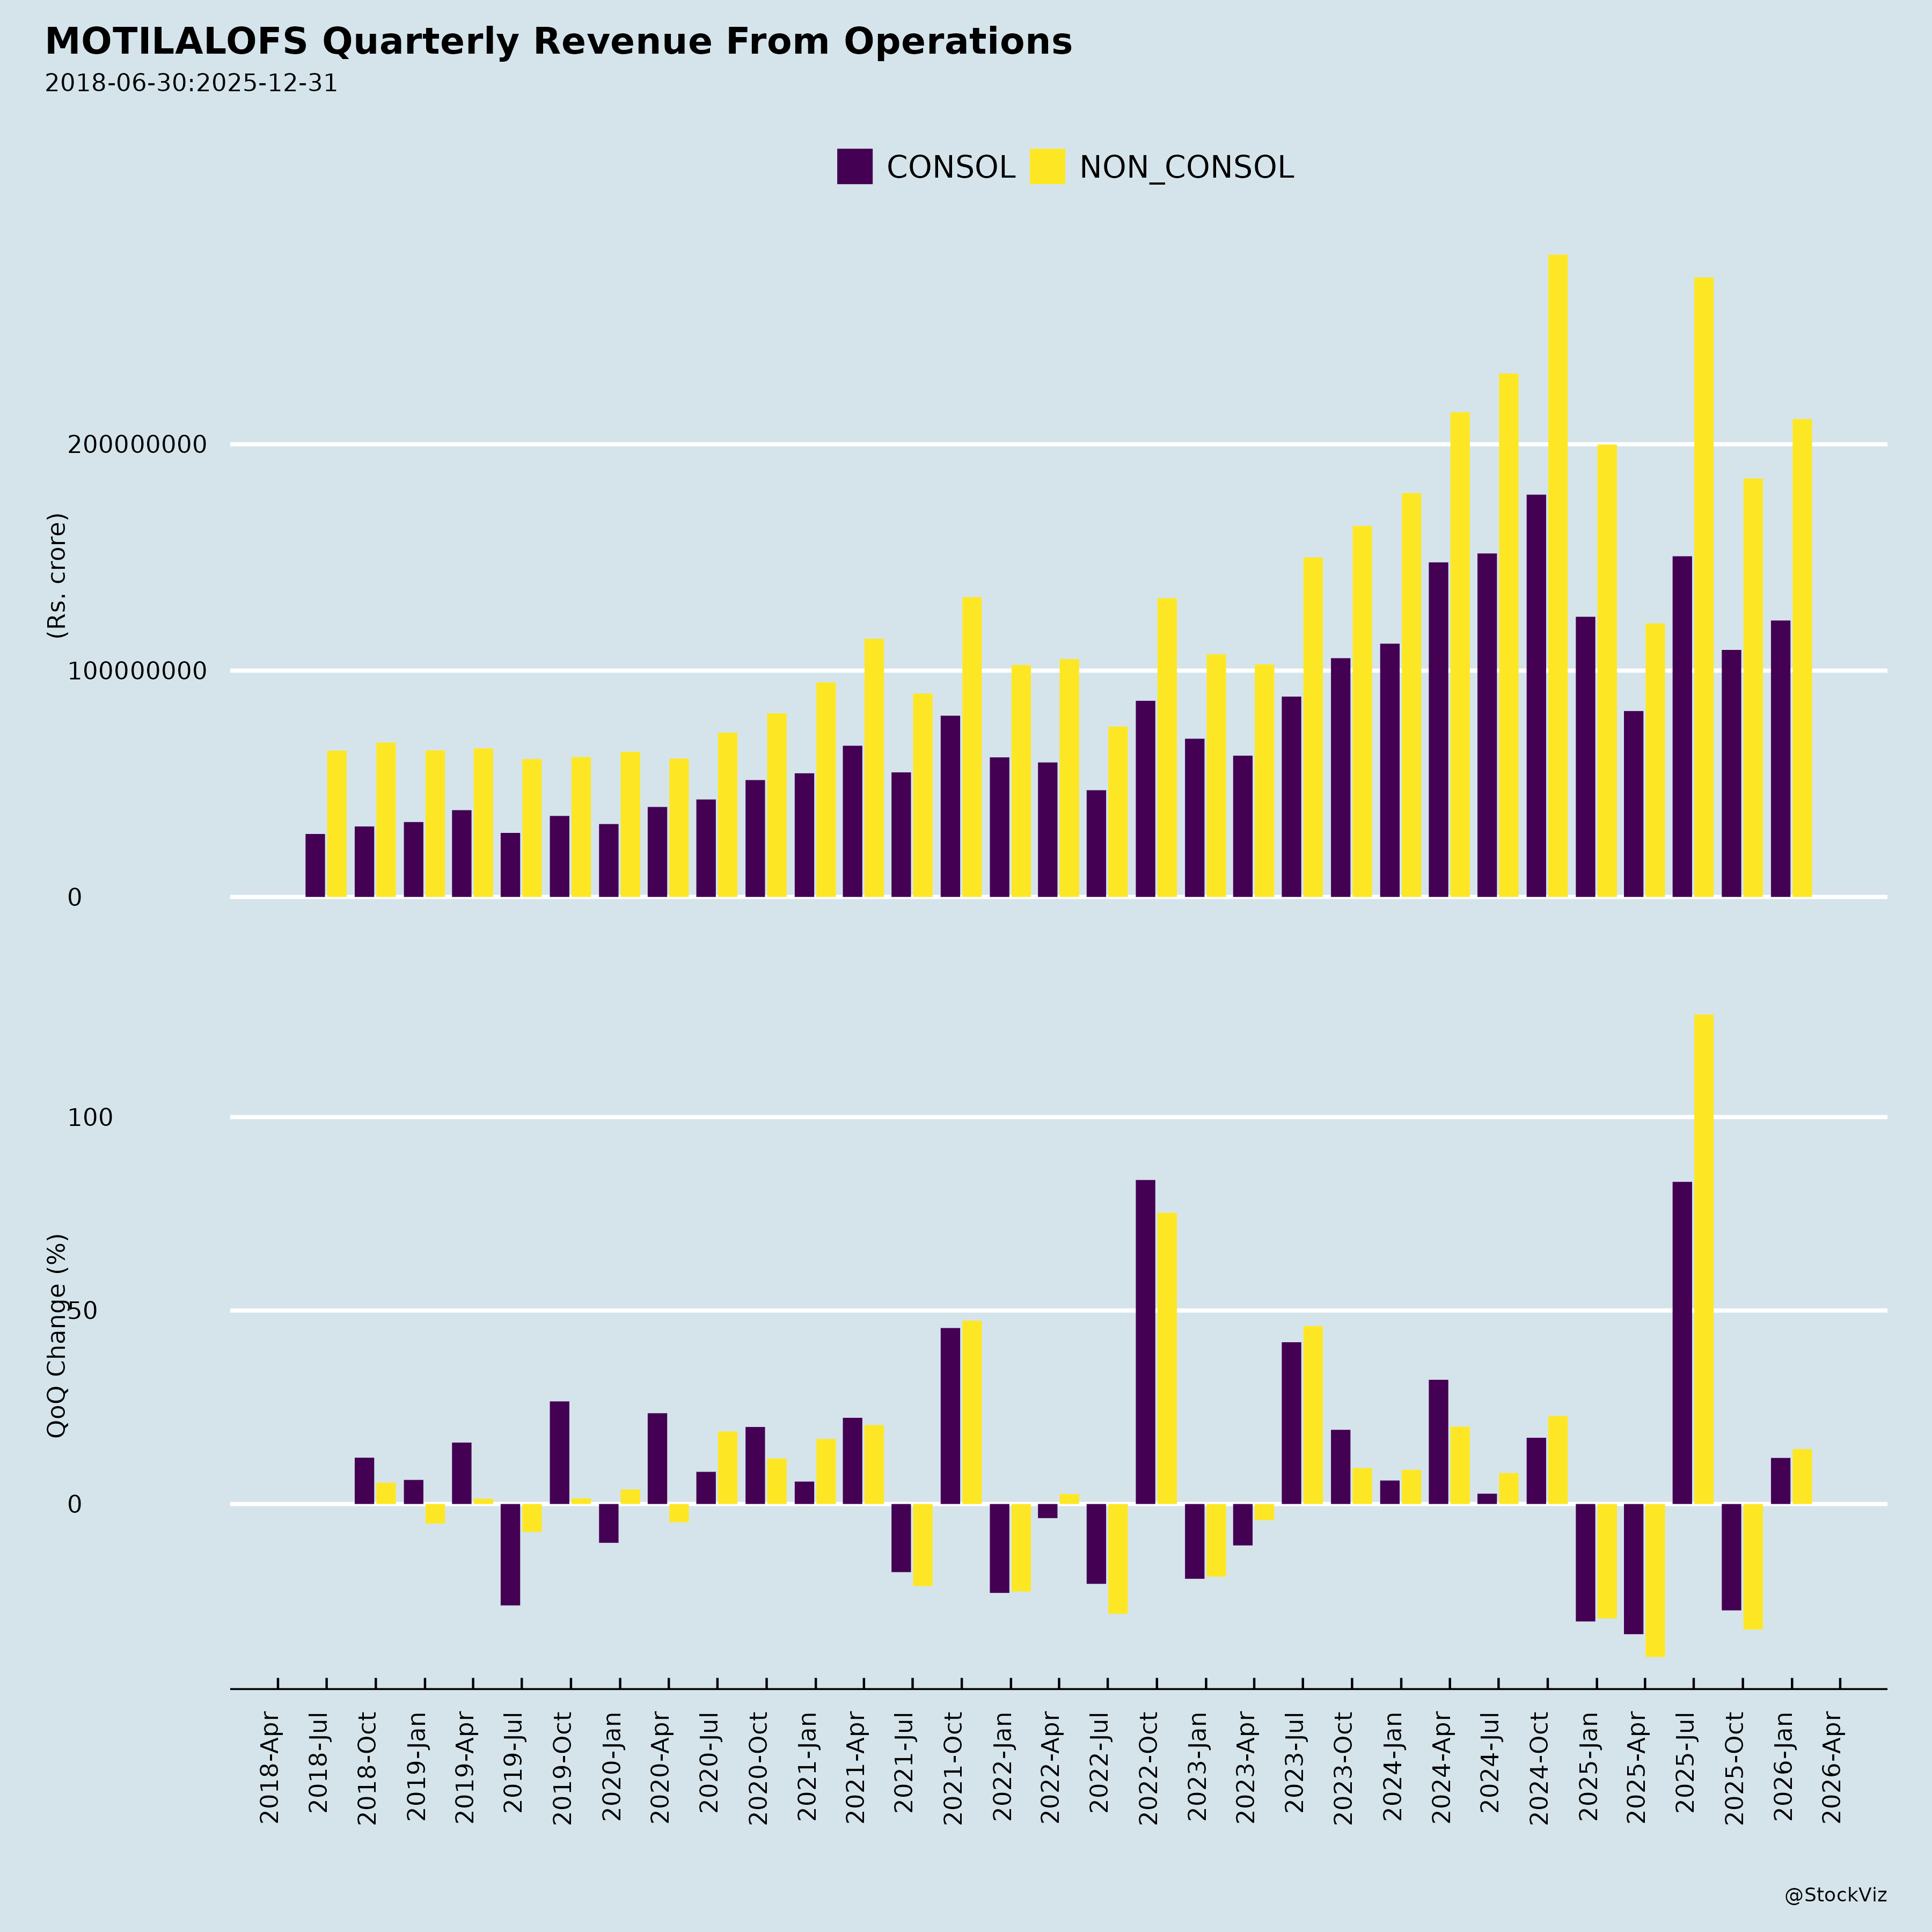
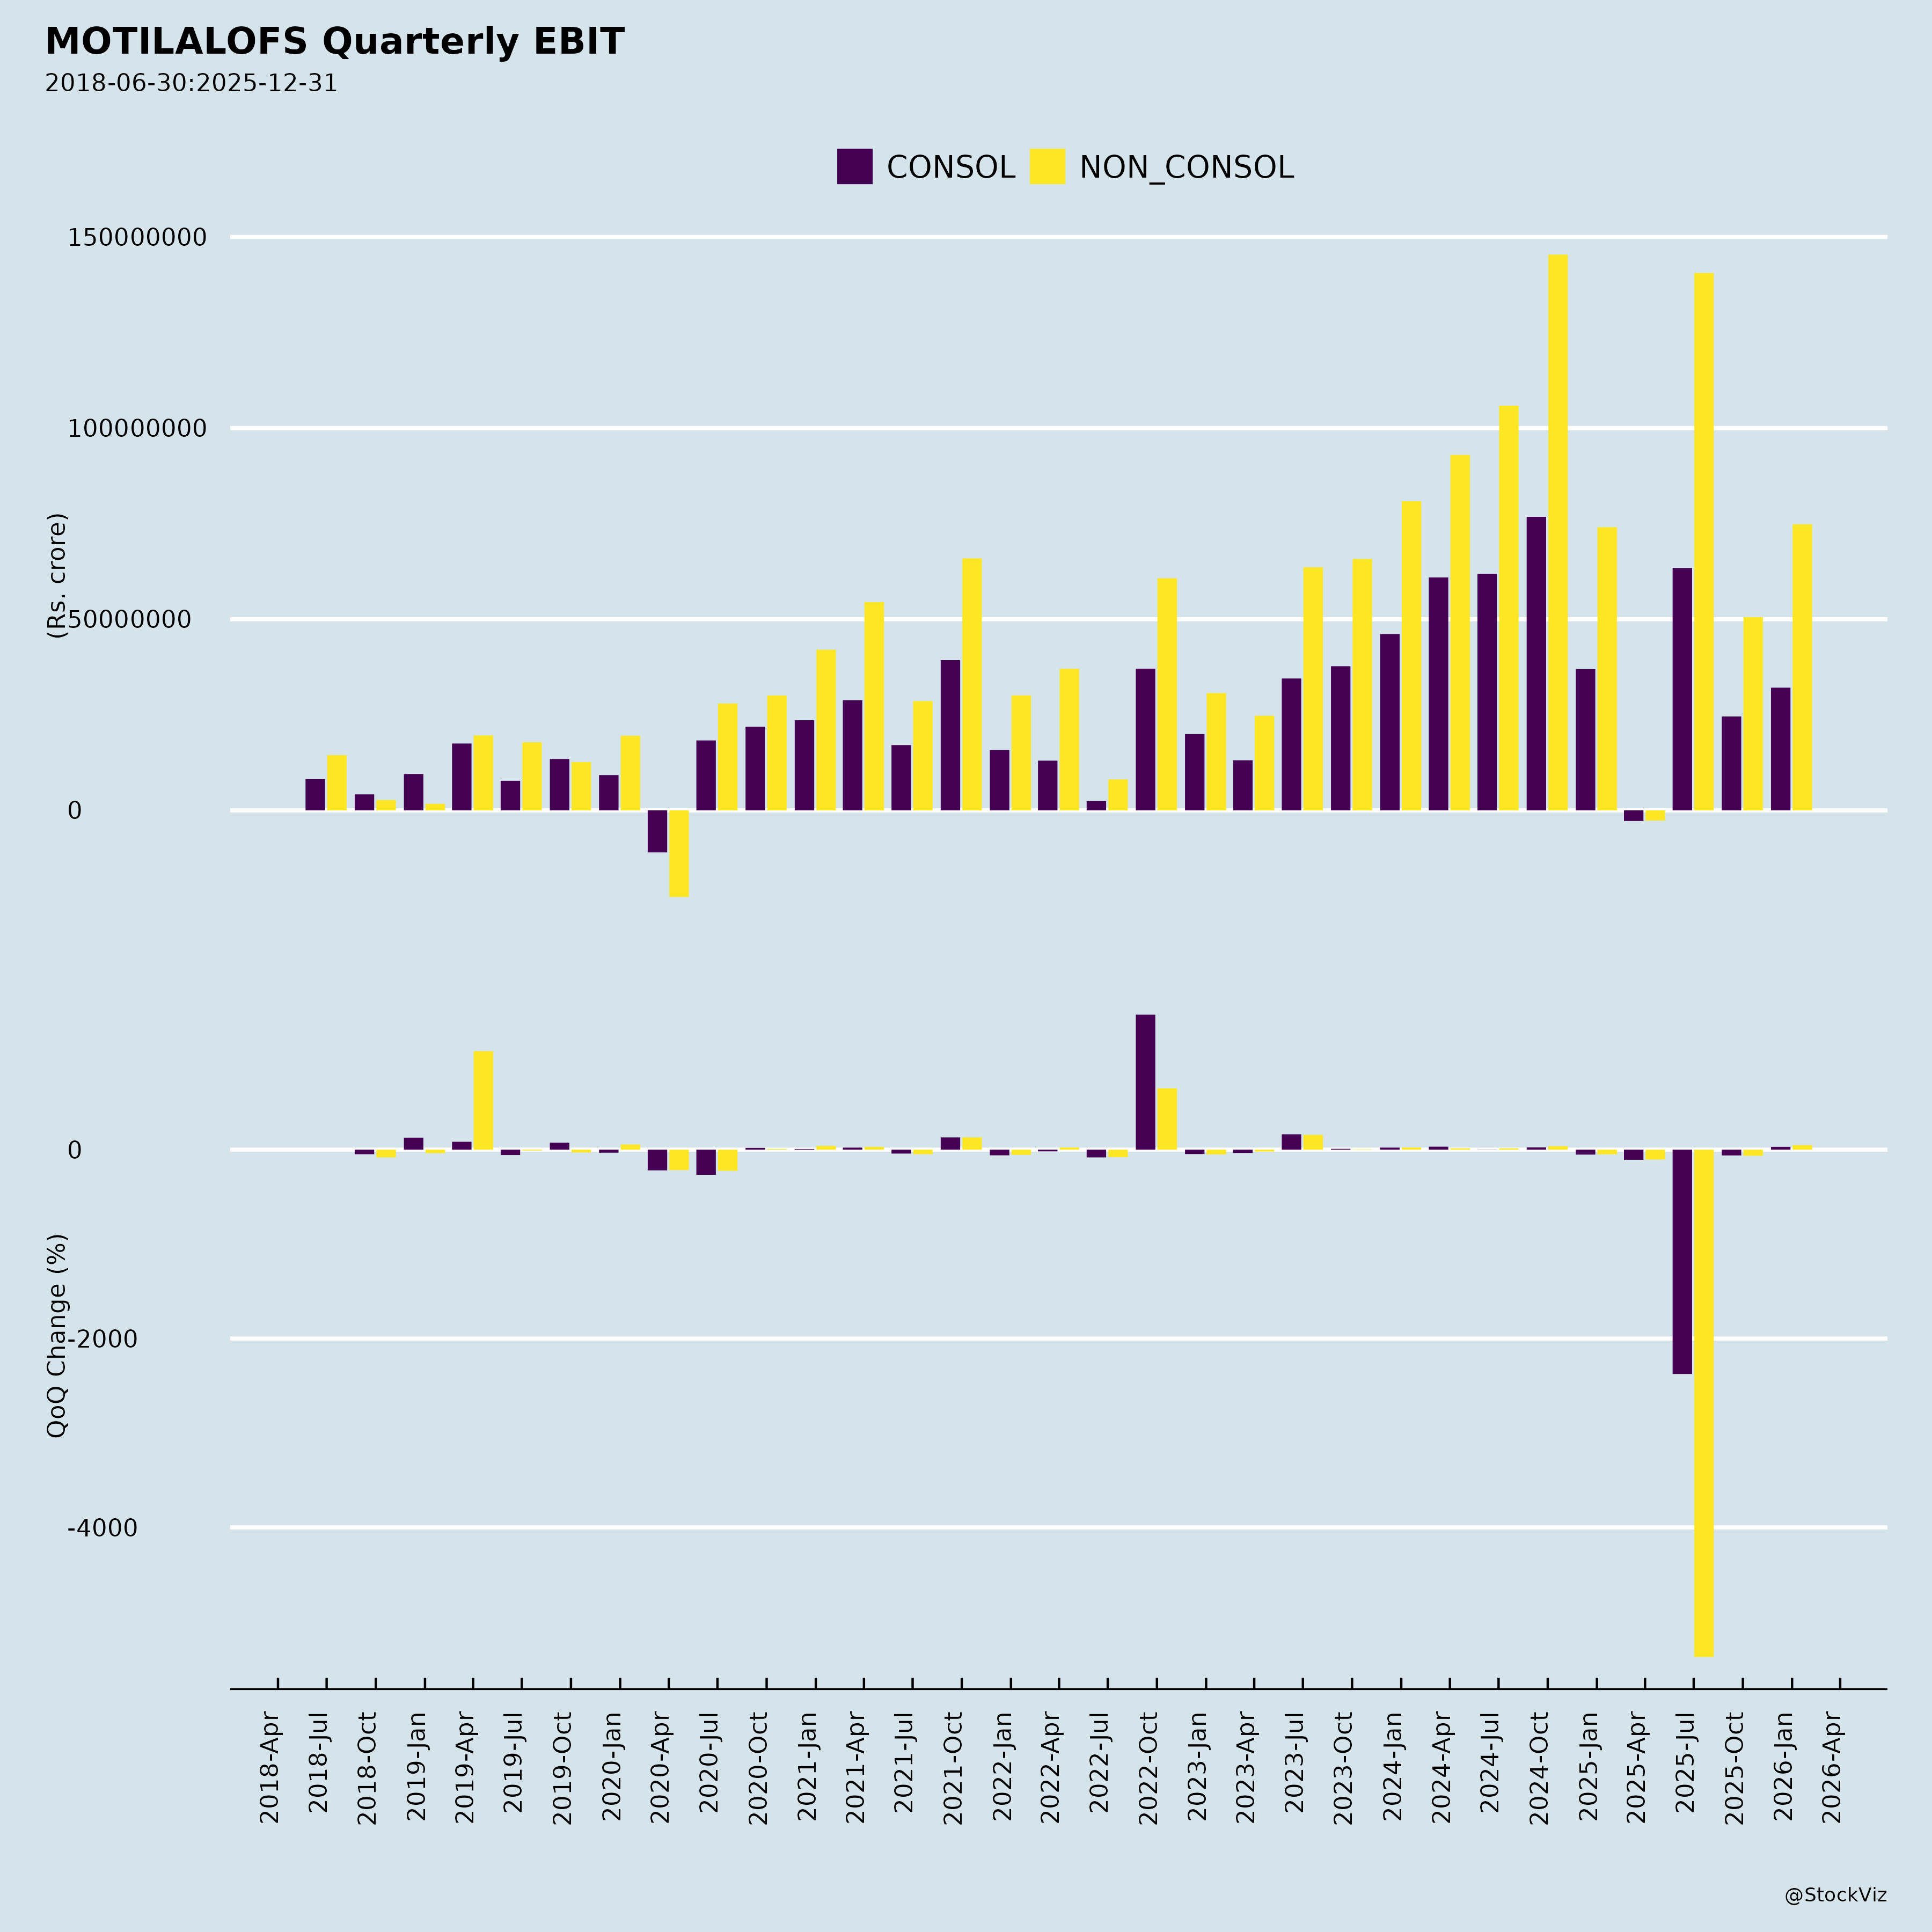
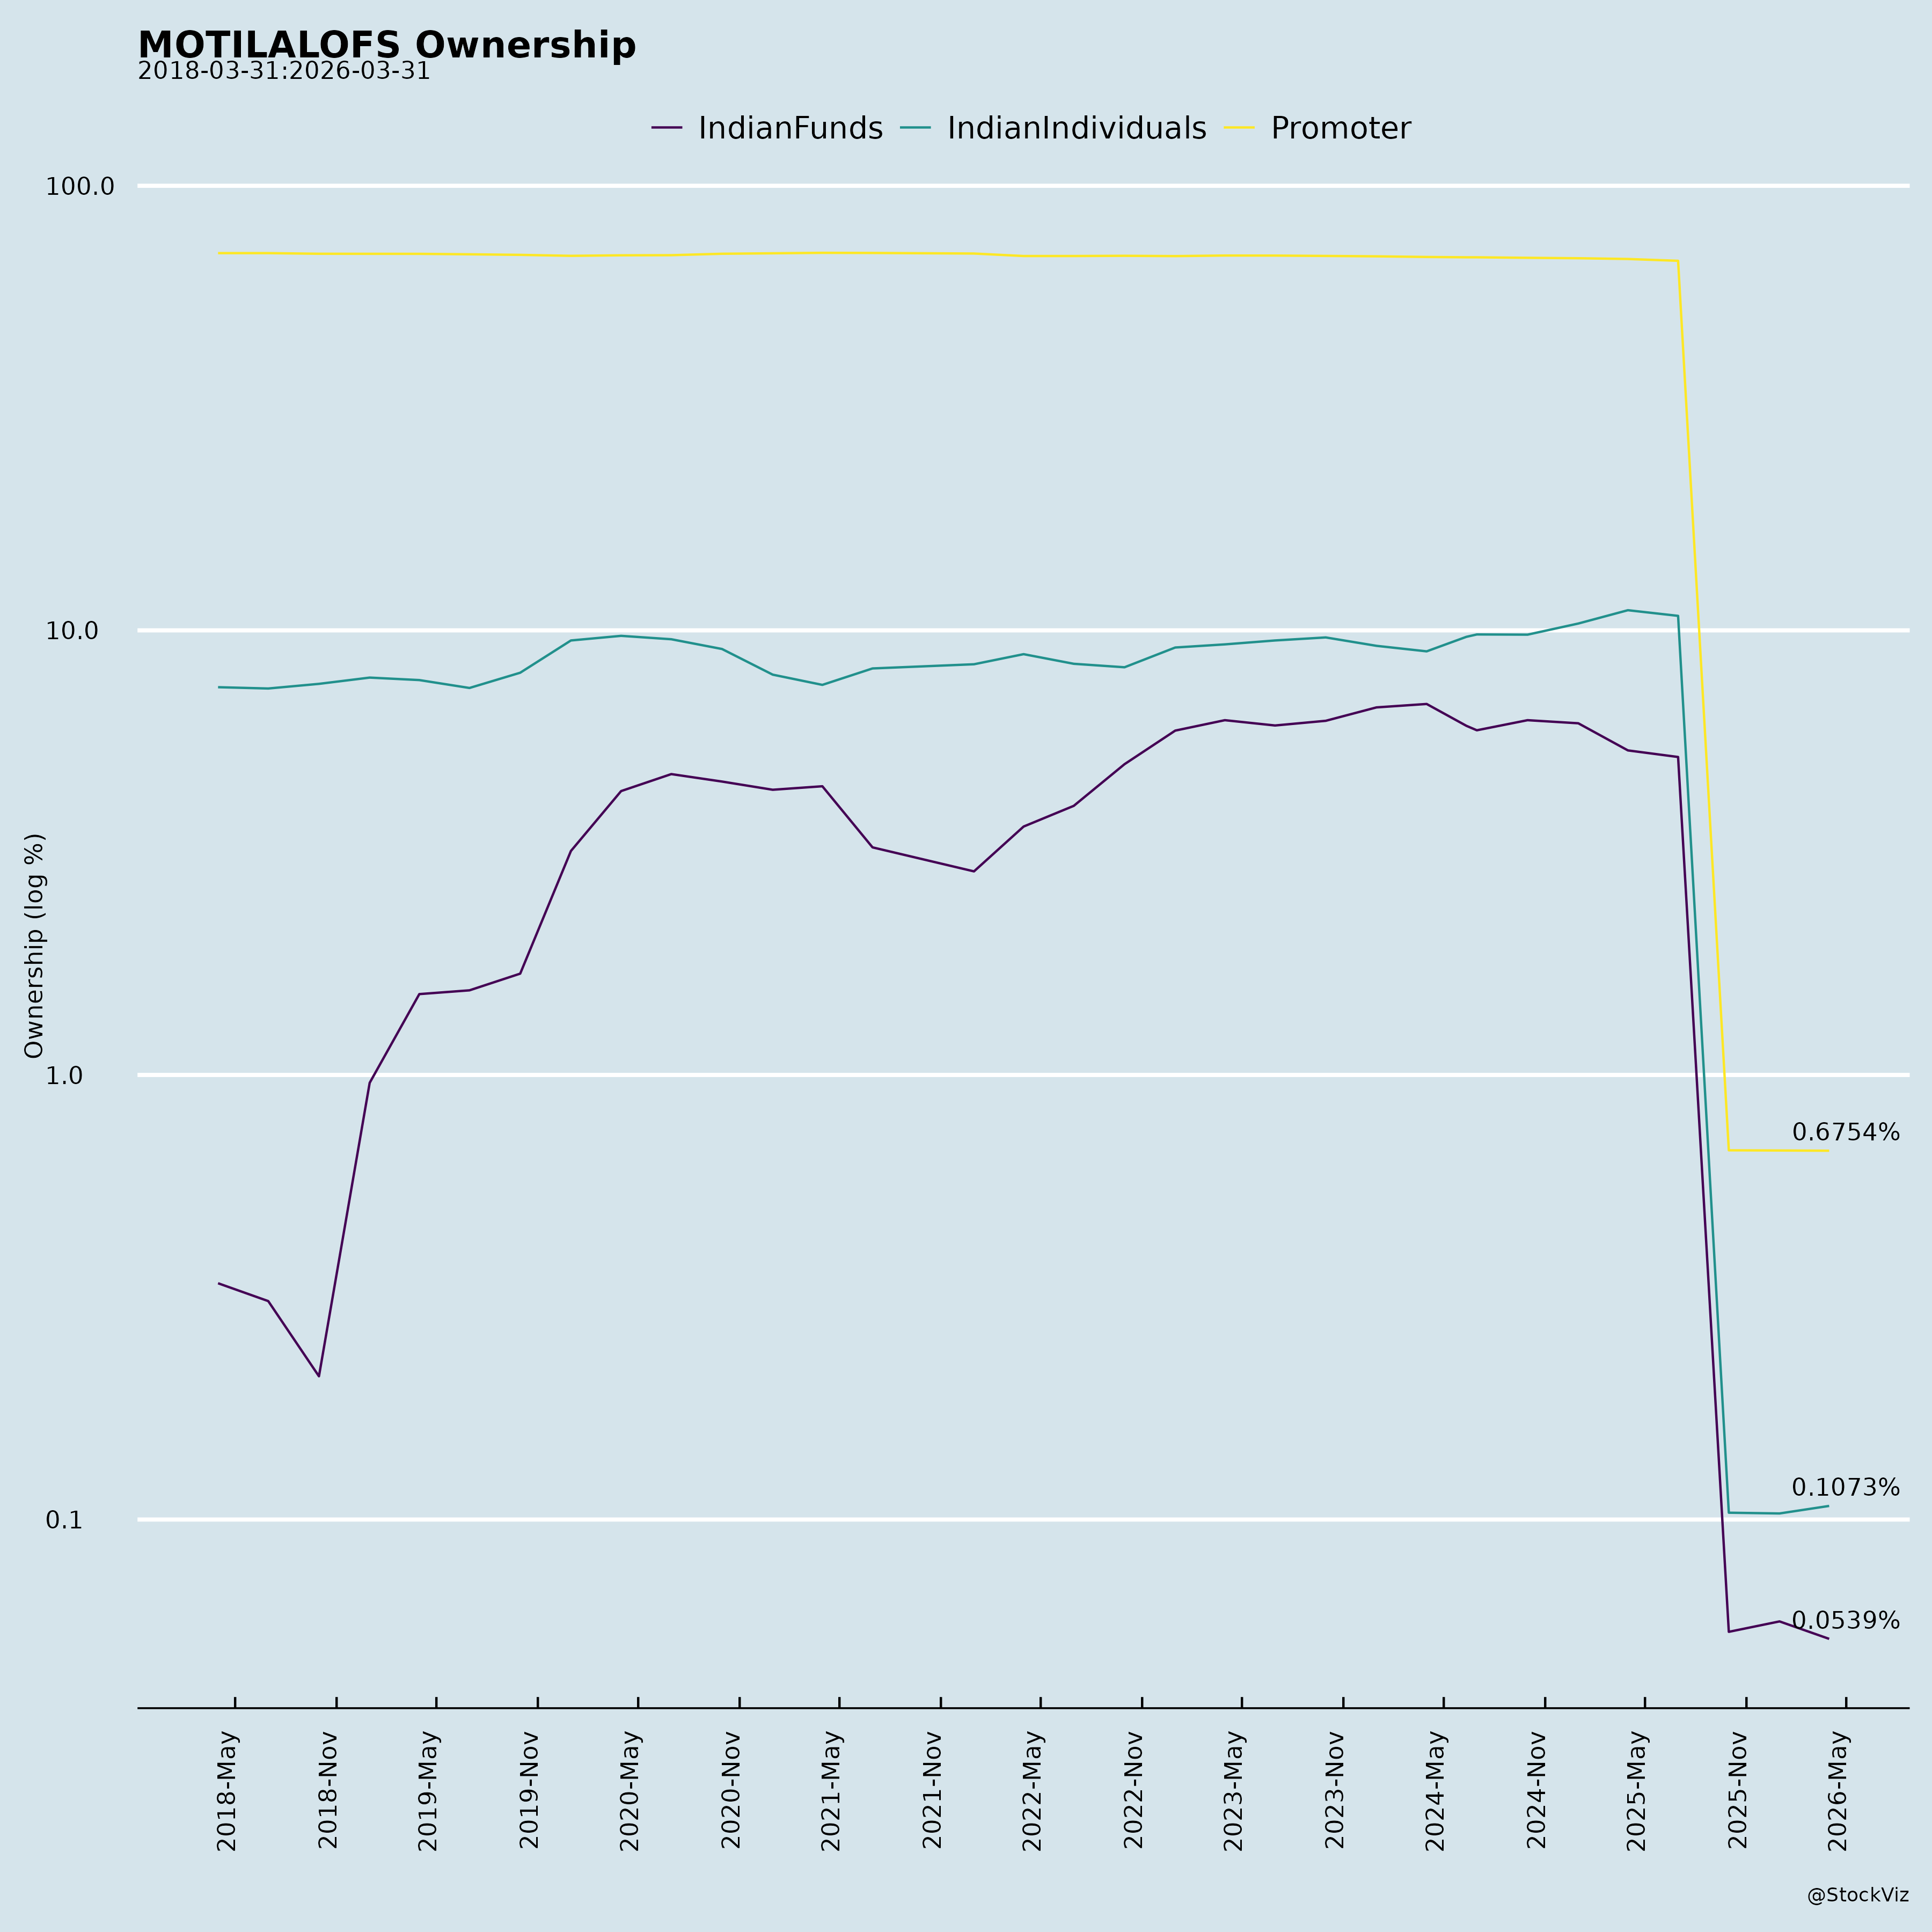
Ownership
Margined
AI Summary
asof: 2026-09-16
Motilal Oswal Financial Services (MOTILALOFS) — Q1FY27 Analysis
1. Headwinds and Challenges
Wealth Management drag. The Wealth Management segment’s operating PAT declined 7% YoY to ₹161 Cr and 21% QoQ, with net revenue flat YoY and down 6% QoQ. Management attributed this to a high base of transaction-based revenue (TBR) in Q1FY26, particularly from unlisted revenues, and flagged that TBR will remain volatile quarter-on-quarter while ARR revenues rise steadily. Distribution revenues fell sharply YoY even as distribution and broking assets grew, which management explained as a function of the elevated prior-year TBR base.
Capital Markets softness. Capital Market operating PAT fell 25% YoY to ₹76 Cr, with net revenue down 26% YoY. Management described market conditions as challenging and noted the business is now reconciled to not having one clean runway across the year, but rather pockets of two-to-three-month execution windows occurring two or three times a year. Employee costs in this segment were also described as volatile because of the variable component tied to revenues.
Alternates net flows. The listed alternates business saw soft net flows in the quarter. Management attributed this to the geopolitical environment, ultra-HNI consolidation (barring one player), and competition from a plethora of structured debt, private credit, real assets and special-opportunity funds absorbing private bank, family office and HNI allocations. Gross inflows were described as among the highest in the street, but normal redemptions on a ₹35,000+ Cr AUM base produced negative net flows for the quarter.
Housing Finance credit cost. Credit cost rose from 10 bps QoQ to 1.0% in Q1FY27. The CFO characterized this as a seasonal Q1 pattern in 1+ DPD, 30+ DPD and 90+ DPD numbers, noted FY26 credit cost overall was 0.5%, and said it should correct over the course of the financial year. GNPA improved YoY to 1.1% from 1.4%.
Regulatory headwinds. Management explicitly referenced regulatory headwinds in the base, particularly for the Wealth Management business given regulatory changes. On the prop trading rule effective 1 July, the Wealth Management CEO said impact is limited because it mainly affects brokers heavy on prop trading, with only a minor impact from changed intraday bank funding; the group stated it has no material prop trading activity.
Private Wealth TBR volatility. Private Wealth PAT was flattish, up 2%, on lower TBR. Client preferences shifted toward direct fixed income assets this quarter versus strong unlisted equity sourcing last year. QoQ net flows in Private Wealth were softer, which management attributed to allocation preference changes that tend to even out over the year.
Employee cost step-up. Group employee expenses rose 16% QoQ, driven by the annual appraisal cycle effective 1 April. In AMC, the sequential increase was amplified because Q4FY26 contained a one-time ESOP reversal from lapsed options; Q1FY27 was described as the normalized run-rate for both AMC and the group.
2. Tailwinds and Growth Prospects
Asset and Private Wealth Management as the growth engine. This segment grew operating PAT 46% YoY to ₹335 Cr and now contributes 55% of group operating PAT, up from 50% in FY26 and 42% in FY25. Asset Management PAT grew 73% YoY to ₹245 Cr and is now the largest contributor at 40% of PAT. Total AUM grew 31% YoY to ₹2.12 lakh Cr, crossing the ₹2 lakh Cr milestone.
AMC flow momentum and vintage unlock. Net MF flow market share of 4.2% exceeds AUM market share of 2.9%. SIP inflows rose 16% YoY to ₹4,064 Cr with 4.3% market share and SIP AUM of ₹38,643 Cr. Only 6 funds have over 3 years of vintage, covering 44% of industry AUM; two more funds cross 3 years by March 2027 and eight more by March 2028, lifting 3+ year vintage participation to 75% of industry AUM. Management specifically flagged small cap and large cap funds completing 3 years around December 2026–January 2027, followed within three months by a multi-cap category. Other cited supports include an annualized SIP run rate of ~₹16,000 Cr, NFO collections, current AUM ~15% above the FY26 average, potential mark-to-market gains after two muted years, and GIFT City entries.
Alternates pipeline. MO Alternates AUM grew 99% YoY. The maiden private credit fund executed a second close at ₹2,435 Cr toward a ₹3,000 Cr target, with final close expected in Q2. Commercial real estate launch is planned for H2FY27 following regulatory approval. Management guided that unlisted alternates fee income and accrued carry income should rise steadily, since each subsequent series is larger and fees are booked on amounts raised rather than mark-to-market.
Private Wealth scale-up. ARR revenue grew 42% YoY to ₹157 Cr; net flows grew 37% to ₹3,929 Cr; AUM grew 37% YoY to ₹2.4 lakh Cr. RM base rose 26% to 441, with only 32% having over 3 years of vintage, implying productivity runway. Wallet size per customer is near ₹25 Cr and AUM per banker near ₹550 Cr. About 80% of flows come from deepening existing customers and 20% from new customers. ARR AUM is ~₹52,000 Cr.
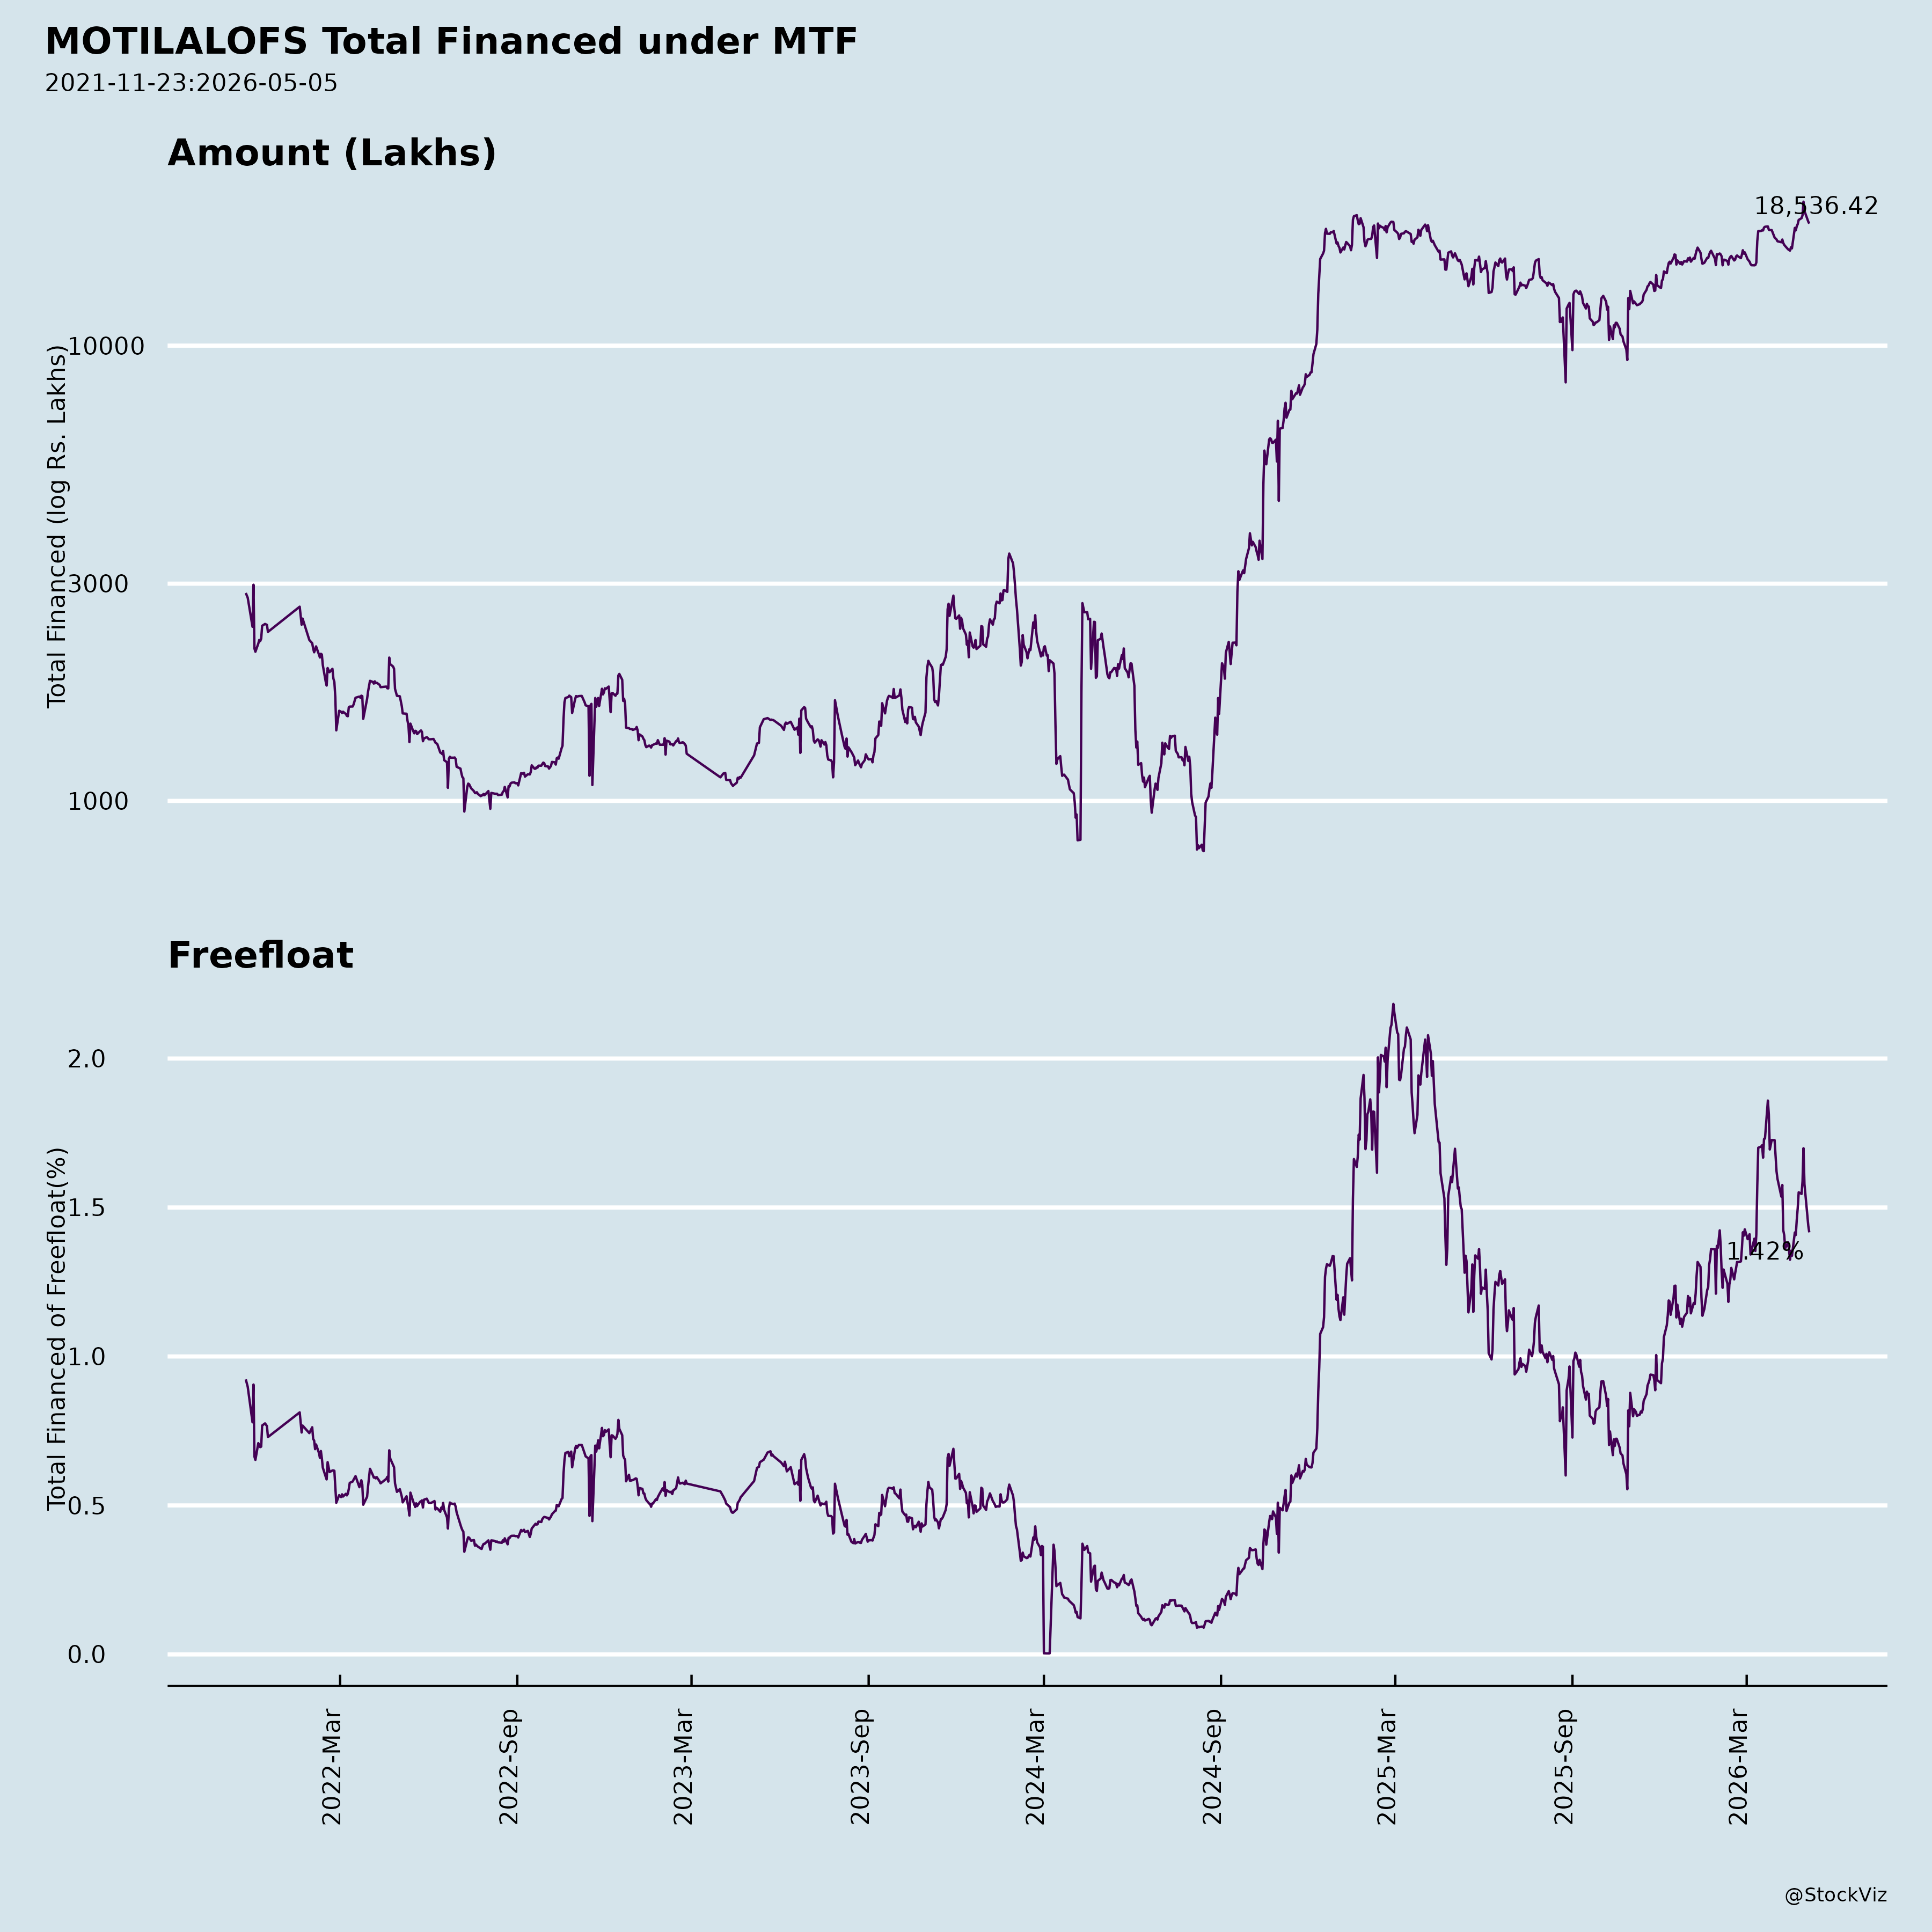
Wealth Management annuity shift. ARR revenue grew 26% YoY to ₹304 Cr; distribution and NII now contribute ~57–59% of segment net revenue, up from 33% in FY21. Distribution book grew 29% to ₹45,575 Cr; loan book grew 33% to ₹7,388 Cr; group MTF book grew 55% YoY to ₹7,800 Cr with ~6.5% market share. Cross-sell penetration is only ~18% against multiple times for global peers. Overall ADTO market share including commodities was 7.6%, with F&O premium share up from 7% to 7.6% YoY.
Capital Markets franchise. Investment banking completed 11 deals raising over ₹10,000–10,200 Cr, with fee income up 48% QoQ to ₹68 Cr and a #2 rank in the Q1FY27 IPO/QIP league table. Institutional equities coverage reached 384 stocks across 28 sectors, with stated intent to reach 500. Management described the signed mandate pipeline as very strong and expects FY27 growth overall, contingent on execution windows.
Housing Finance. Disbursements grew 64% YoY to ₹646 Cr; AUM grew 23% YoY to ₹6,164 Cr; PAT grew 36% YoY to ₹32 Cr. CRAR was 37.8% with leverage of 3.9x, which management said provides growth levers without further capital infusion. Management expects strong growth over the next 2–3 years.
Rating upgrade. CRISIL upgraded long-term credit rating to AA+ Stable, described as the highest among non-bank domestic capital market players. The CFO guided that capital market spreads versus AAA players narrowed from 75 bps to 30–35 bps, and the upgrade should rationalize cost of borrowing by a further 15–20 bps over 12–18 months.
Treasury and structural mix. Treasury book grew 22% YoY to ₹10,482 Cr, with 41% CAGR since inception and 17% XIRR since FY14. Annuity revenues now contribute 66% of group revenues versus 60% in FY26 and 54% in FY25. The group cited India’s wealth crossing USD 100 Tn, financialization of savings, and rising capital market share of Indian market cap as tailwinds.
3. Key Risks
- TBR volatility in both Wealth Management and Private Wealth, driven by asset-class preference shifts and dependence on unlisted equity and structured deal activity, with management explicitly declining to promise stability.
- Capital markets execution risk, where revenue is contingent on market windows rather than pipeline strength; management noted QoQ volatility is inherent to the industry.
- Alternates flow risk, given competition from structured debt, private credit, real assets and special-opportunity funds, plus sensitivity of ultra-HNI allocations to geopolitics.
- Carry income timing risk, where exits may slip between financial years; management stated assumptions are conservative and factor in delays, with only ~70% of fair value recognized and the remainder on realization.
- Housing Finance credit cost seasonality, with Q1 credit cost at 1.0% versus 0.5% for FY26 overall, dependent on normalization through the year.
- Regulatory risk, particularly in Wealth Management, referenced as a headwind in the base.
- Treasury mark-to-market volatility, with management noting month-to-month and week-to-week outcomes can be volatile and citing the Q4FY26 treasury PAT loss of ₹1,054 Cr against a ₹904 Cr gain in Q1FY27.
- SIP stagnation risk, where trailing returns that look less exciting can produce 6–12 month spells of flat industry SIP growth, though management said no meaningful industry contraction is visible.
- RM productivity and attrition risk, with typical banker breakeven at 2–3 years and only 32% of RMs above 3 years of vintage.
4. Management Guidance Versus Observed Performance
Asset and Private Wealth share of PAT. Management guided that the share of Asset and Private Wealth businesses will continue to rise on growing annuity share and low market share. Observed: 55% of operating PAT in Q1FY27 versus 50% in FY26 and 42% in FY25, with Asset Management alone at 40% versus 26% in Q1FY26.
ARR revenue trajectory. Management guided that ARR revenues will continue to rise steadily while TBR remains volatile QoQ. Observed: group ARR share at 66% in Q1FY27 versus 60% in FY26; Private Wealth ARR up 42% YoY; Wealth Management ARR up 26% YoY, even as distribution revenue fell and Private Wealth PAT was flattish.
Alternates carry income. Management guided ₹66 Cr of accrued variable additional return in Q1FY27, expected to recur at similar levels for the next three quarters and be higher next year, with assumptions factoring in delays. Observed: ₹66 Cr accrued in Q1FY27, with income having started only from Q3FY26, and no meaningful listed equities carry booked yet, with Q2 or Q3 flagged as possible.
Alternates AUM and fee income. Management guided steady rises in fee income and accrued carry income, with the private credit fund final close in Q2 and commercial real estate launch in H2. Observed: MO Alternates AUM up 99% YoY, second close at ₹2,435 Cr, and net ₹800 Cr flow from the private credit fund in Q1FY27.
AMC flow market share. Management guided that flow market share should remain above AUM market share and that vintage crossings should lift flows. Observed: net MF flow market share 4.2% versus AUM market share 2.9%, improving from 3.7% in the previous quarter, though still below the 7.7% recorded in Q1FY26 and 6.6% for FY26.
Capital Markets FY27 growth. Management guided FY27 as a whole will witness growth, with QoQ dependent on market windows. Observed: Q1FY27 operating PAT down 25% YoY and net revenue down 26% YoY, though fee income rose 48% QoQ and the segment PAT was up 1% QoQ.
Housing Finance credit cost. Management guided Q1 credit cost elevation is seasonal and will correct during the financial year. Observed: Q1FY27 credit cost at 1.0% versus 0.8% in Q1FY26 and 0.5% for FY26 overall, with GNPA improving to 1.1% from 1.4% YoY.
Cost of borrowing. Management guided 15–20 bps rationalization over 12–18 months post the CRISIL upgrade. Observed: capital market spreads already narrowed from 75 bps to 30–35 bps versus AAA players, with bank borrowing costs also down over the last 12 months.
Margins. Management guided that historical 50–52% PBT margins should sustain over FY27, supported by a high variable cost share (about 70% in Wealth Management). Observed: Q1FY27 PBT margin at 52%, versus 50% in Q1FY26 and 56% in Q4FY26.
RM hiring. Management guided fewer RM additions in FY27 versus FY26, but at higher cost and targeted at family offices. Observed: RM base up 26% YoY to 441, with the FY26 step-up described as meaningful and FY27 composition shifting toward senior, family-office-focused hires.
Employee cost normalization. Management indicated Q1FY27 employee cost is the normalized level for AMC and the group. Observed: group employee expense up 16% QoQ and down 4% YoY, with the QoQ rise tied to the April appraisal cycle and the AMC sequential jump tied to the Q4FY26 ESOP reversal.
Broker Narrative
The broker narrative shifted from an early dependence on capital-market recovery and selective MF-scheme improvements to a mature story centered on recurring annuity revenue, AUM/PWM growth, fund-vintage expansion, and the HFC rating upgrade. Persisting themes included cross-sell penetration (16% to 18%) and the holding-company discount, while the early worries resurfaced in sharper forms: weak MF performance, softer inflows, HFC deterioration, and broking market-share slippage.
Fears that came true
- The early concern that large-AUM MF schemes were only slowly improving materialized as key funds underperformed badly by Q1FY27: Flexi Cap was -7.8% YoY (rank 39/39) and Midcap -10.1% YoY (rank 30/30).
- The early PMS outflow risk was not permanently offset by AIF inflows; by Q1FY27, PMS+AIF had net outflows of INR1.5bn and MF inflows softened to INR57bn.
- The early housing-finance worries about prepayments, cost of funds, and NIM pressure proved real: Q1FY27 HFC PAT fell 45.3% QoQ, NIMs compressed to 6.9%, credit costs were ~1%, and collection efficiency dropped.
- The early broking-yield/market-share stress worsened into consolidated market share slipping ~158bps QoQ to 7.6% in Q1FY27, a key negative around the 2025-04-29 DISAPPOINTMENT outcome (-5.3%).
Optimism that failed
- Optimism that MF schemes had improved sharply and Flexi Cap was slowly improving failed: by Q1FY27, Flexi Cap and Midcap ranked last in their categories on 1-year returns.
- Optimism that AIF inflows would keep offsetting PMS outflows failed, as Q1FY27 reported net outflows of INR1.5bn in PMS+AIF.
- Optimism about sustained housing-finance growth and asset-quality improvement failed: Q1FY27 saw home-loan disbursements fall 9.9% QoQ, NIMs compress, and credit costs rise to ~1%.
- Optimism about stable broking market share and cash-volume revival failed, with consolidated market share dropping ~158bps QoQ to 7.6% in Q1FY27.
Broker Timeline
7 broker calls · 2023-07-10 to 2026-07-30
Copyright © 2023 SAS Data Analytics Pvt. Ltd. All rights reserved.