LT
Equity Metrics
January 13, 2026
Larsen & Toubro Limited
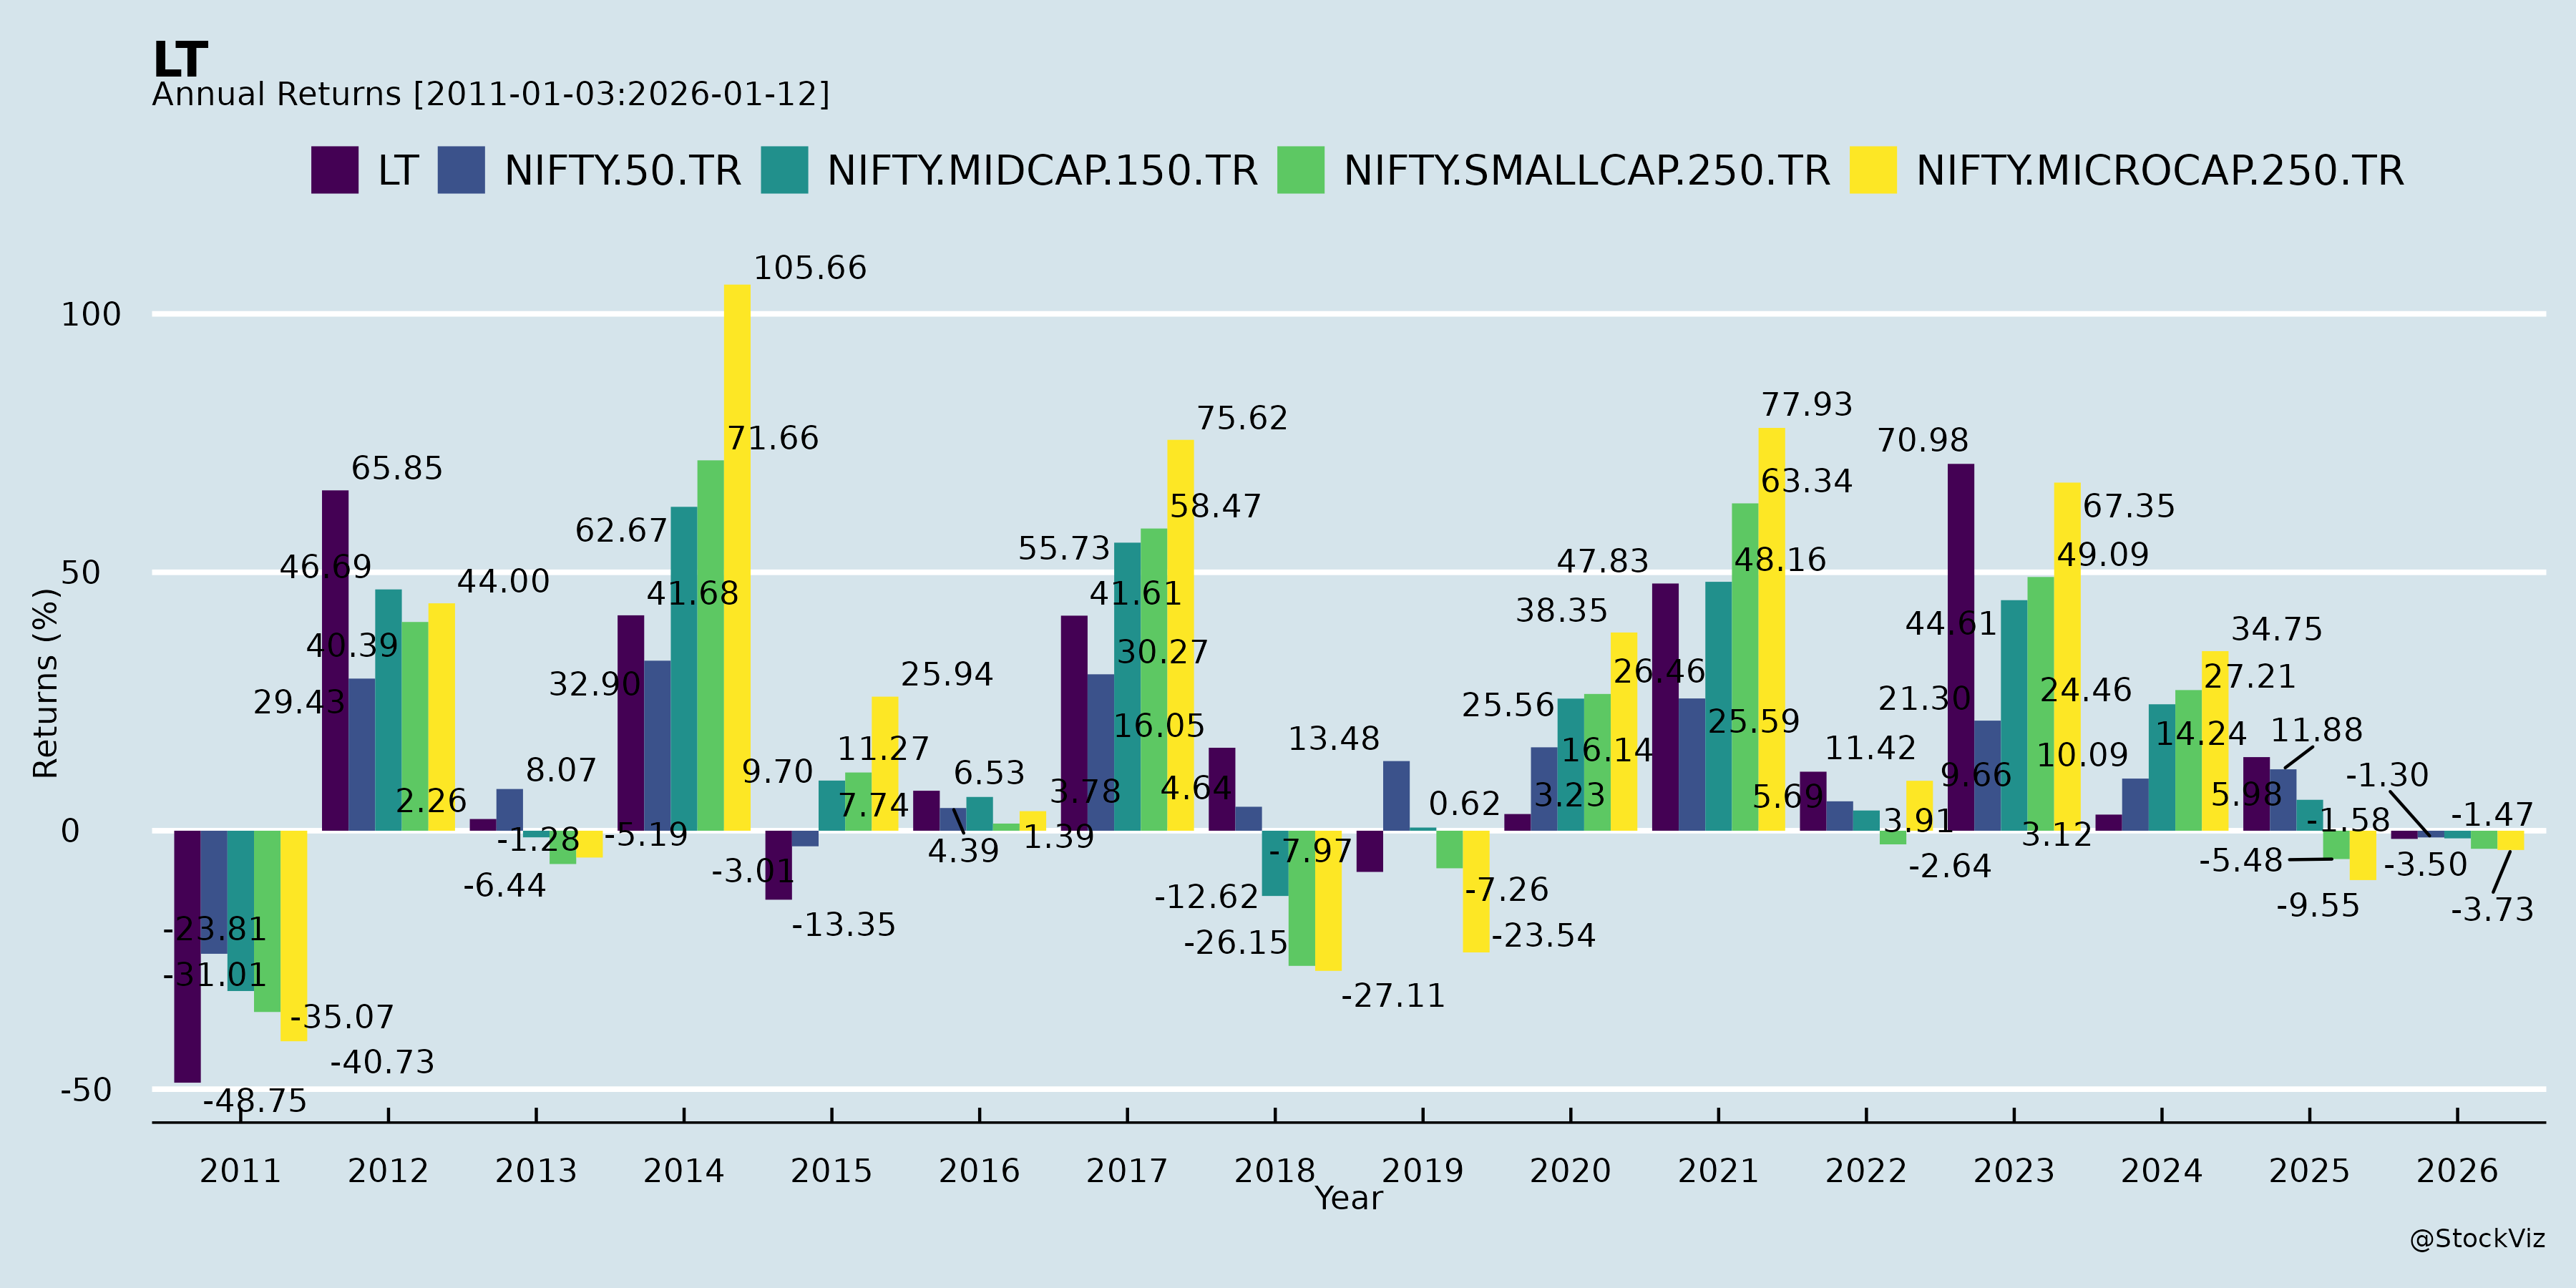
Annual Returns
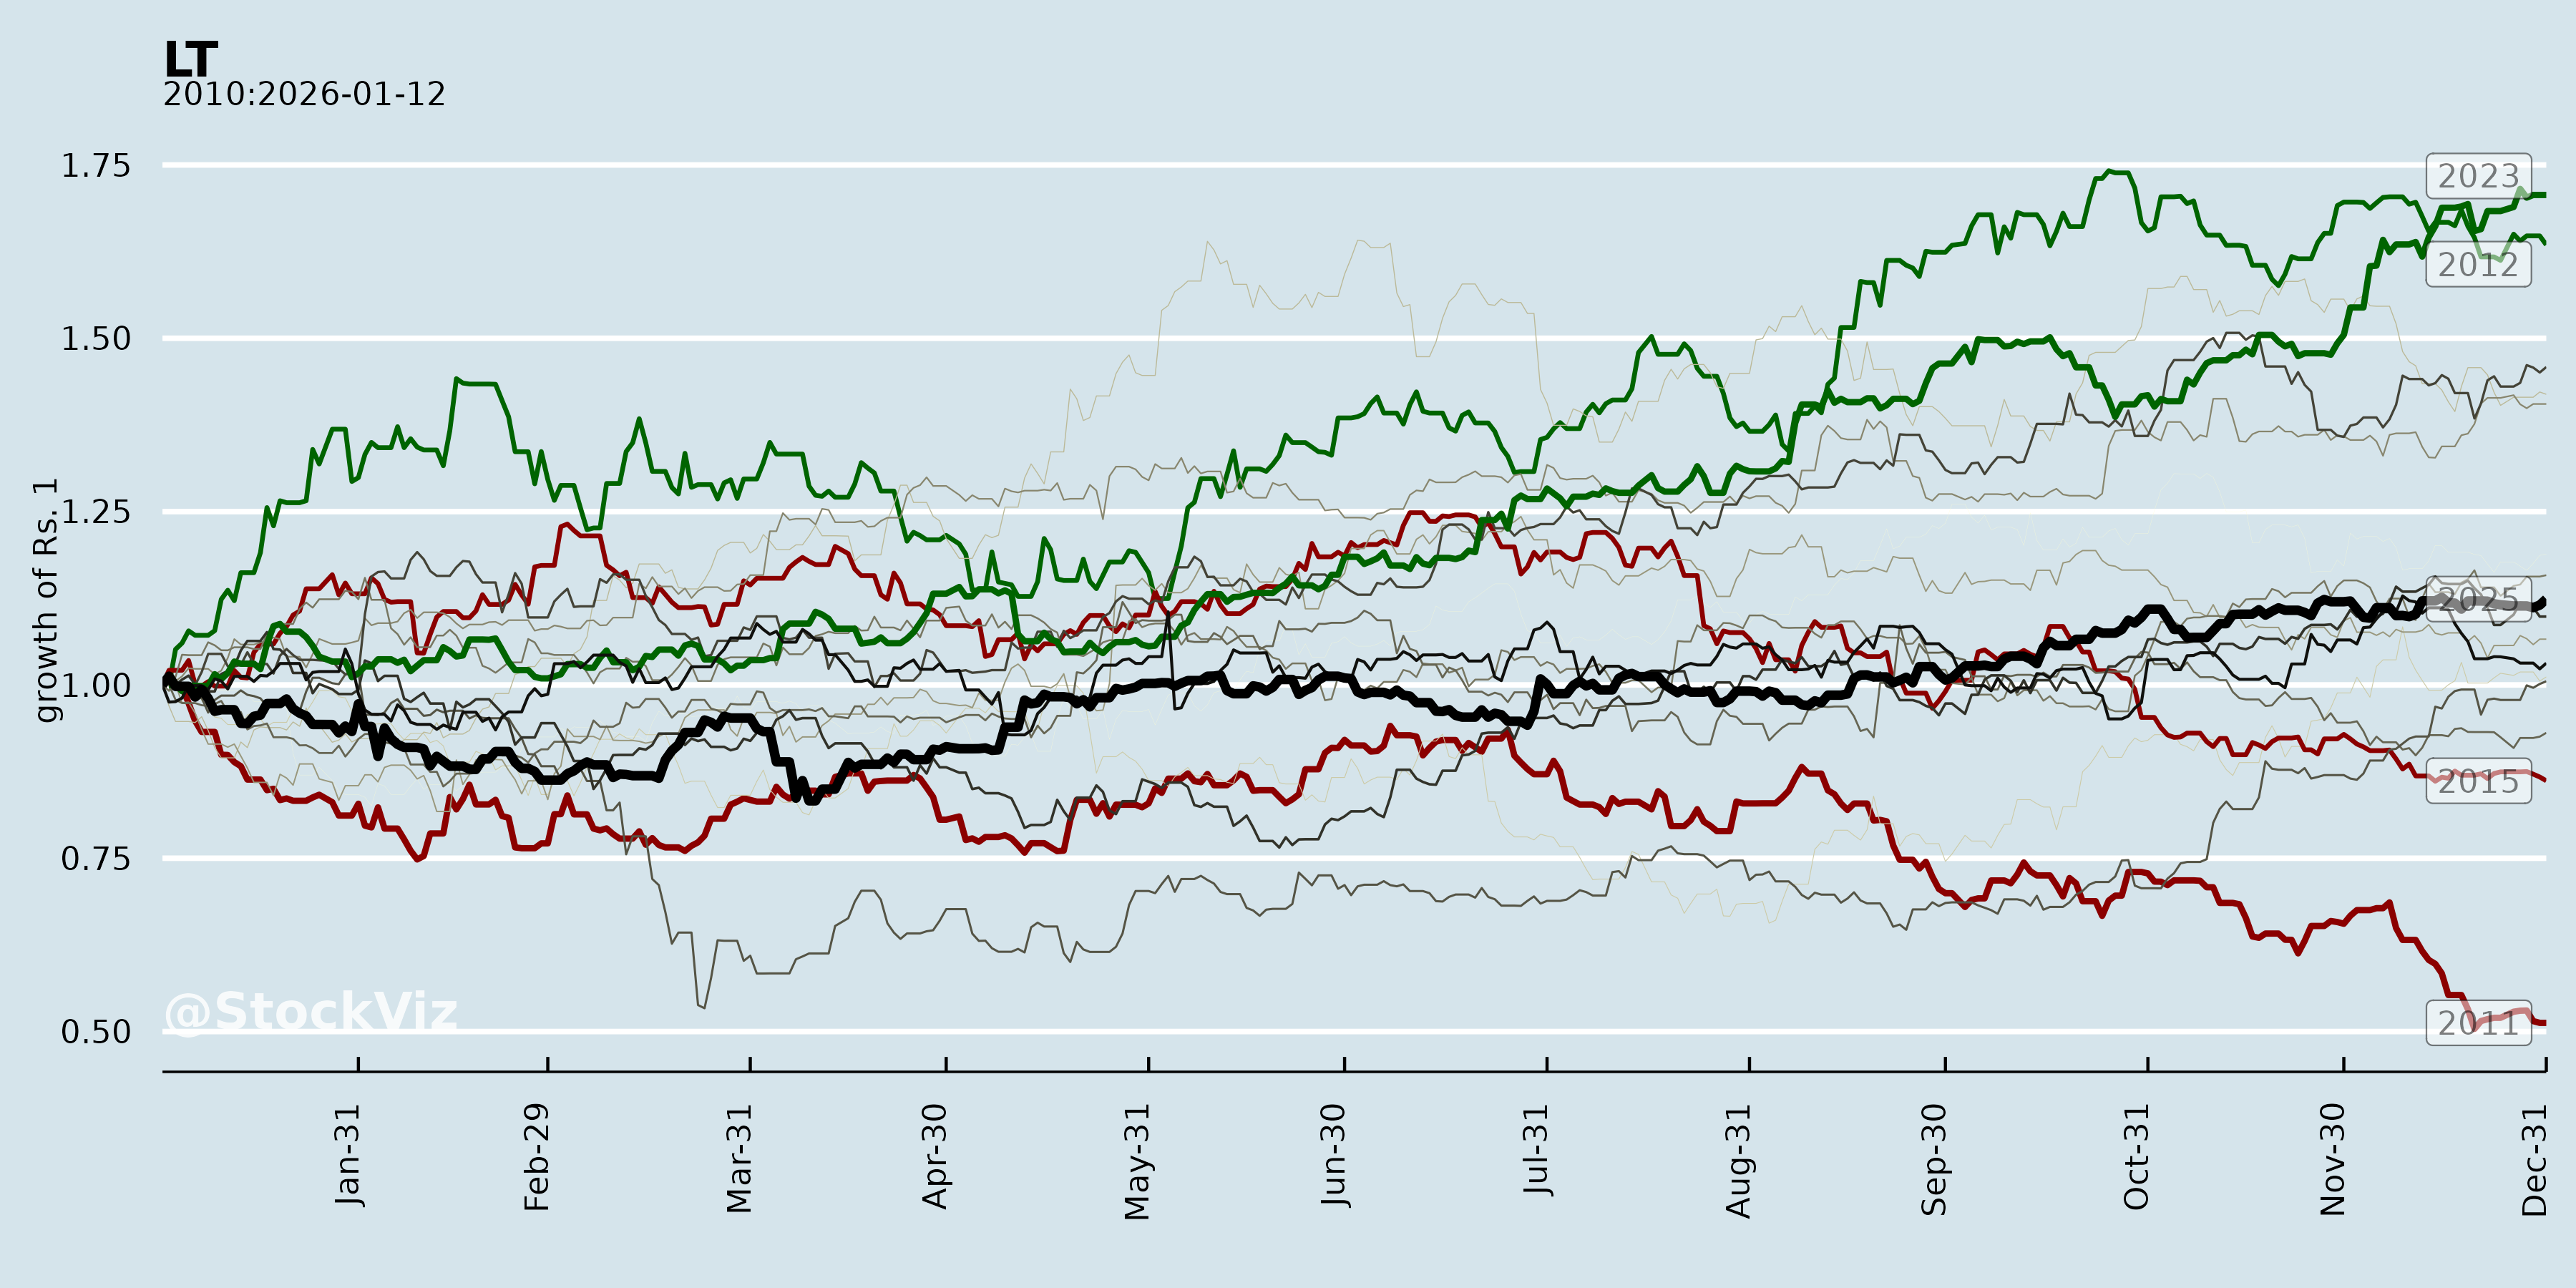
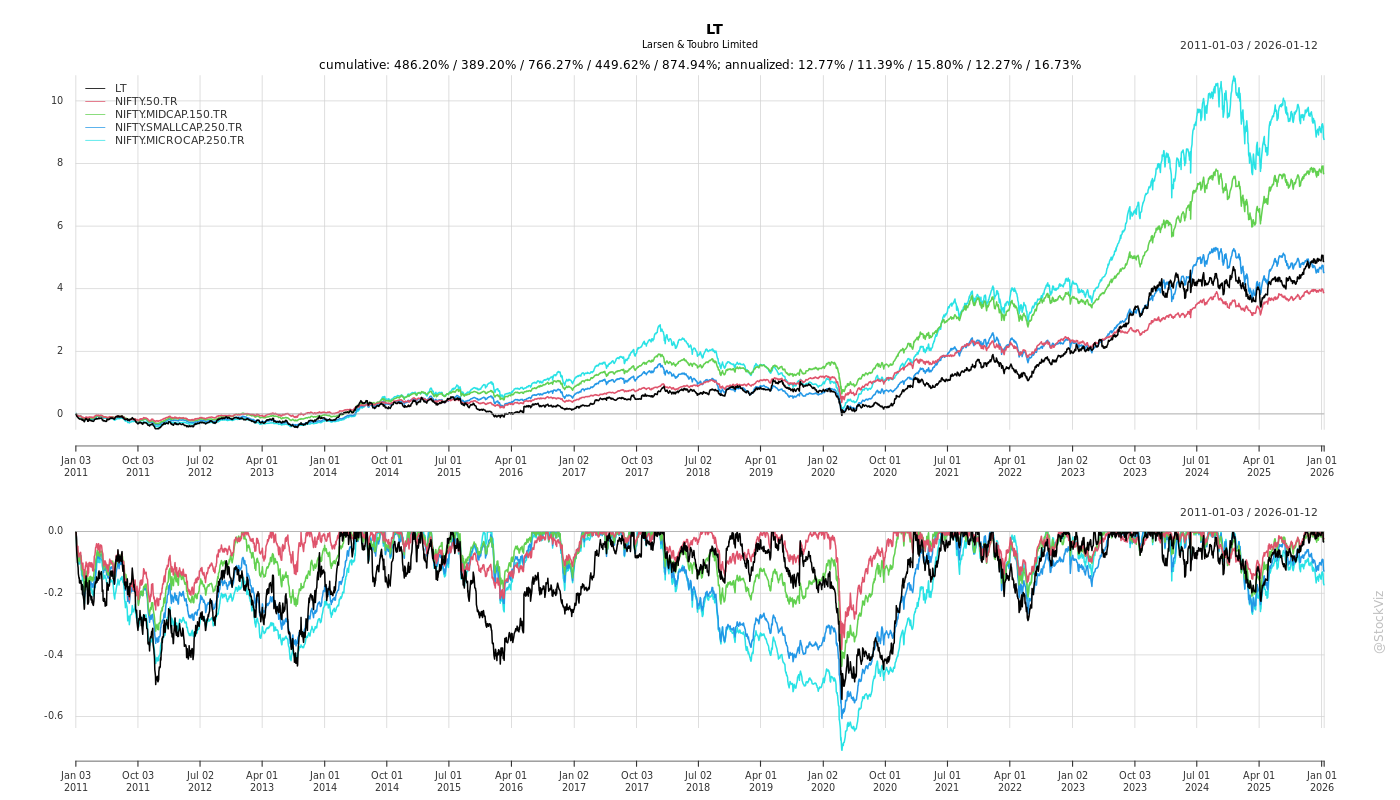
Cumulative Returns and Drawdowns
Fundamentals
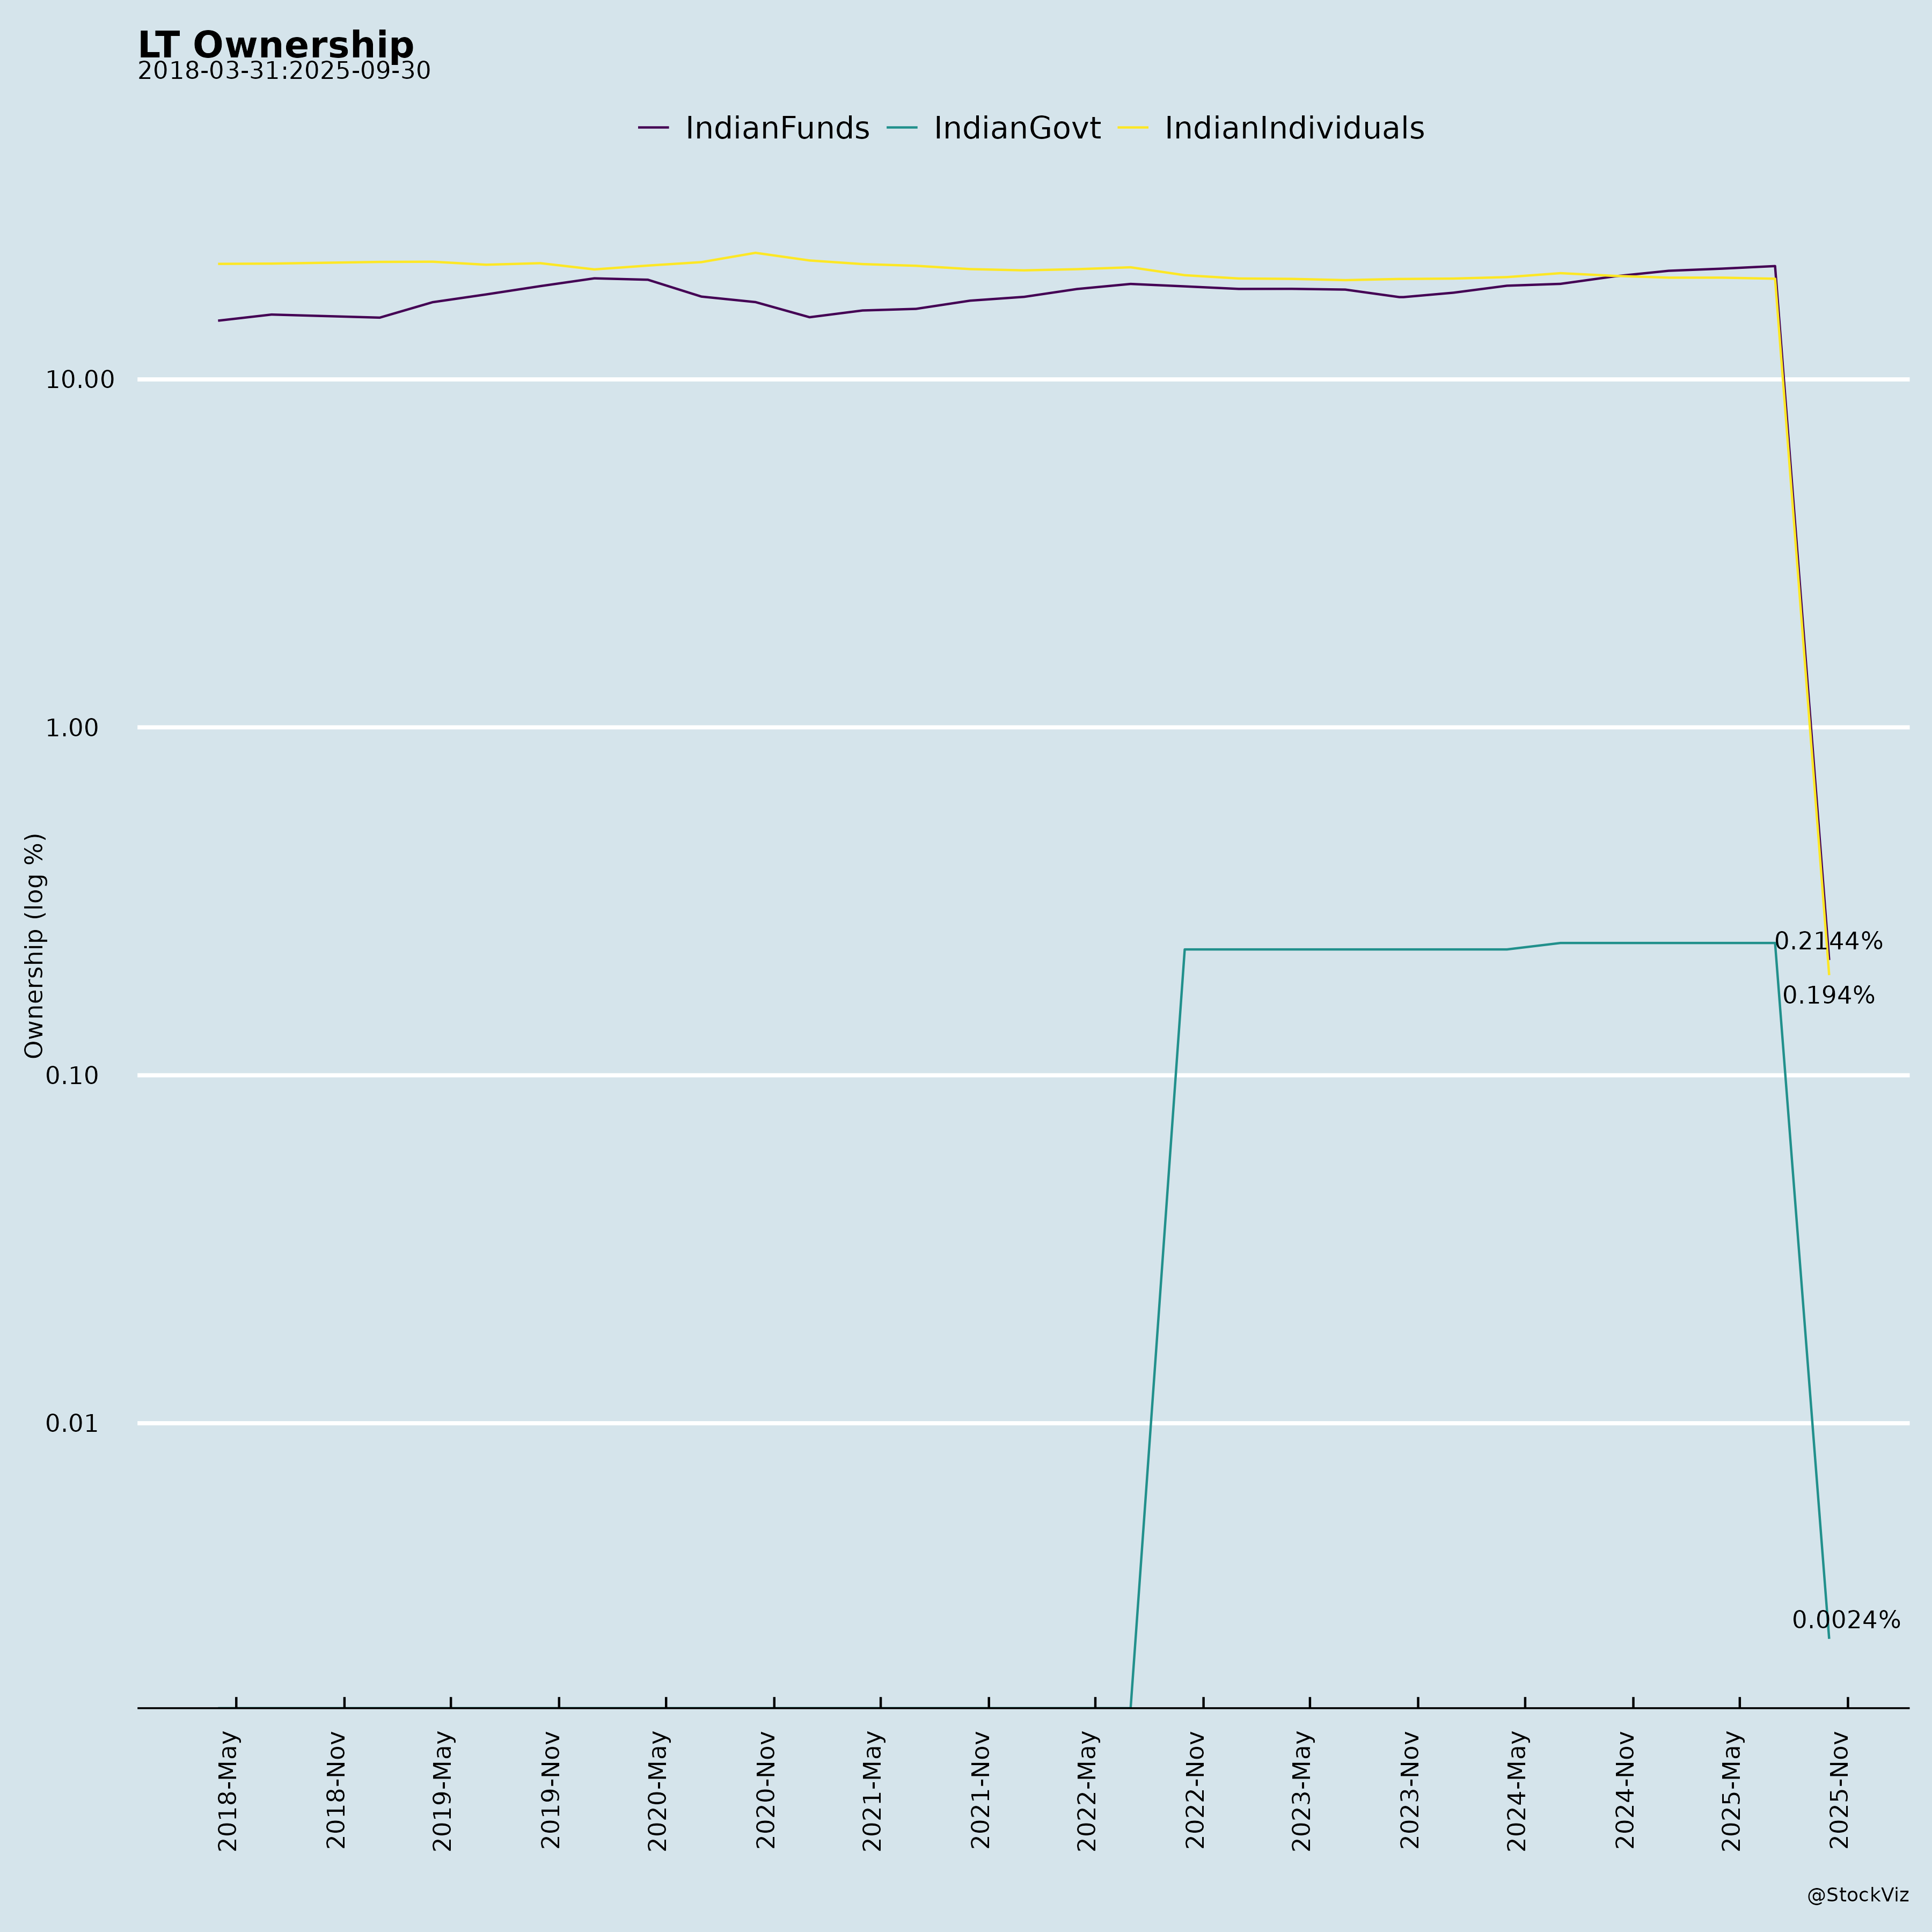
Ownership
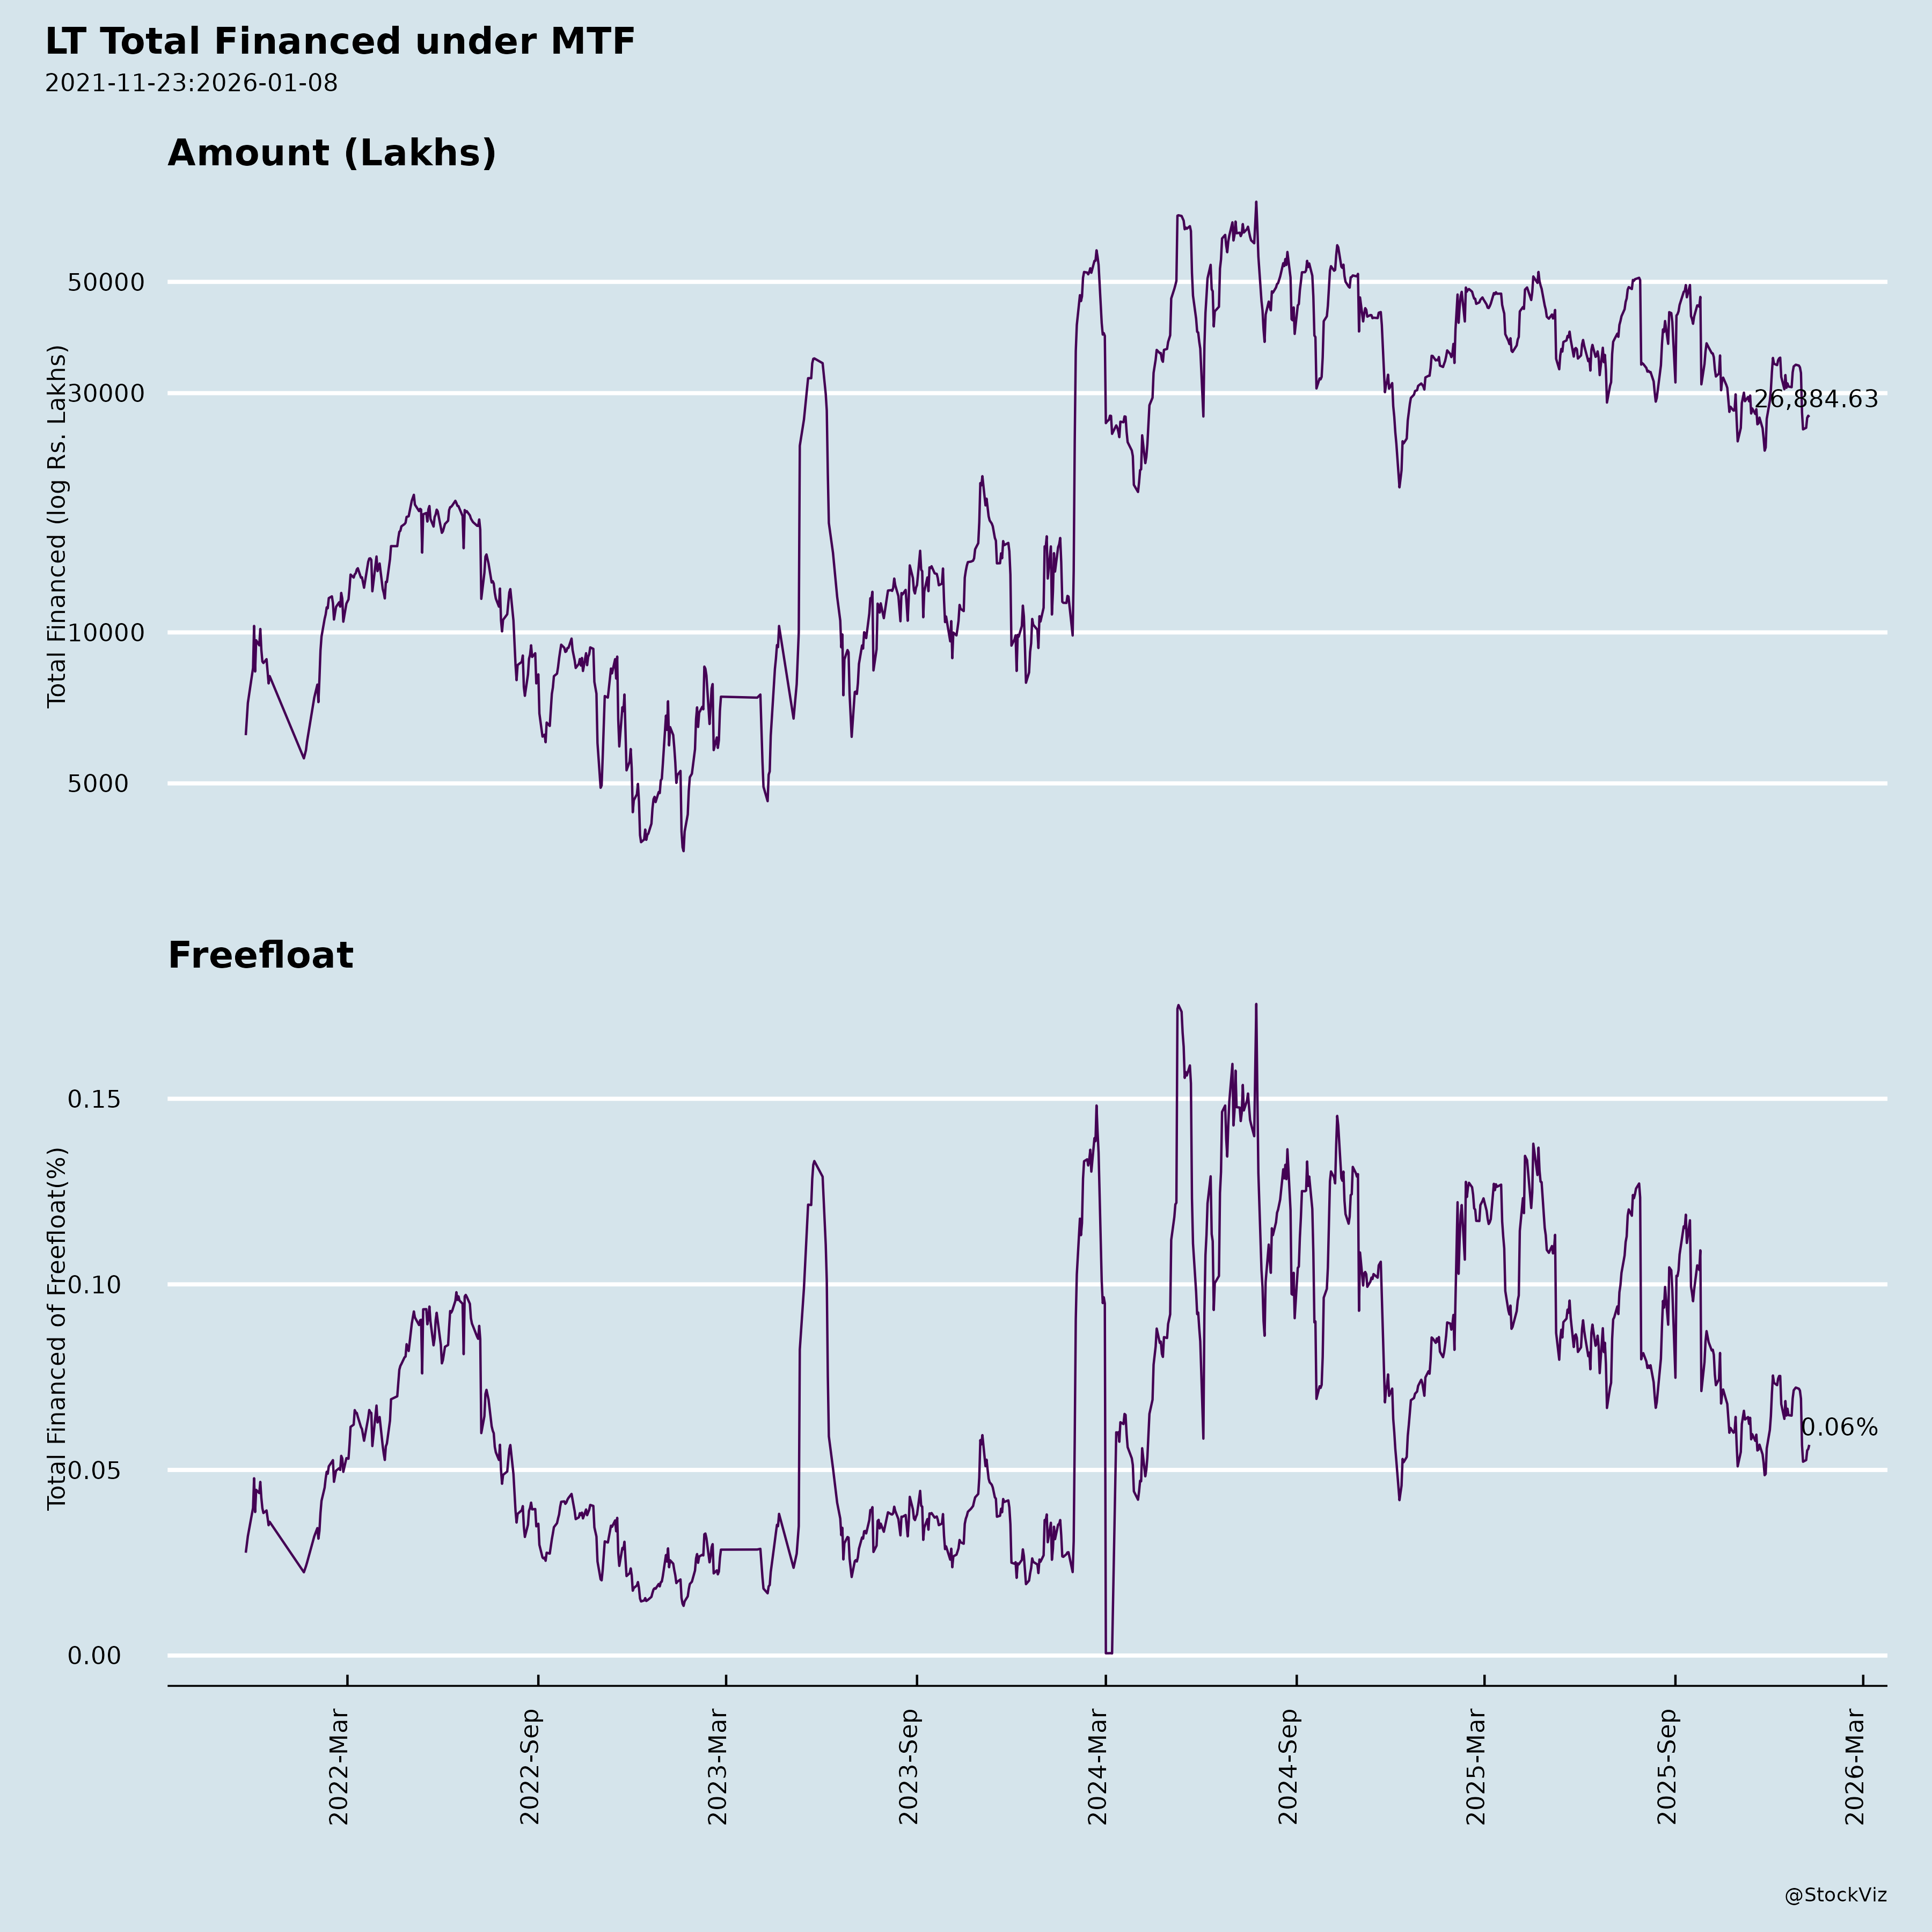
Margined
AI Summary
asof: 2025-12-03
Larsen & Toubro (LT) Analysis: Headwinds, Tailwinds, Growth Prospects, and Key Risks
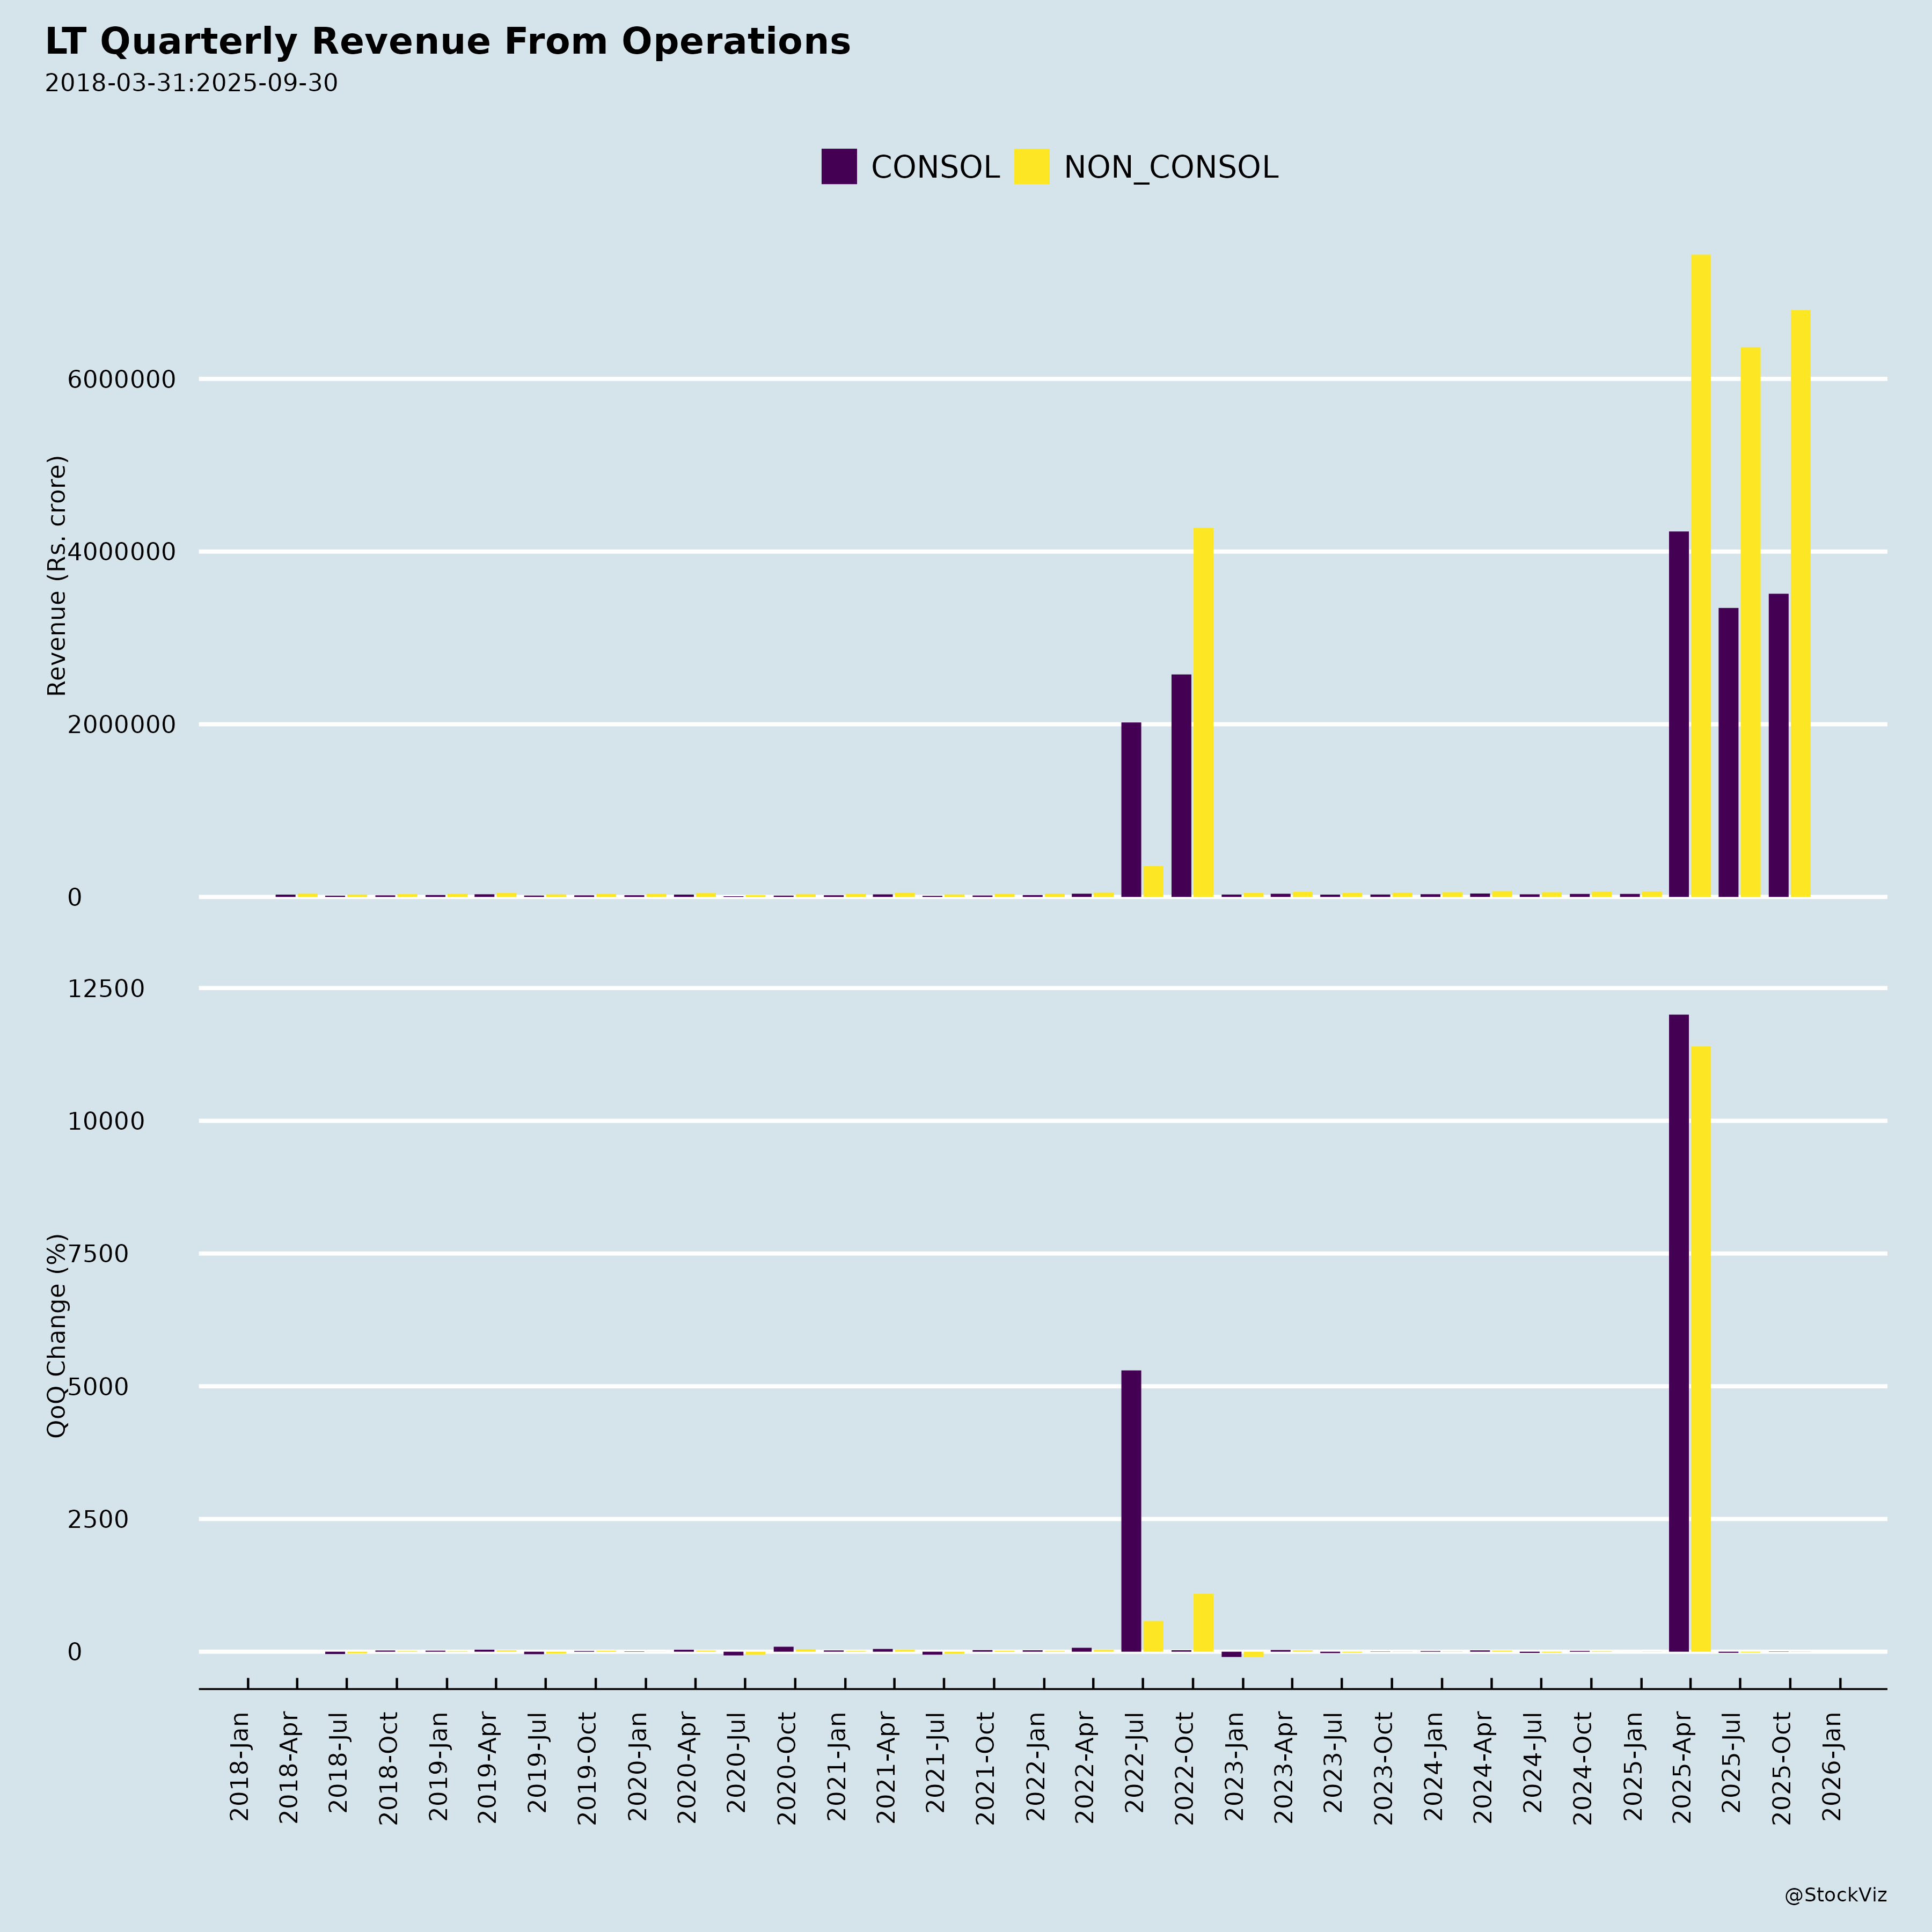
Larsen & Toubro (L&T), a leading Indian EPC, hi-tech manufacturing, and services conglomerate, reported robust H1 FY26 performance (ended Sep 30, 2025) with 39% YoY order inflow growth to ₹2.1 lakh Cr, 13% revenue growth to ₹1.32 lakh Cr, and 22% PAT growth to ₹7,543 Cr. Order book stands at ₹6.67 lakh Cr (+15% QoQ), with 49% international exposure. Recent wins include Saudi PT&D orders (Large* classification: ₹2,500-5,000 Cr) and a defence contract with BAE Systems for BvS10 vehicles. Below is a structured analysis based on the provided documents.
Tailwinds (Positive Drivers)
- Explosive Order Momentum: H1 inflows up 39% YoY (₹2.1 lakh Cr), Q2 +45% (₹1.16 lakh Cr). Key wins in infra (public spaces, metro, renewables), energy (hydrocarbon onshore/offshore), and international (59% of inflows, led by Middle East). Saudi PT&D orders (380kV GIS substation + 420km lines) align with NREP.
- Diversified, High-Visibility Order Book: ₹6.67 lakh Cr (+15% from Mar 2025), execution ramps to fuel multi-year revenue. Infra (59% of book), Energy (32%), with 49% international.
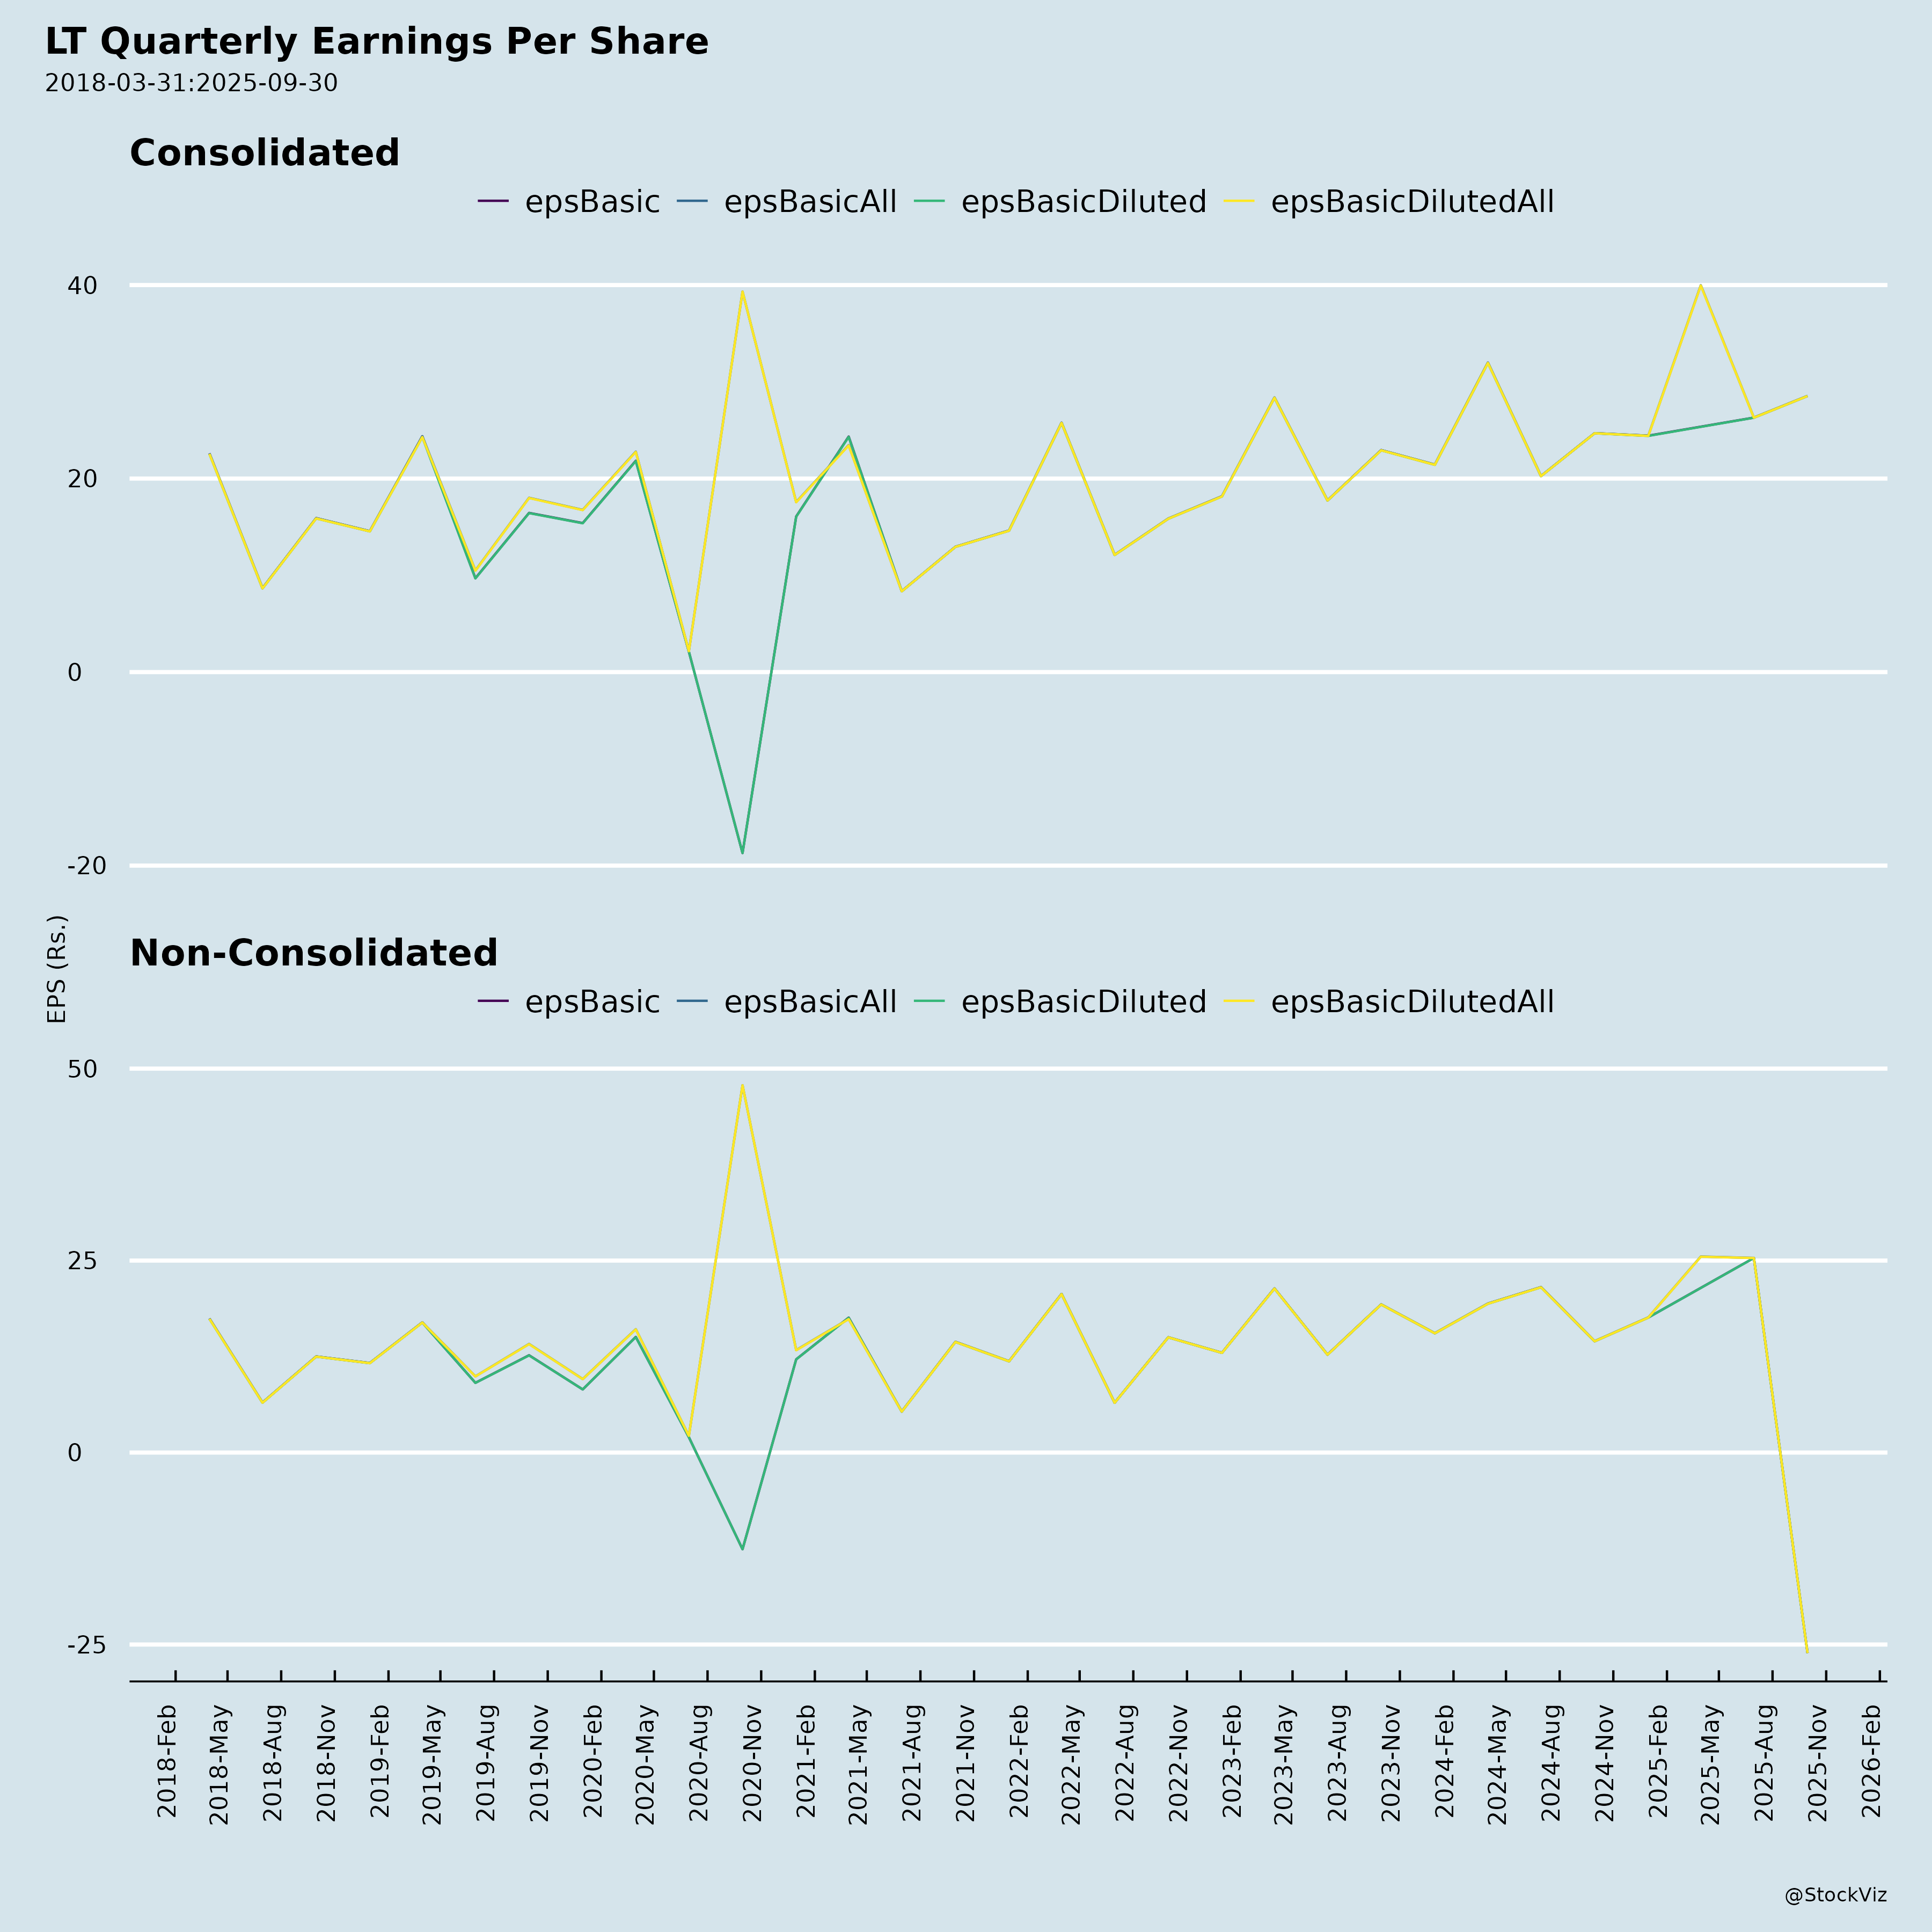
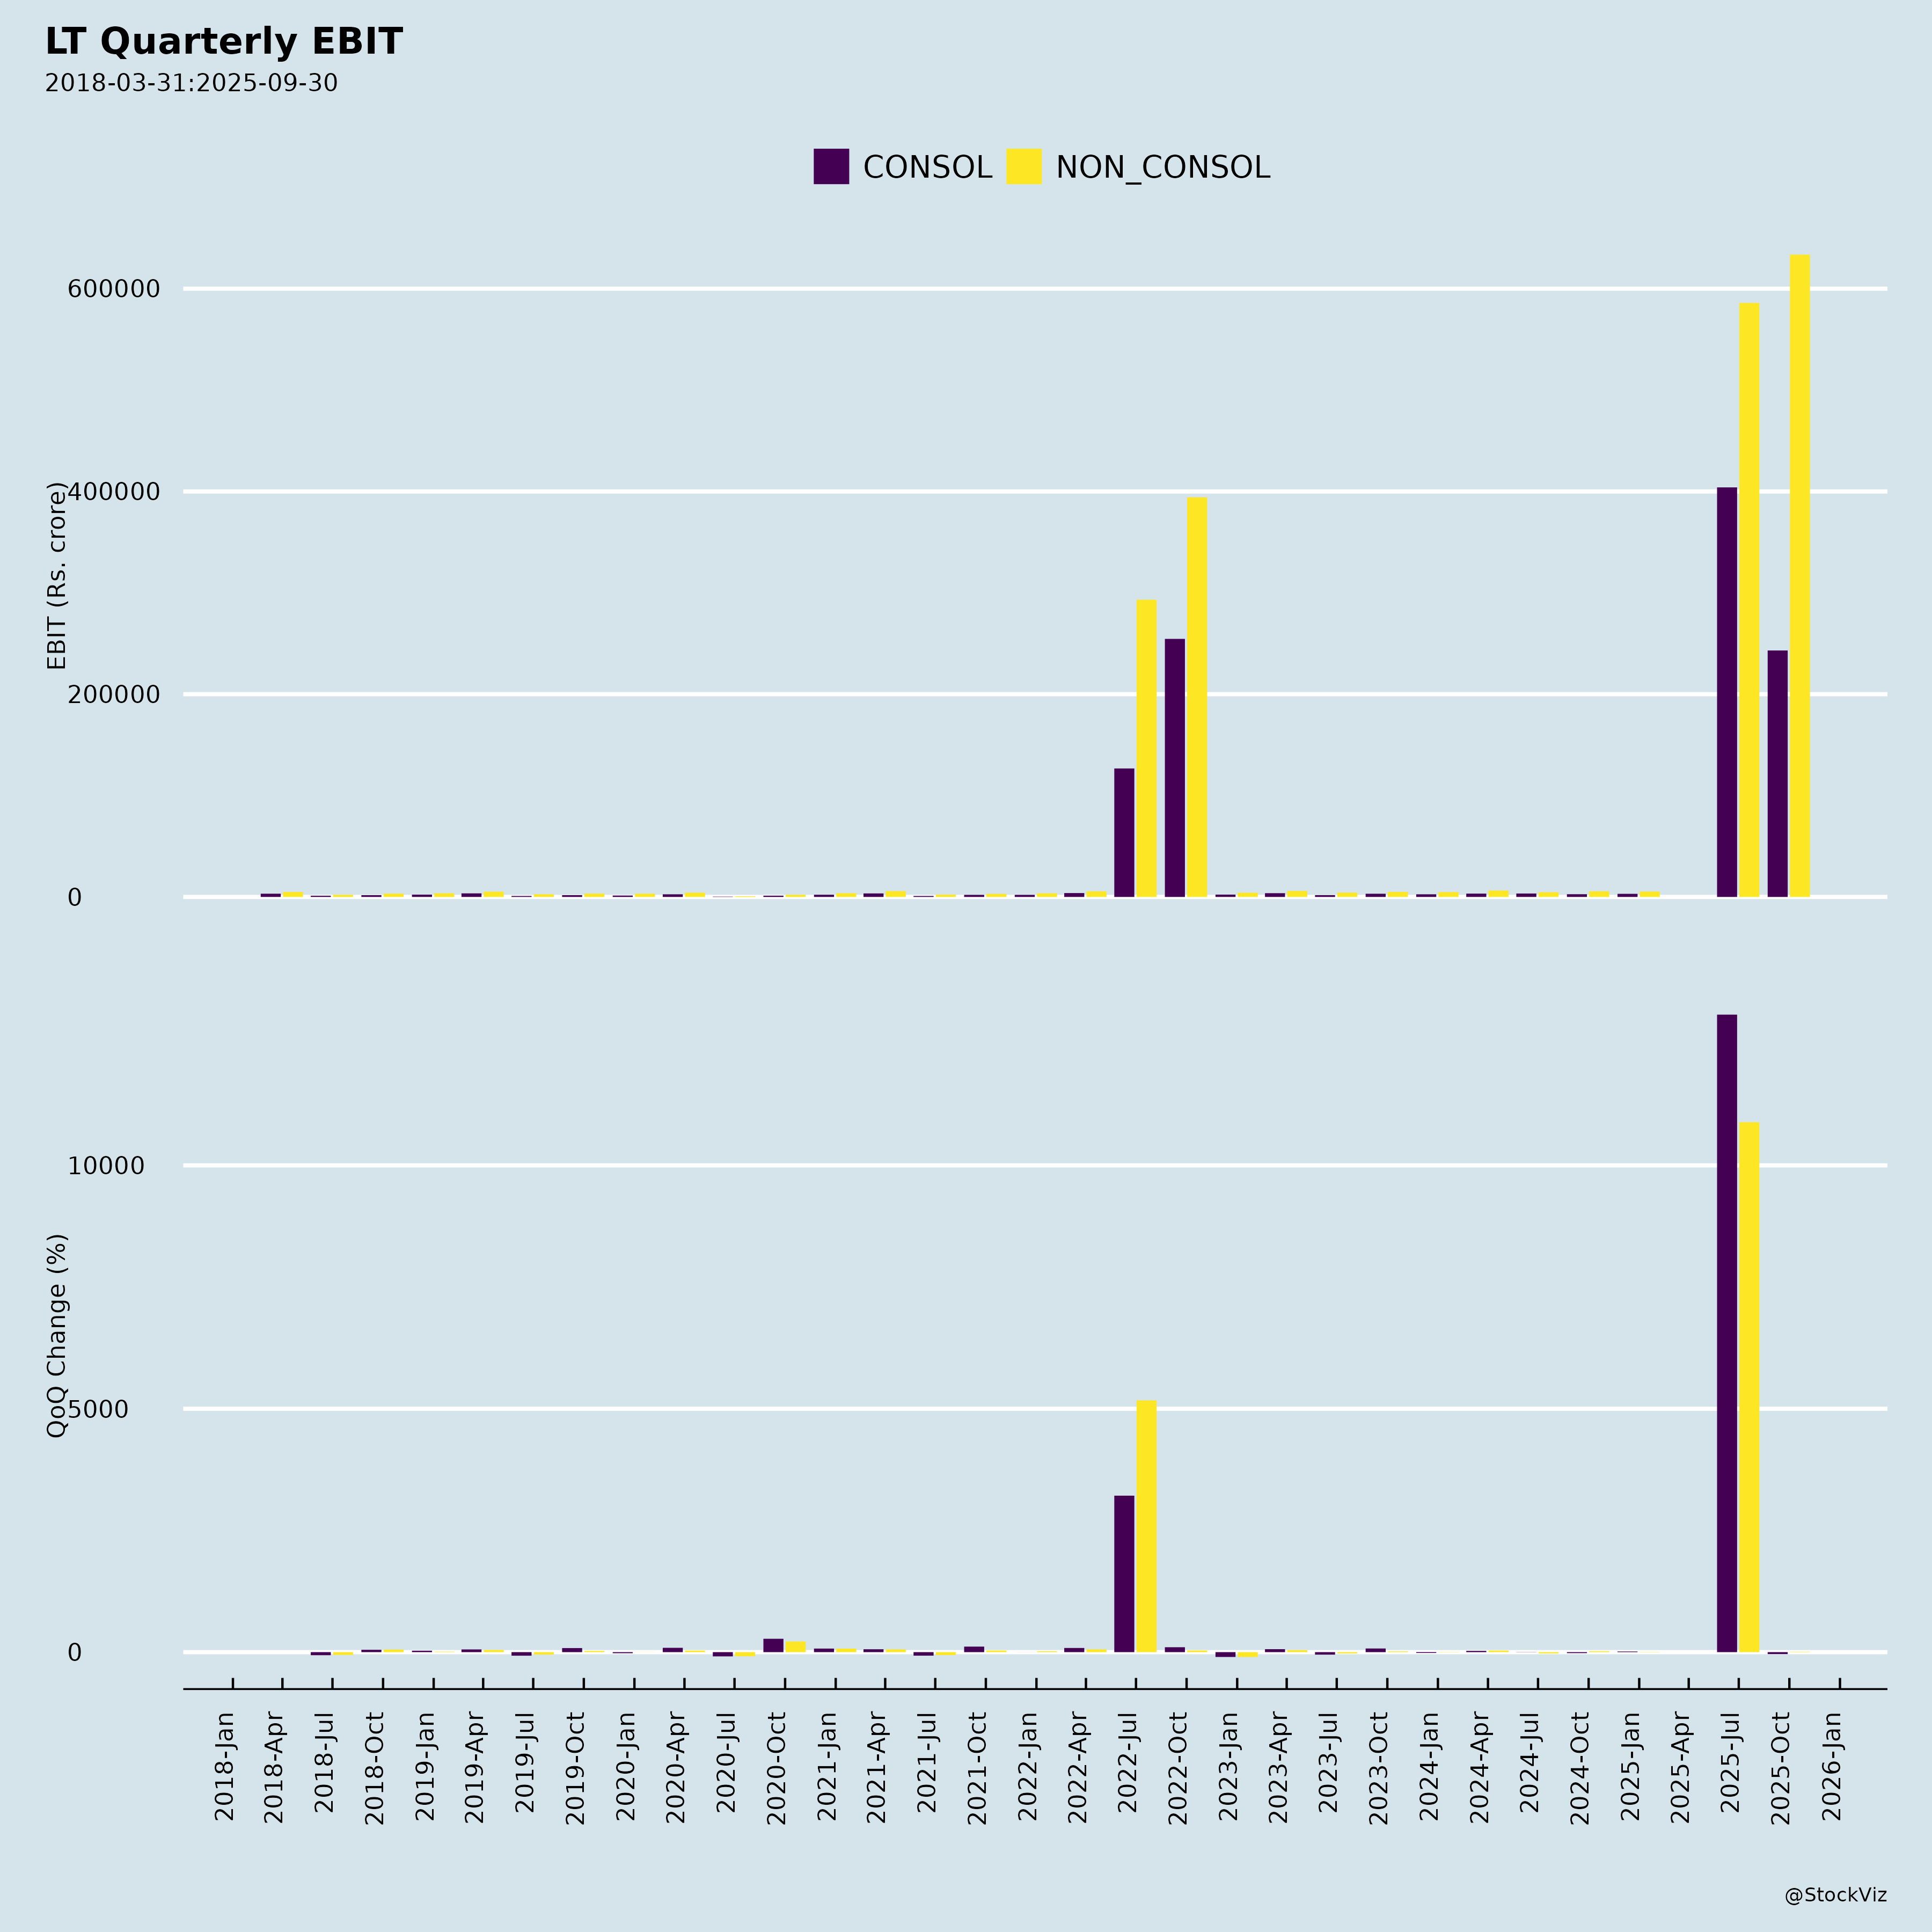
- Strong Financial Execution: Revenue +13% YoY (H1), PAT +22%. EBITDA margins stable at 10%. International revenue 54%. Hi-Tech Manufacturing margins expanded to 14.7%; IT&TS +13% revenue.
- Strategic Wins & Policy Support: Defence indigenization (BvS10 contract via Make in India). Divestment of Hyderabad Metro SPV (non-core exit under Lakshya 2026). Retail focus in L&T Finance (loan book +10% to ₹1.07 lakh Cr).
- Macro Tailwinds: India GDP 6.5-7% FY26; GCC stability (oil rebound, non-oil capex). Higher domestic/Middle East capex.
Headwinds (Challenges)
- Segment-Specific Slowdowns: Infra revenue flat (-1% Q2 YoY) due to extended monsoons and water project delays. Hi-Tech orders -34% YoY (deferrals). “Others” revenue -14% (lower realty handovers).
- Margin Pressures: Energy EBITDA margin down to 7.3% (from 8.9%) due to project closure variations. IT&TS margins dipped to 20.2% (incubated businesses). Overall EBITDA % slightly down to 10%.
- Standalone Impairment Hit: Q2 exceptional loss of ₹5,413 Cr (impairment in Hyderabad Metro SPV ahead of divestment), leading to standalone PAT loss of ₹3,591 Cr (group PAT unaffected).
- Execution & External Delays: Slower water/infra progress; Development Projects EBIT down (provision for Nabha Power sub-judice matter).
- Global Macro: Trade protectionism, regional conflicts capping global GDP at ~3%; policy uncertainties impacting supply chains.
Growth Prospects
| Driver | Key Metrics/Opportunities | Potential Impact |
|---|---|---|
| Order Book Execution | ₹6.67 lakh Cr (15%+ growth); Infra/Energy ramps. | 12-15% revenue CAGR FY26-27; International 50%+ mix. |
| International Expansion | 59% inflows, 54% revenue from Middle East/Saudi (NREP, grid upgrades). | Sustained 40%+ order growth; GCC capex rebound. |
| High-Margin Segments | Hi-Tech (14.7% margins, defence like BvS10); IT&TS (₹25,893 Cr H1 inflows, +13% rev.); Renewables/Electrolysers. | 20%+ PAT CAGR; Emerging tech (semiconductors, data centers). |
| Defence & New Biz | BvS10 licensing (Hazira plant); Make in India. | Multi-year contracts; Hi-Tech order rebound. |
| Deleveraging/Non-Core Exit | Metro divestment; Retail finance growth (98% loan book). | ROE improvement; Focus on EPC core. |
| Outlook | India infra capex + GCC stability. | FY26 revenue +12-15%, PAT +20% (consensus-aligned). |
- Long-Term: Lakshya 2026 targets sustainable growth via tech-led biz (IT&TS, semiconductors). Order pipeline strong across geographies/segments.
Key Risks
| Risk Category | Details | Mitigants |
|---|---|---|
| Execution | Project delays (monsoons, variations); Infra/Energy complexity. | ₹6.67 lakh Cr book; Proven track record (8 decades). |
| Geopolitical/Macro | Middle East/Intl exposure (49-59%); Global trade wars/conflicts. | Diversified (India 51%); GCC stability. |
| Margins/Finance | Variation costs, finance costs (down 12% but ₹1,544 Cr H1); Debt/Equity 1.09. | EBITDA stability; Loan book growth in Finance. |
| Regulatory/Legal | Sub-judice (Nabha Power provision); Divestment pre-conditions. | One-off; Strong compliance (Reg 30 disclosures). |
| Segment/Cyclical | Order deferrals (Hi-Tech); Realty/inventory slowdowns. | Broad portfolio; 39% inflow growth offsets. |
| Currency/Commodity | Intl revenue (56%); Raw material volatility. | Hedging; 10% op margin resilience. |
Overall Summary: L&T exhibits strong tailwinds from order frenzy (39% growth), diversified execution, and policy-aligned wins (Saudi PT&D, BvS10), positioning it for 12-15% revenue/PAT growth FY26 amid India/GCC capex. Headwinds like infra delays and margin dips are manageable vs. high-visibility book. Risks center on execution/geopolitics but are mitigated by scale/balance sheet. Bullish outlook; stock likely to re-rate on order quality/international momentum (target multiples: 25-30x FY27 EPS). Monitor Q3 execution and divestment closure. (Data as of Oct/Nov 2025 filings).
Copyright © 2023 SAS Data Analytics Pvt. Ltd. All rights reserved.