LODHA
Equity Metrics
October 23, 2026
Lodha Developers Limited
Residential Commercial Projects
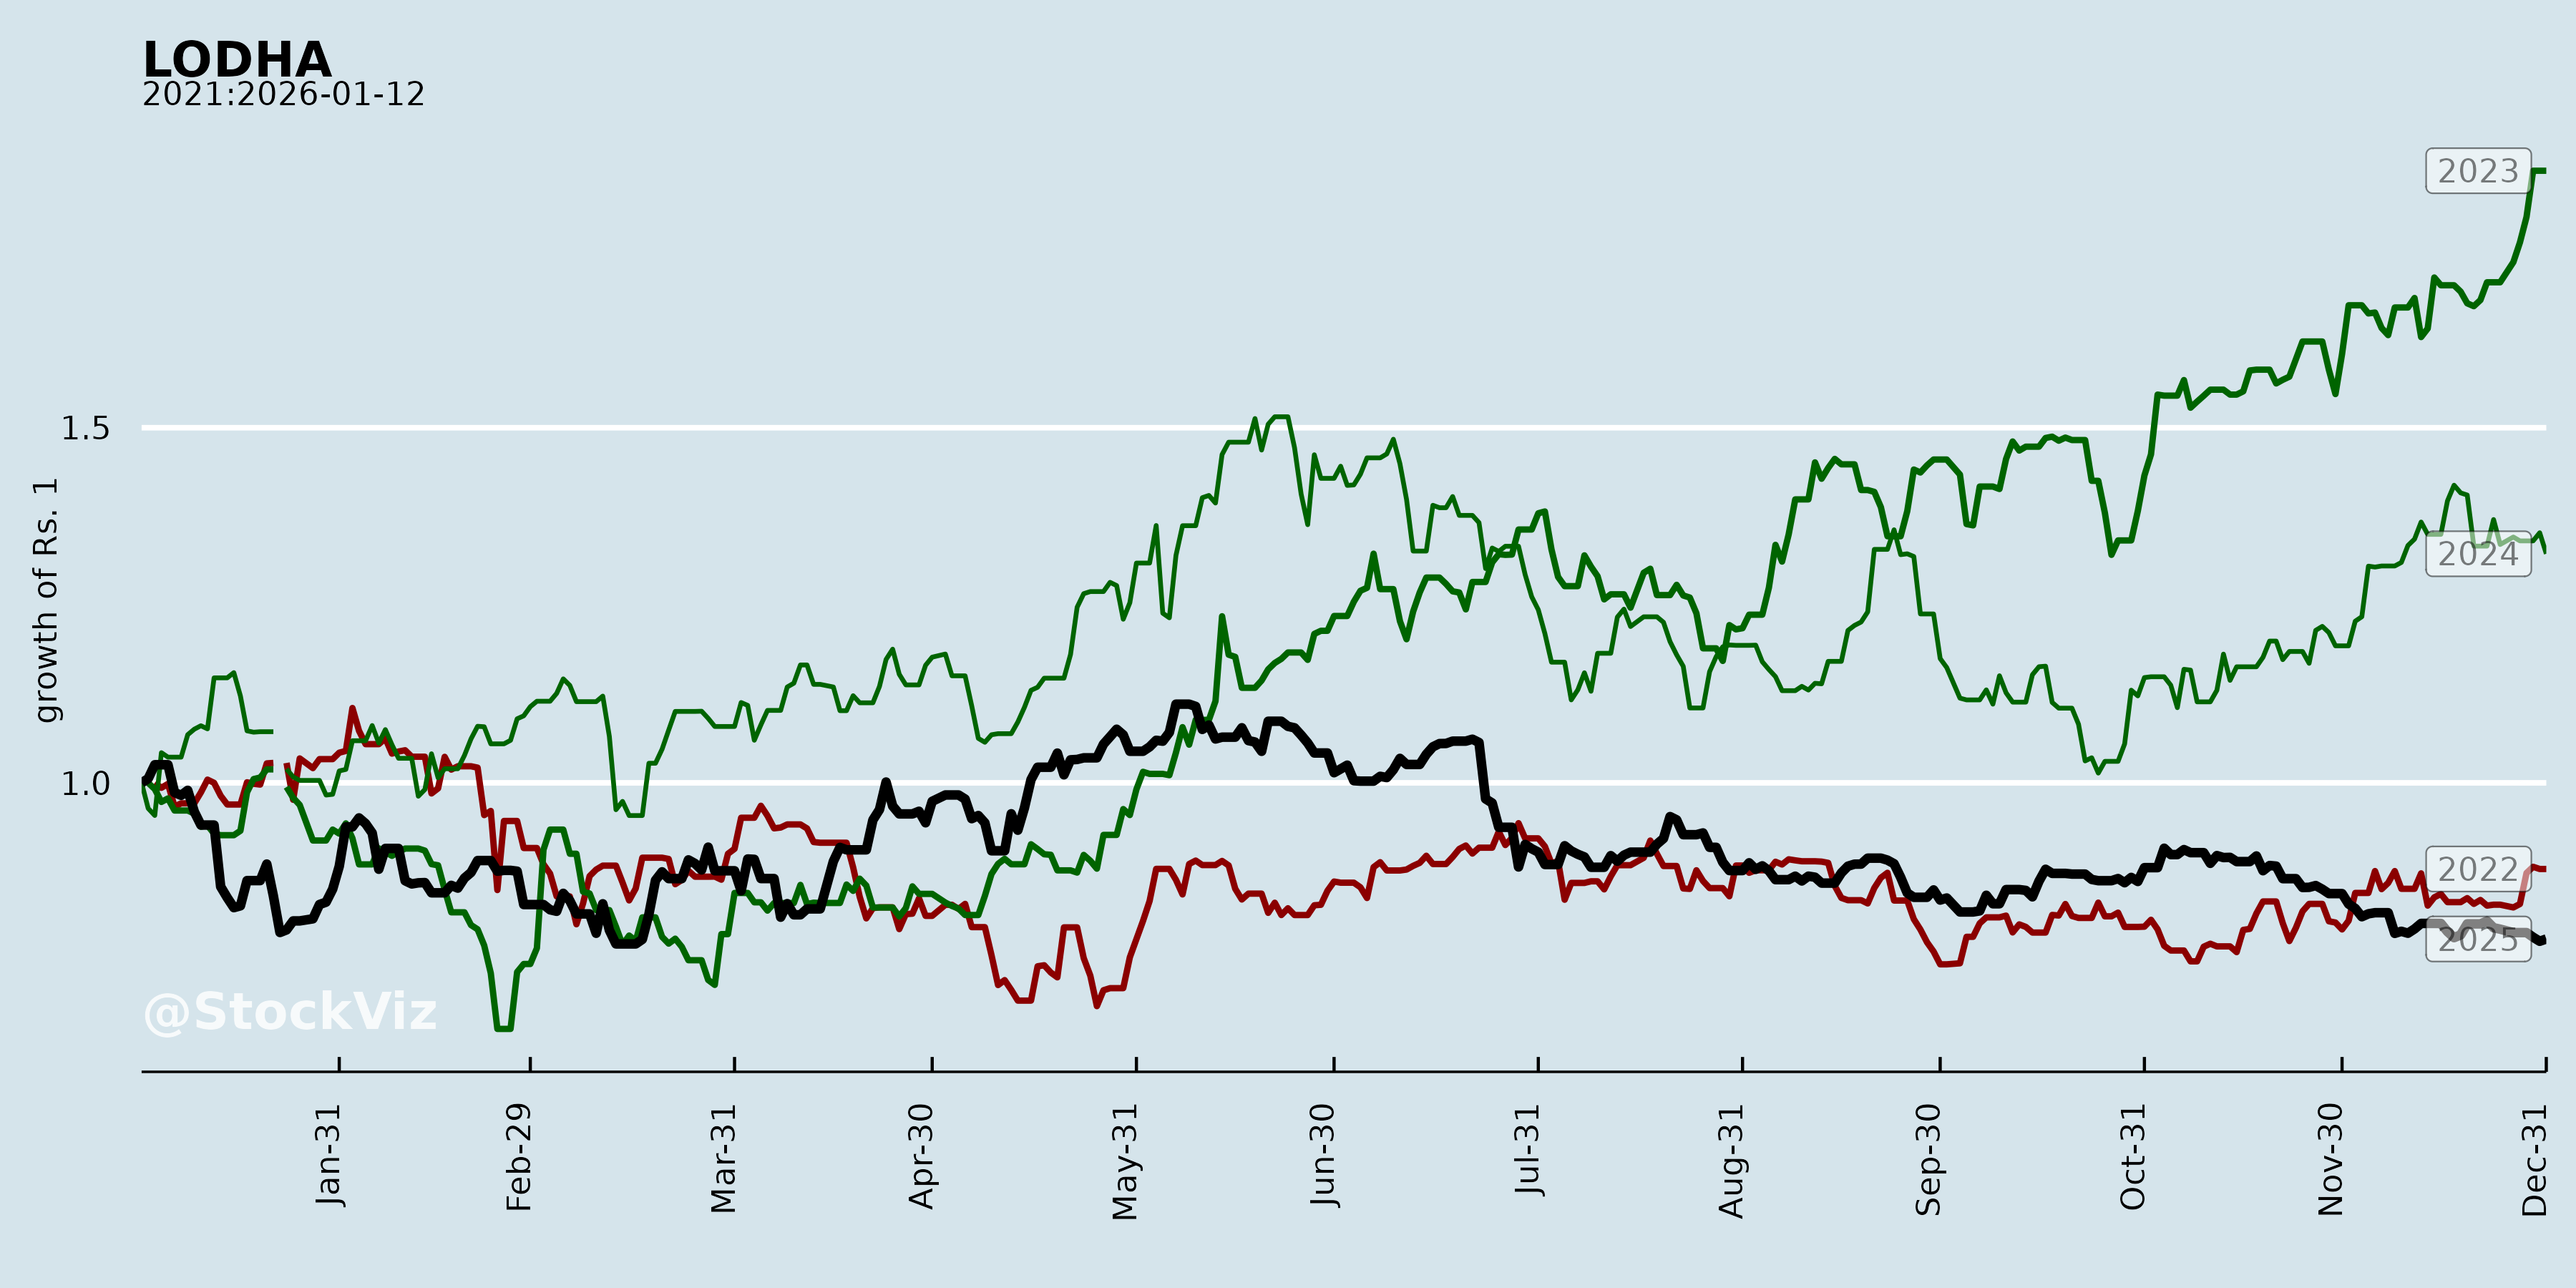
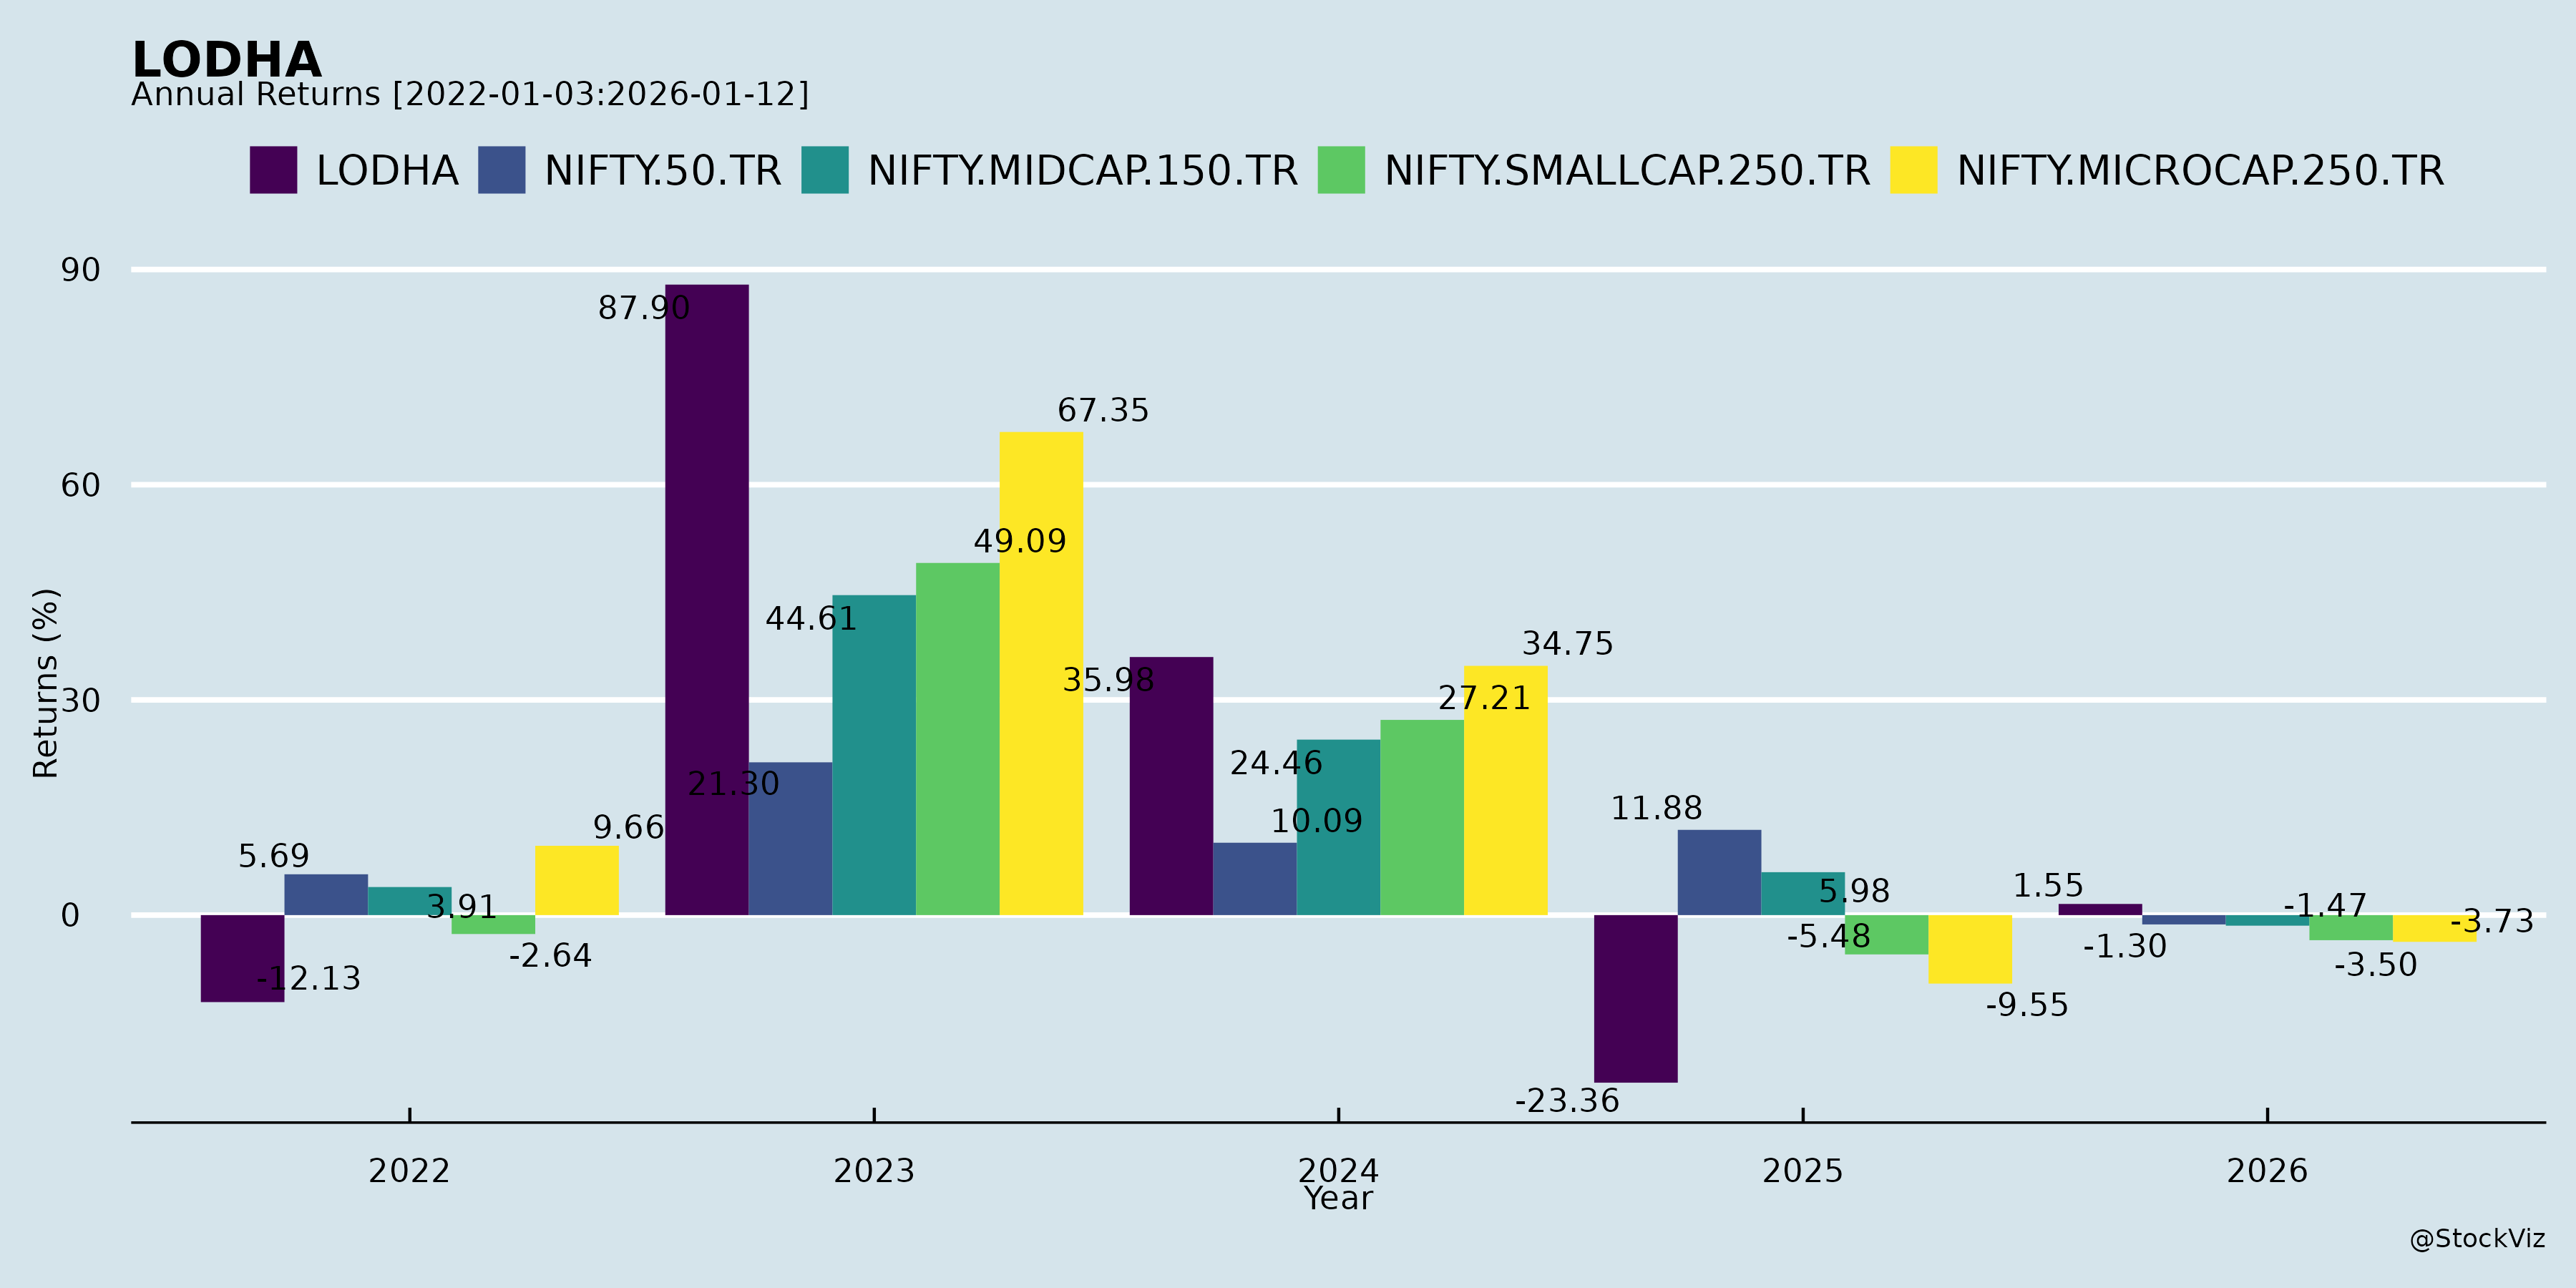
Annual Returns
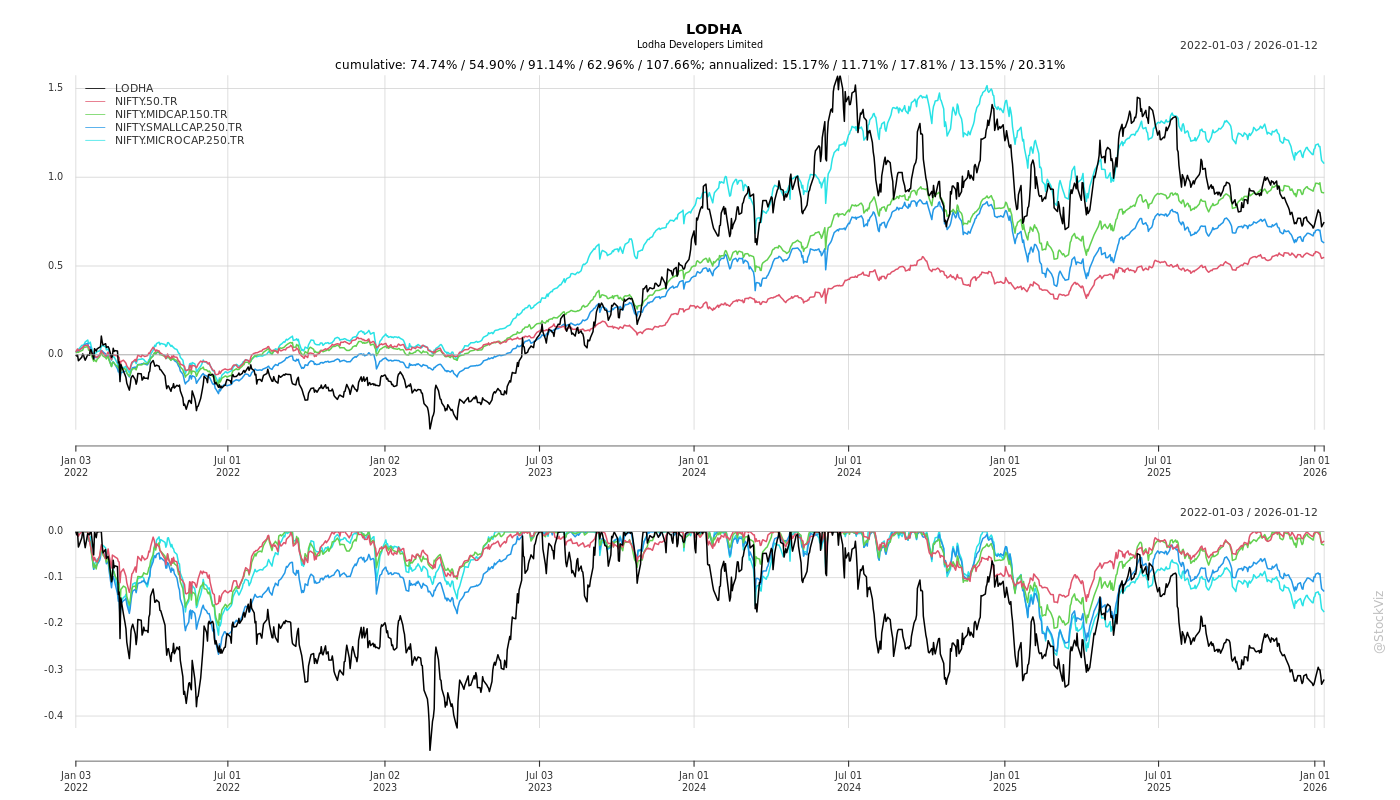
Cumulative Returns and Drawdowns
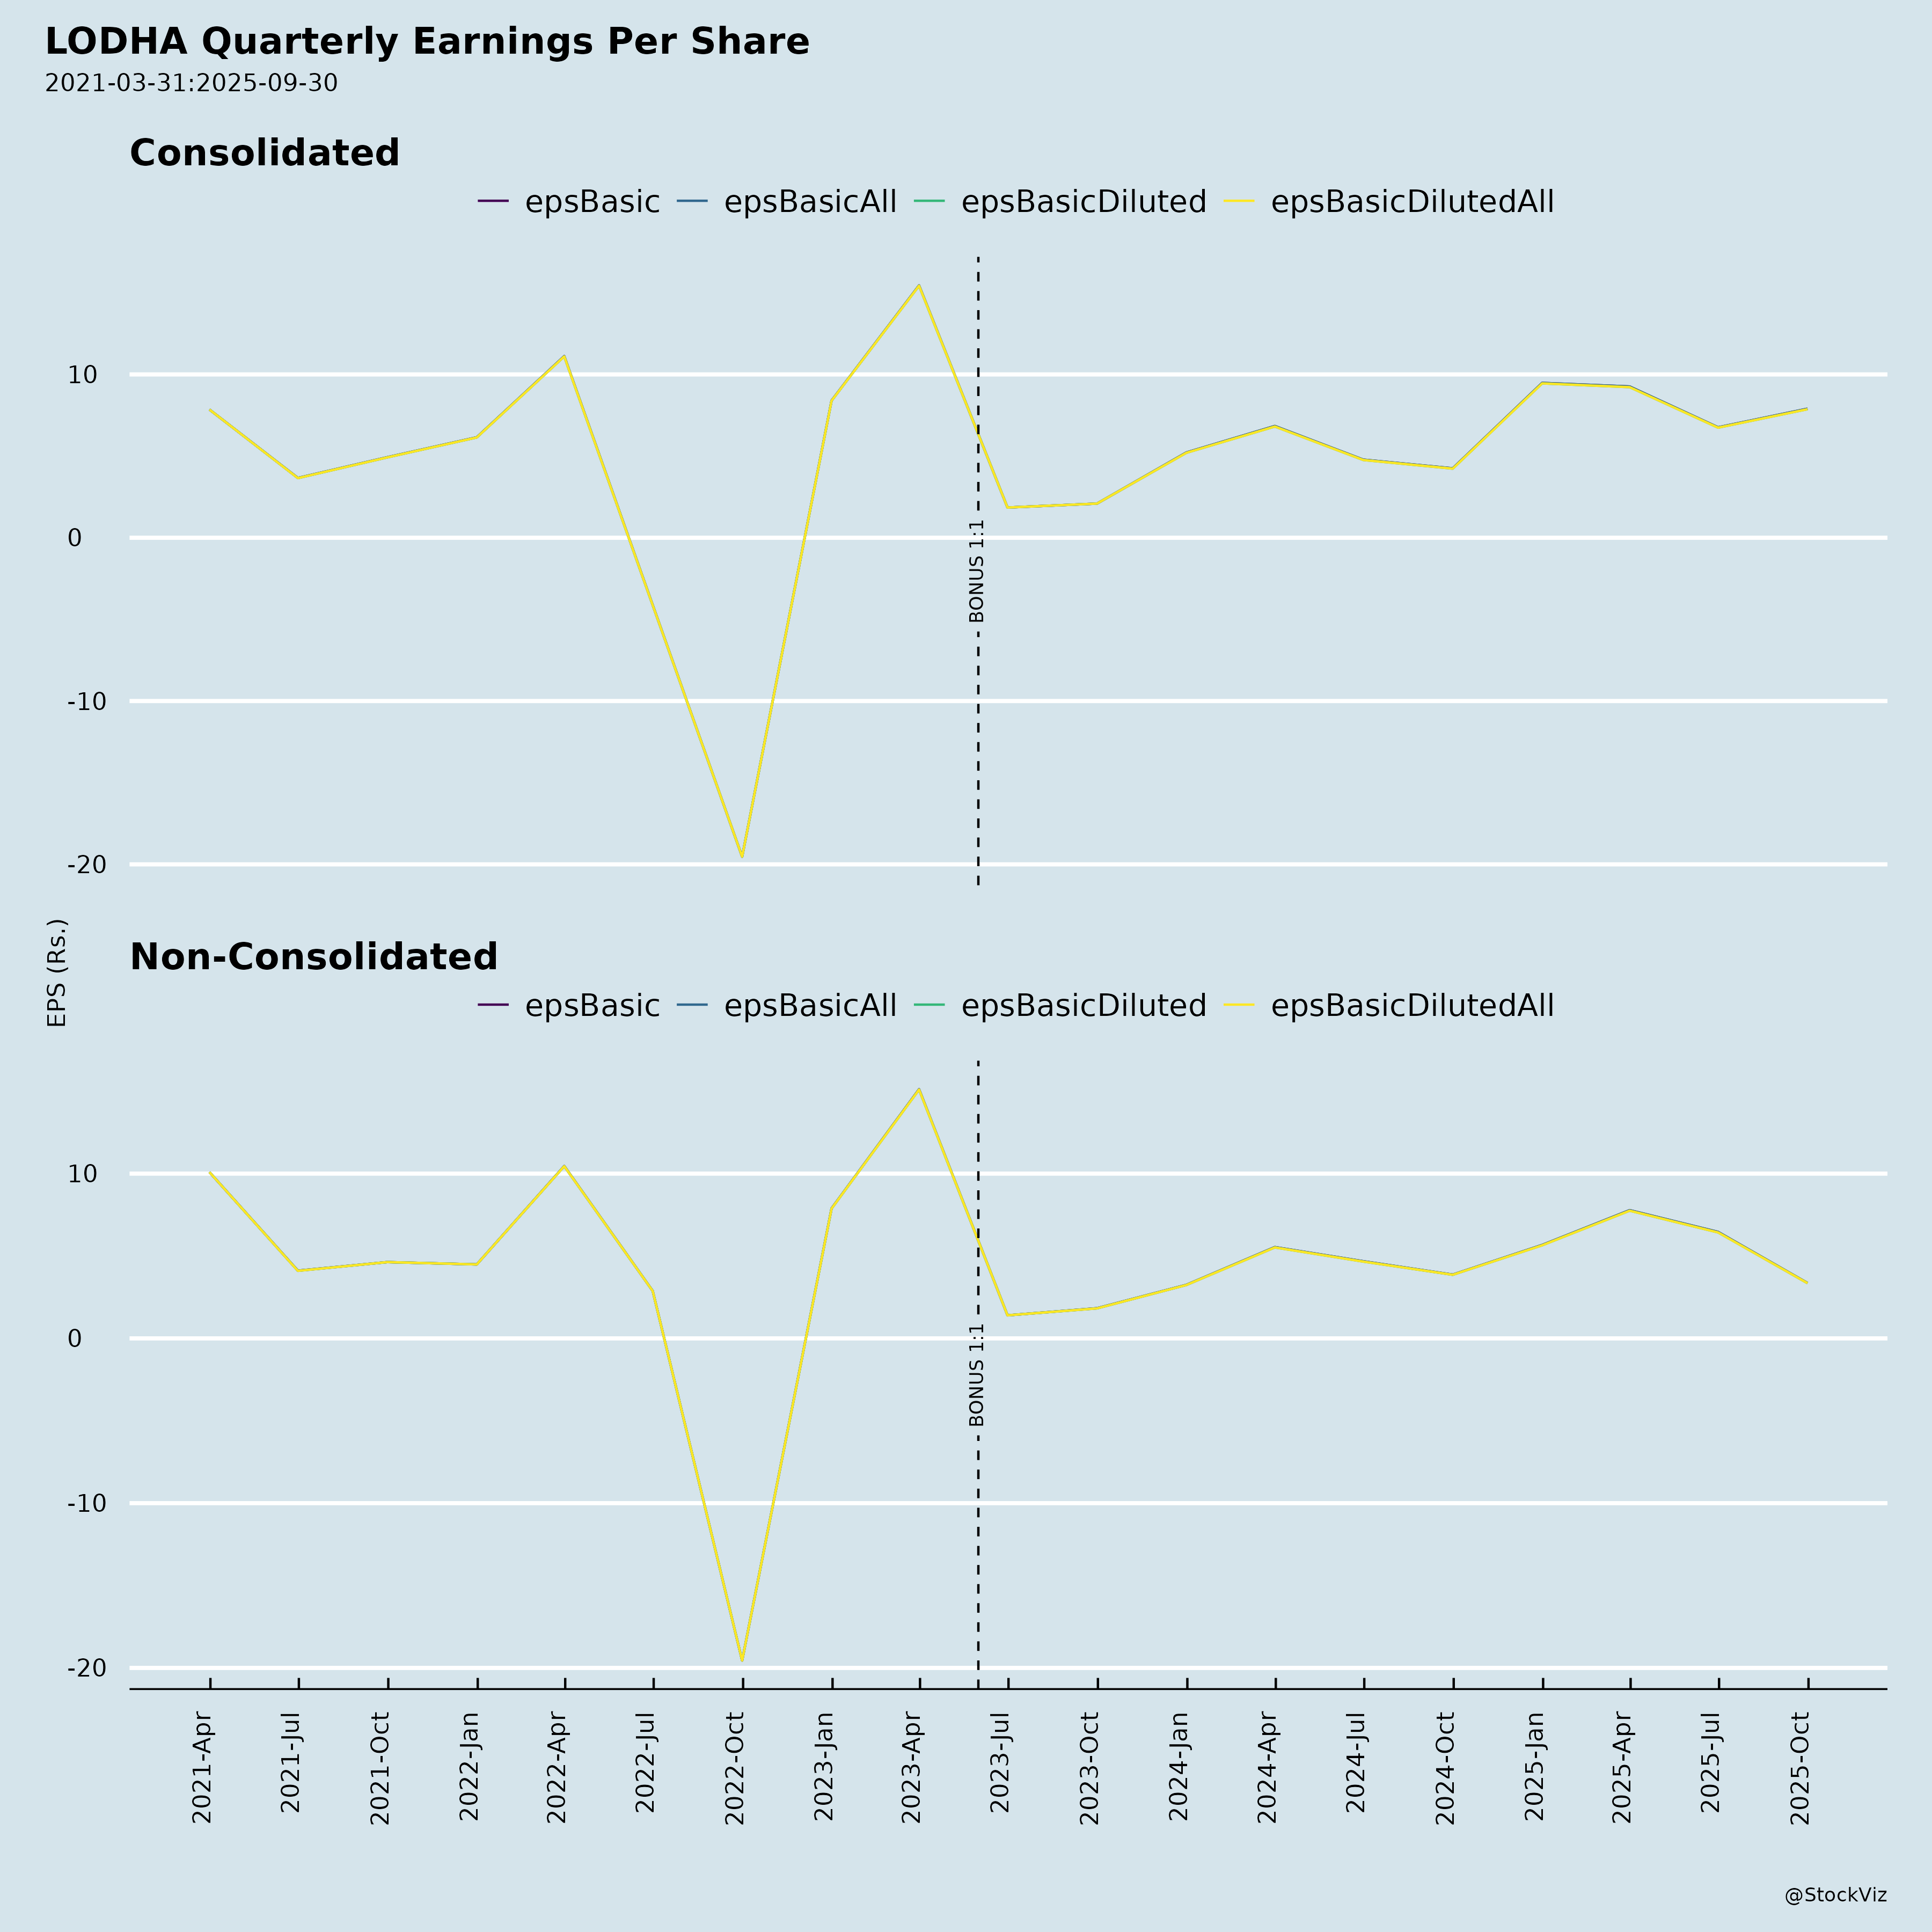
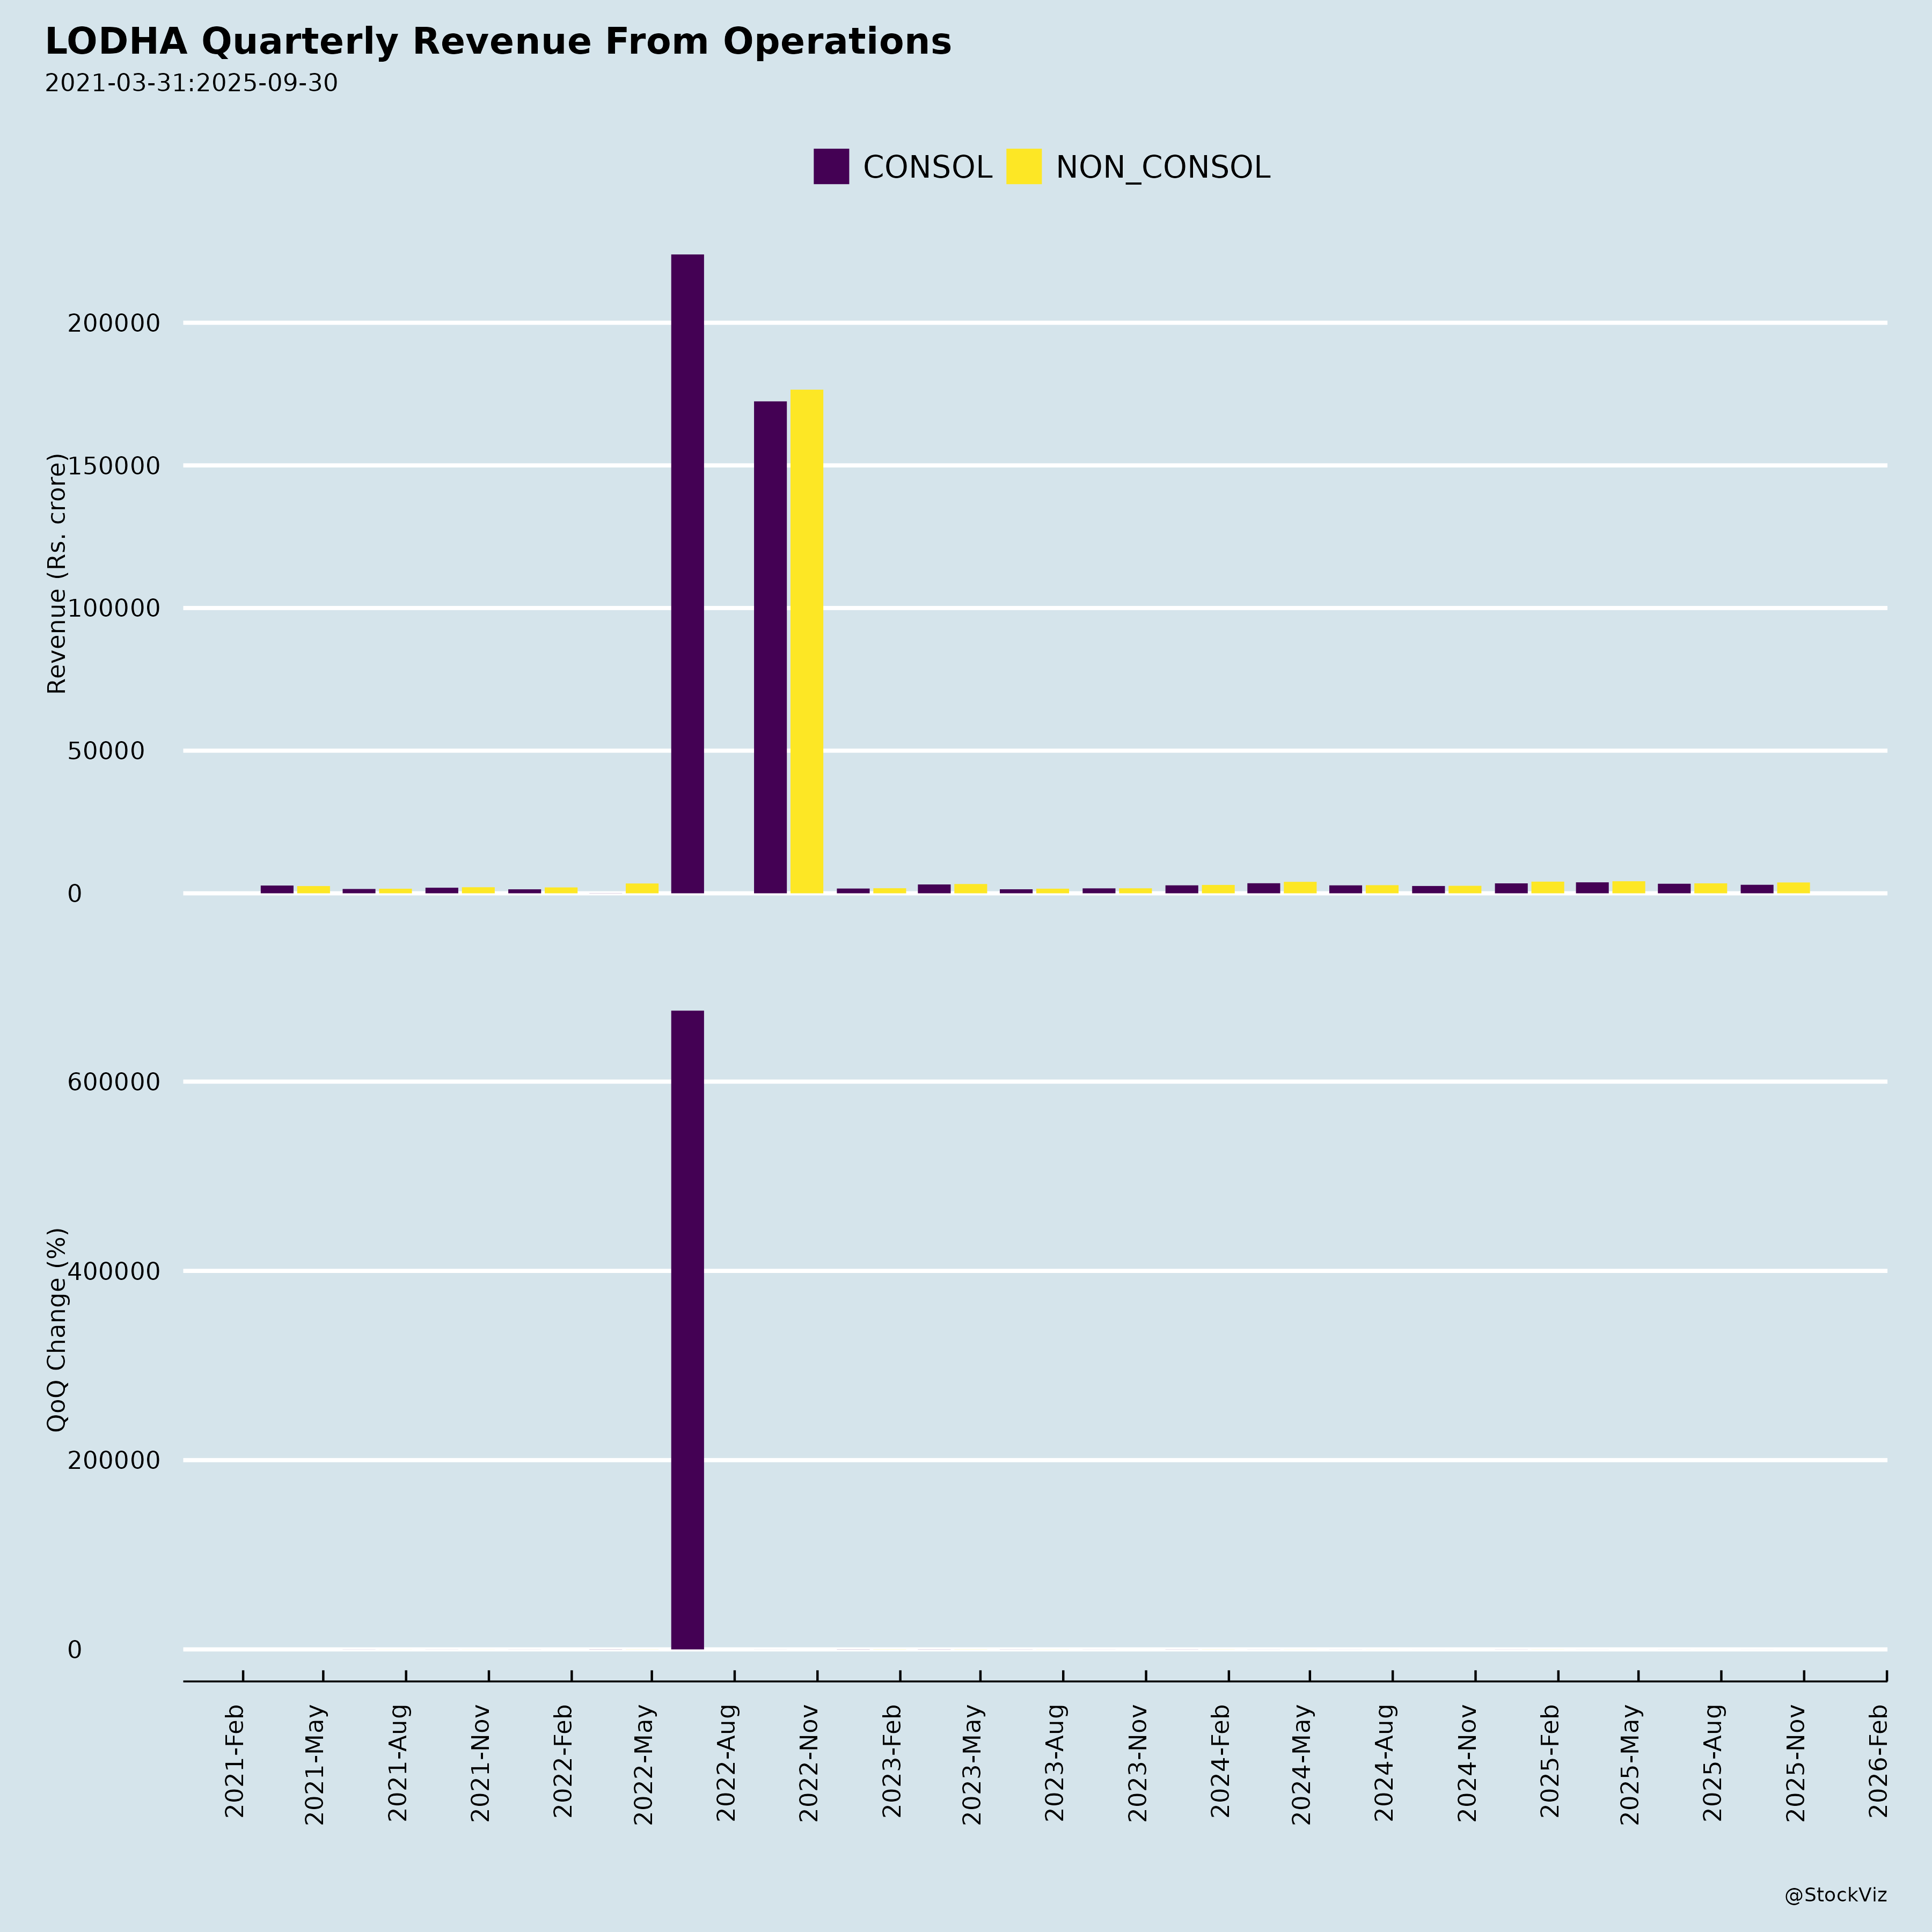
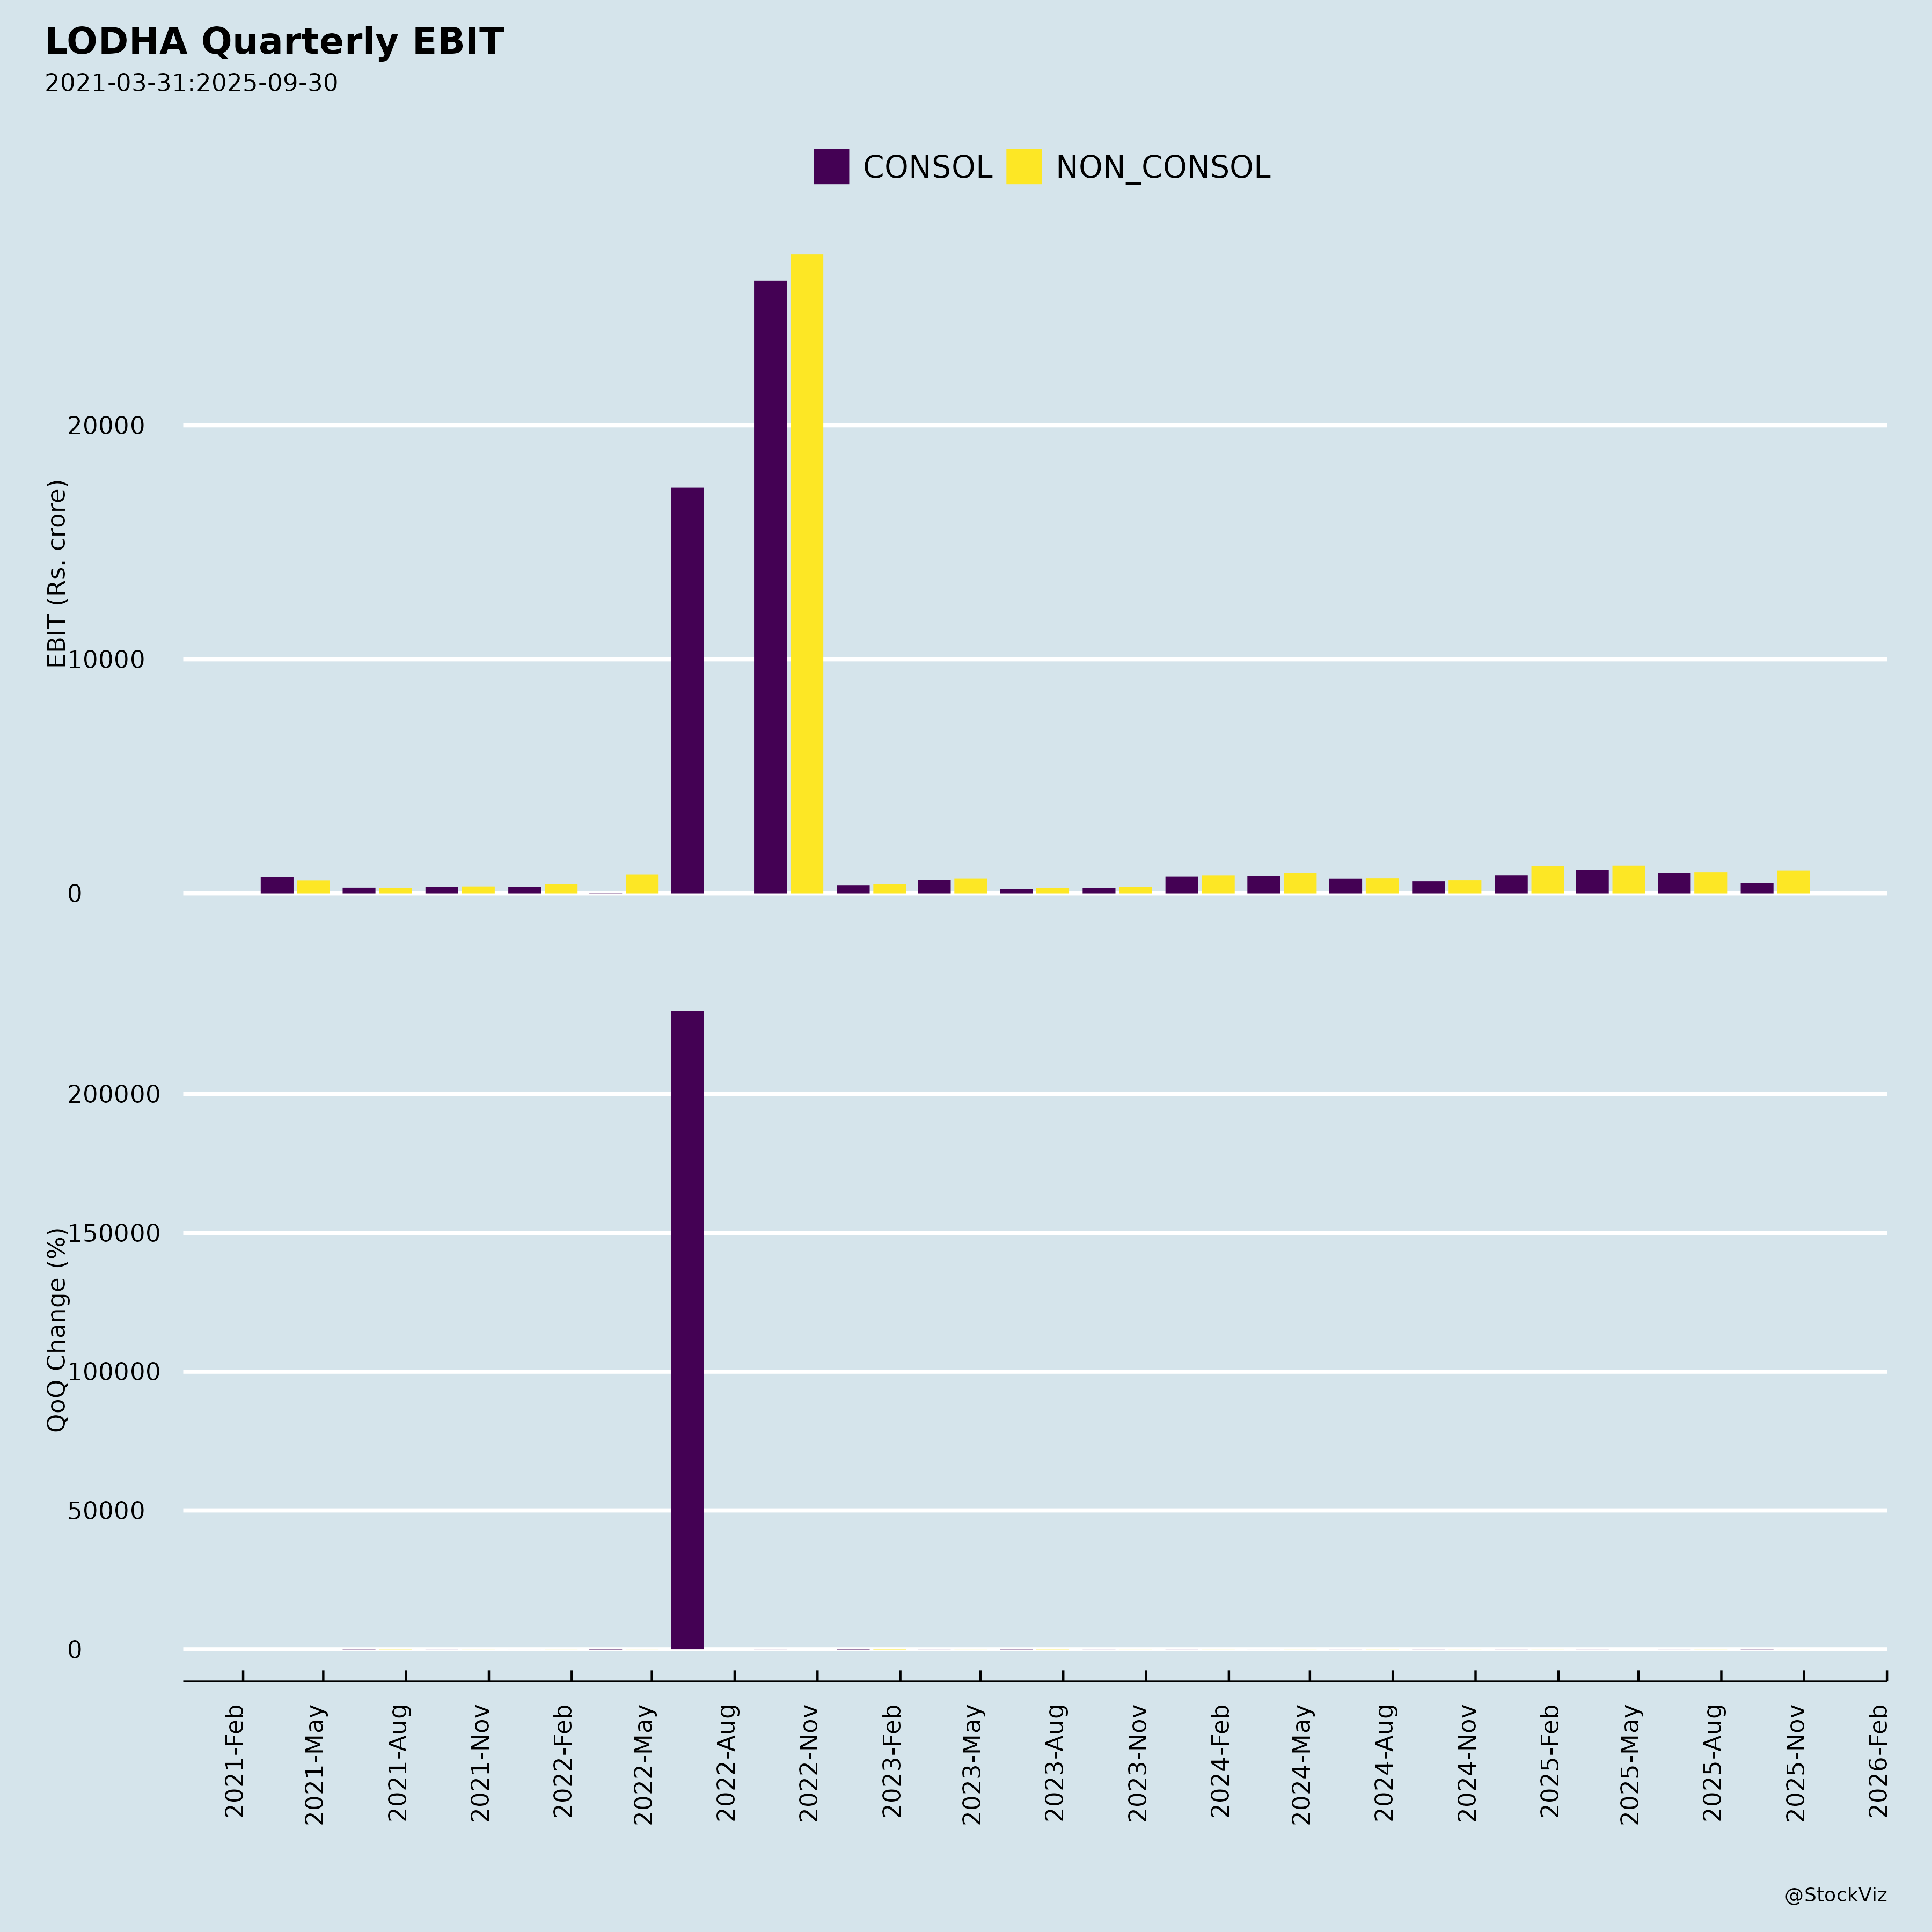
Fundamentals
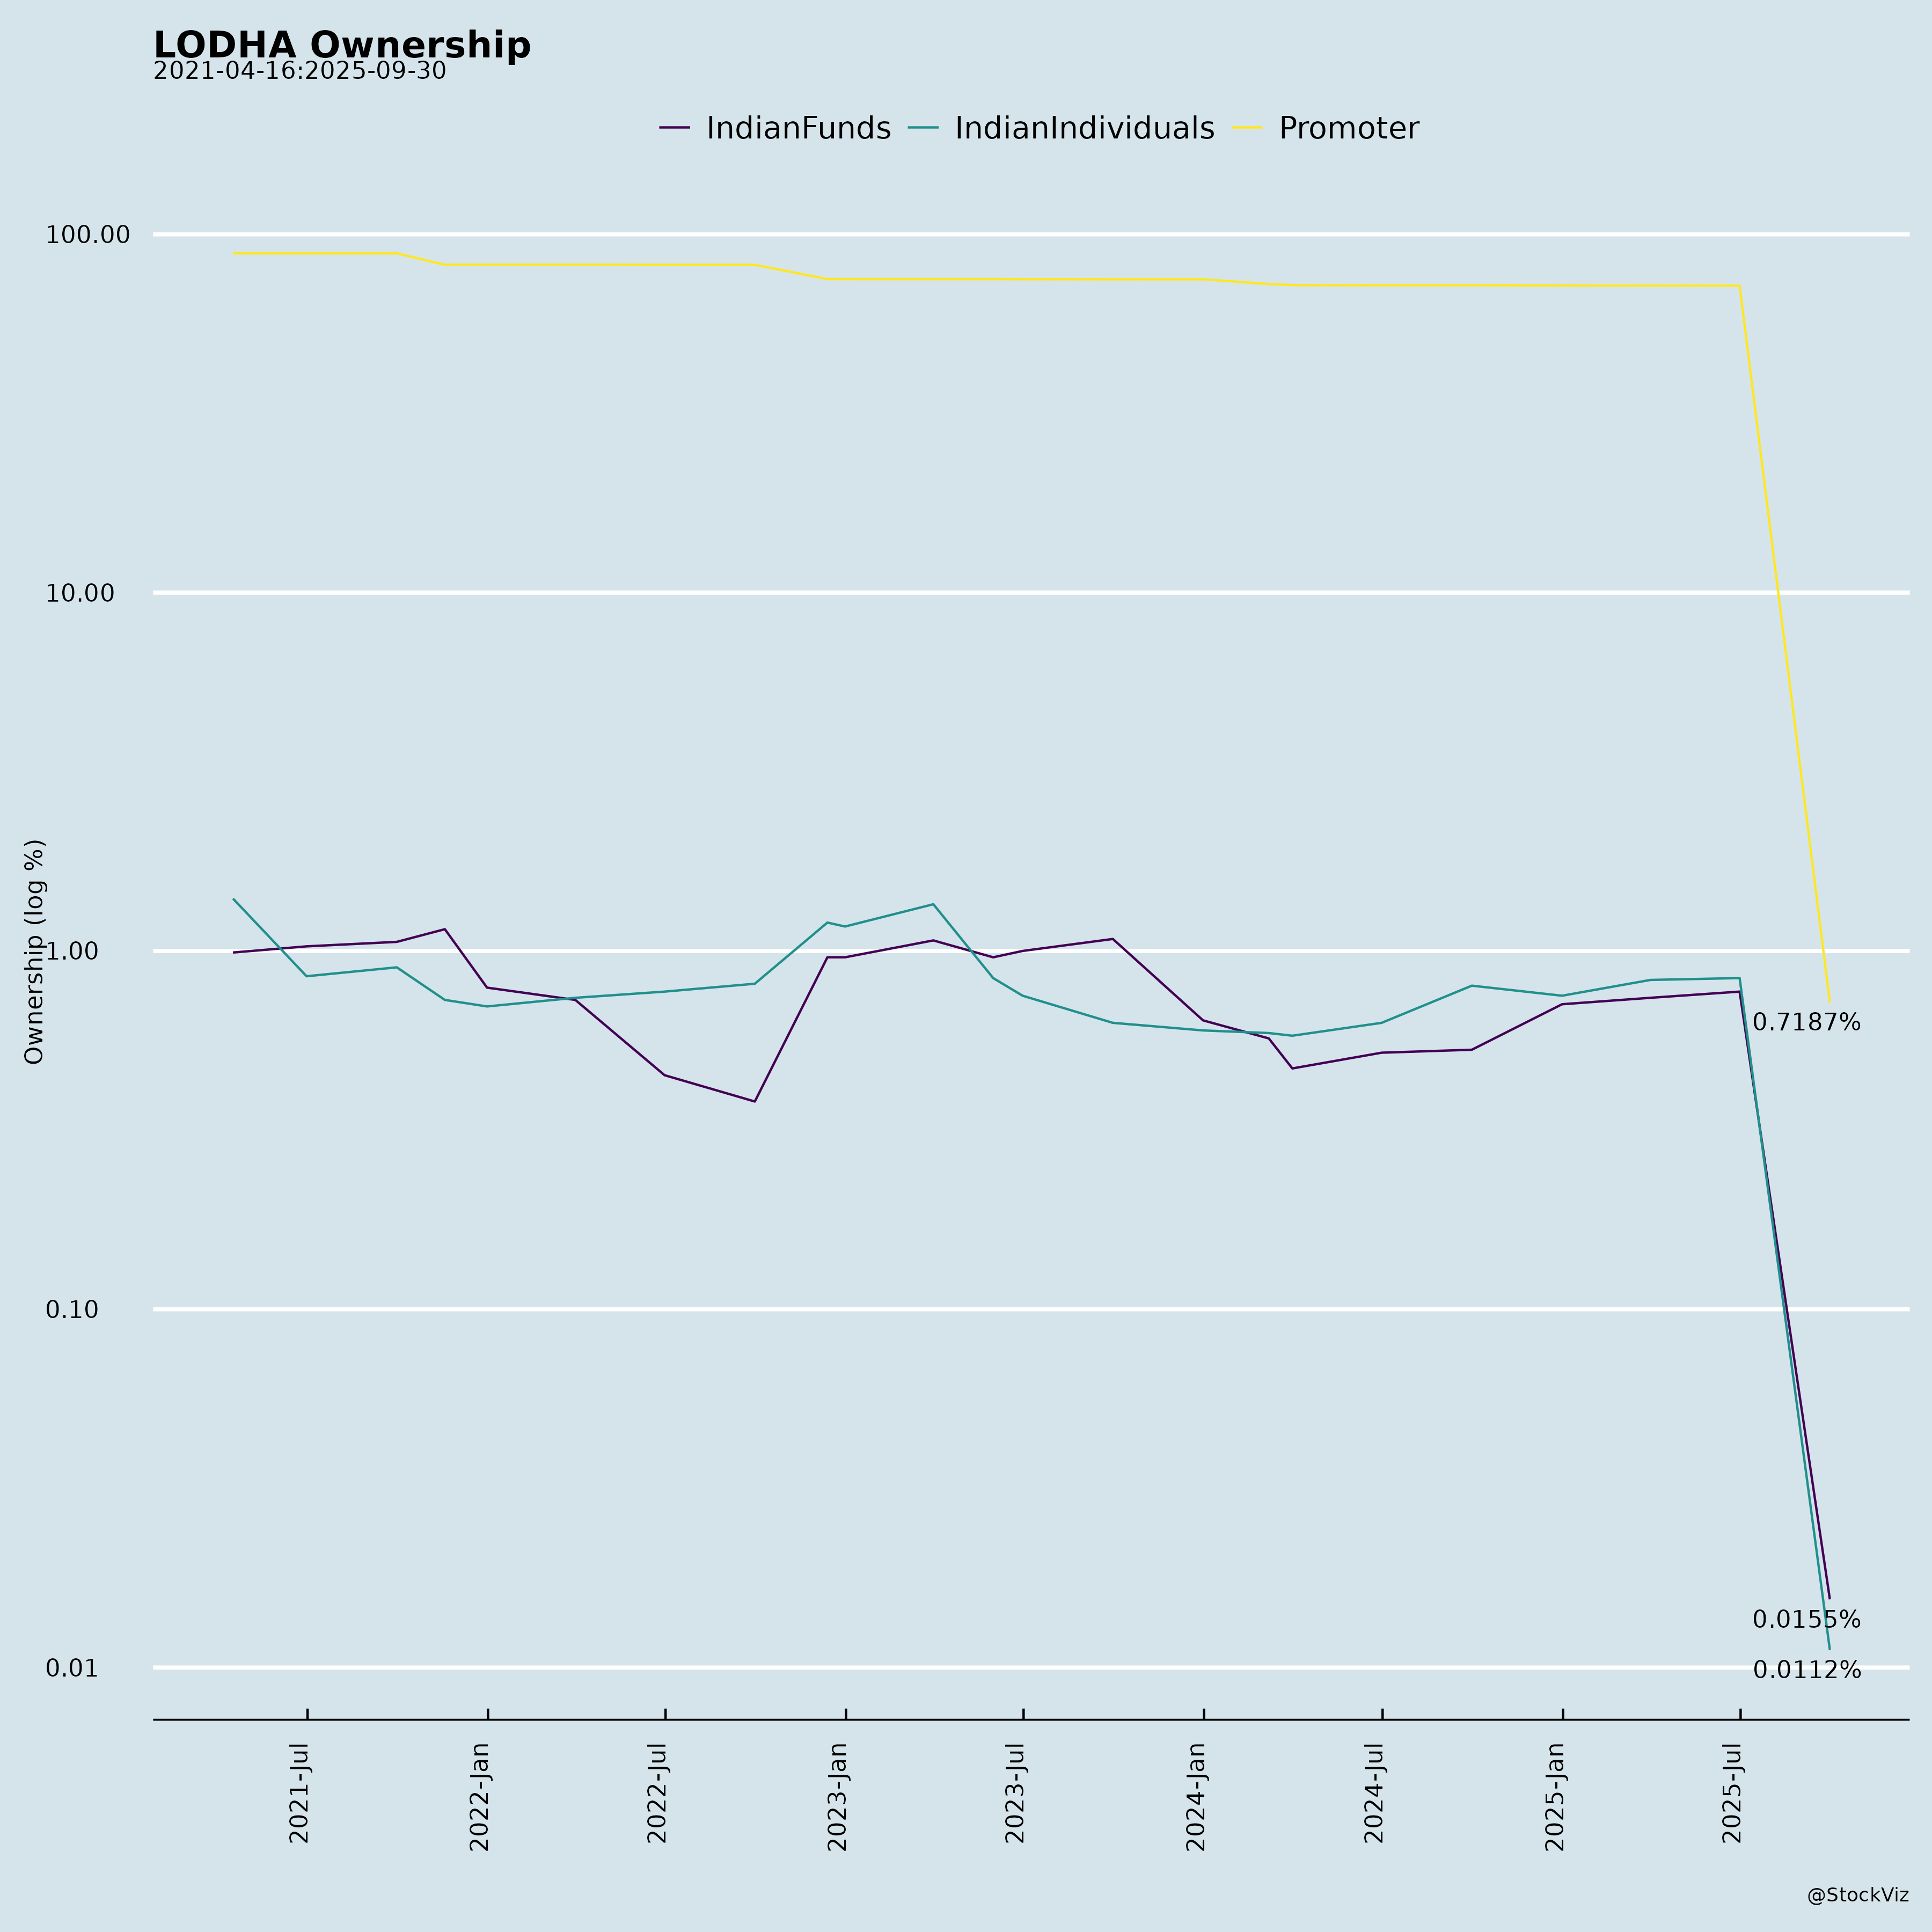
Ownership
Margined
AI Summary
asof: 2026-09-14
Lodha: Recent Corporate Developments
Headwinds and Challenges
Construction cost inflation. Lodha’s own analysis shows weighted construction cost inflation of 12.3% between April 2022 and June 2026. Labour, which forms 36.7% of total cost, rose 26.6% over this period, and external windows rose 42.7%. The company notes construction costs typically form 25–45% of sales price, with one-third of that tied to low-skilled labour. It argues commodity inflation tends to be short-cycled and that 3–4 year construction timelines plus ready inventory provide a hedge.
Margin mix effects. FY26 Adj. EBITDA margin of 33.9% was down 210 bps versus FY25’s 36.0%, even as PAT margin improved 50 bps to 20.0%. Q1FY27 margins expanded sharply (Adj. EBITDA 43.0%, PAT 26.9%), but the company attributes this to higher contribution from land sales — a potentially lumpy driver rather than a recurring operating trend.
Concentration in MMR. Q1FY27 pre-sales of ₹46.3 bn were overwhelmingly MMR-driven (₹40.9 bn), with Pune at ₹2.2 bn and Bengaluru at ₹2.0 bn. NCR operations only begin in FY27. This geographic concentration exposes performance to MMR-specific dynamics.
Regulatory and scheme risk. The merger by absorption of Roselabs Finance Limited and National Standard (India) Limited, filed with the NCLT Mumbai bench on 11 June 2026, remains subject to approval. The scheme could be withdrawn if regulatory or statutory conditions imposed by authorities are found unacceptable. Standalone results have been prepared without giving effect to the scheme pending approval.
Market and financial instrument risks. The company’s disclosures flag potential market risks, interest rate risks, liquidity risks, foreign currency risks, and credit risks associated with operations and financial instruments.
Tailwinds and Growth Prospects
Structural housing demand. Lodha cites a requirement for 14 million new homes for high-income households this decade against likely supply of ~2.75 million units, and notes that even with significant industry supply growth, supply is likely below 10 million units. Its market share in target Top 6 cities is ~3.5% by value, which it frames as a long runway.
Consolidation in favour of tier-1 brands. Regulatory pushes (RERA, demonetisation, GST, Benami Act amendment), NBFC funding withdrawal after the IL&FS implosion, and consumer loss of confidence in tier-2/3 developers are shifting market share to Top 15 listed developers.
Palava infrastructure upgrades. The Navi Mumbai airport was inaugurated in October 2025 with operations at scale in CY26, roughly 40 minutes from Palava. The Mulund–Airoli–Palava freeway is described as likely to open imminently, with Parts A and B opening soon and Part C under construction; completion of A and B would cut Palava-to-Airoli travel to 15–20 minutes and Palava-to-Mumbai to 25 minutes. The Mumbai–Ahmedabad bullet train’s first stop after BKC is planned at Palava (est. CY28/29), and Kalyan–Taloja Metro Line 12 will have three stations within Palava (CY28). The Mumbai Trans Harbour Link has been operational since CY24.
Data centre monetisation. Lodha holds ~660 acres of shovel-ready DC land near Navi Mumbai with 3 GW power availability, approved under Maharashtra’s Green Integrated Data Centre Park Policy. AWS, ST Telemedia, and Digital Edge have signed up; Digital Edge entered in June 2026 at ~₹425 mn/acre versus ~₹210 mn/acre in CY25. Of ~660 acres, 132 acres were sold as of 30 June 2026, with a further ~143 acres to be monetised for ~₹90 bn over 3–4 years, funding a 1 GW powered shell on ~90 acres expected to generate ₹20+ bn annual rental income. Two MOUs with the state government cover investment facilitation of ₹130,000 crores (~US$14 bn).
Annuity income scale-up. FY26 annuity income was ₹2.9 bn, with a plan to grow 10x by FY32 to ₹30 bn+ across data centres (₹20 bn+), retail & office (₹6 bn), and warehousing & industrial (₹4 bn). Balance investment required is ₹119.2–129.2 bn against ₹36.7 bn already invested.
LandCo optionality. ~3,700 acres at Palava and Upper Thane — described as the largest major-metro land holding of any Indian developer — with a stated potential of ₹10+ tn of sales over three decades at ~50% EBITDA margins.
Group simplification. The merger scheme is expected to streamline the holding structure, reduce overheads and operational costs, eliminate duplicate compliances, and free senior management bandwidth.
Key Risks
- Execution and absorption risk on the launch pipeline. The rest-of-FY27 DevCo pipeline totals 15.6 msf and ₹240.6 bn GDV across 21 projects/phases, heavily weighted to MMR (₹130.4 bn). Delivery depends on approvals and market absorption.
- Data centre concentration and counterparty risk. The DC Park thesis rests on a small set of anchor operators and on land sale proceeds funding the 1 GW build-out; the ₹90 bn monetisation target over 3–4 years is a forward estimate.
- Annuity build-out funding. The 10x annuity target requires ₹119.2–129.2 bn of balance investment, with data centres accounting for ₹100–110 bn of that.
- Leverage discipline. Net debt was ₹49.3 bn at 0.20x equity as of June 2026, against a stated ceiling of <0.5x D/E. Net debt declined ₹4.46 bn during Q1FY27. The company targets a debt-free DevCo in the next few years.
- NCLT scheme outcome. Approval is pending and not assured.
- Cost inflation pass-through. The company’s ability to offset the 12.3% weighted cost inflation through pricing depends on continued housing price increases running below wage growth.
Management Guidance vs. Observed Performance
PAT growth guidance. Management guides ~20% PAT CAGR over the long term. Q1FY27 PAT of ₹13.7 bn represents 33% of the full-year guidance of ₹41 bn (FY26’s ₹34.3 bn plus 20% growth). Q1FY27 PAT grew 103.3% YoY, well ahead of the guided rate, though management attributes part of the margin expansion to land sales. FY26 PAT growth was 24.0% — above the 20% medium-term trajectory.
Revenue and profitability. Q1FY27 revenue of ₹50.0 bn grew 43.1% YoY, described as the best-ever quarterly performance. FY26 revenue grew 21.0% to ₹166.8 bn. FY26 Adj. EBITDA margin of 33.9% was below FY25’s 36.0%, while Q1FY27’s 43.0% exceeded Q1FY26’s 34.4%.
Pre-sales. FY26 pre-sales were ₹205 bn, a 28% CAGR over five years. Q1FY27 pre-sales were ₹46.3 bn, with collections of ₹42.1 bn growing 46% YoY.
Leverage. The <0.5x net D/E ceiling has been maintained with headroom: 0.20x at June 2026 versus 0.24x at March 2026 and 0.25x at June 2025. Exit cost of debt was stable at 7.8% in Q1FY27, described as among the lowest in the industry. Credit rating stands at AA (Stable) with seven upgrades since 2021.
Business development. The company states limited business development is required over the next few years given unsold GDV of ~₹2,000 bn (excluding LandCo land). Q1FY27 additions were 1.9 msf in Pune with ₹23 bn estimated GDV — modest relative to the stated pipeline, consistent with that stance.
Annuity guidance. The 10x growth target to ₹30 bn+ by FY32 compares with FY26 actual annuity income of ₹2.9 bn and annualised rental income from leased area of ₹3.0 bn as of 31 March 2026.
Capital return. The Board fixed 7 August 2026 as the record date for FY26 dividend, with the 31st AGM on 14 August 2026 and payment within 30 days of declaration, subject to member approval.
Broker Narrative
The broker stayed Buy throughout, but the narrative shifted from a post-rate-peak cyclical recovery to a slower, launch-delayed growth story with new cost and demand-normalization headwinds. Early optimism centered on doubling launches and ~30% pre-sales growth; by the last report, financials were strong but pre-sales growth was only 4% YoY because launches were deferred. Persistent themes were launch pipeline strength, healthy demand/resilience, and listed players’ execution; new themes were data centers, regional diversification, and geopolitical/energy-cost risks.
Fears that came true
- The early concern about muted launches materialized: launch deferrals and the absence of significant launches made 1QFY27 pre-sales growth just 4% YoY, and launch weakness also matched the 2025-07-08 DISAPPOINTMENT outcome with a -11.3% actual return.
Optimism that failed
- The expectation that a doubling of launches would drive ~30% pre-sales growth did not hold up later, as 1QFY27 pre-sales growth slowed to 4% YoY partly due to absent significant launches.
- The expected further pickup in absorption did not materialize in MMR, where luxury housing sales closures returned to normal levels and demand normalized.
Broker Timeline
13 broker calls · 2023-11-30 to 2026-07-27
Copyright © 2023 SAS Data Analytics Pvt. Ltd. All rights reserved.