LICHSGFIN
Equity Metrics
September 24, 2026
LIC Housing Finance Limited
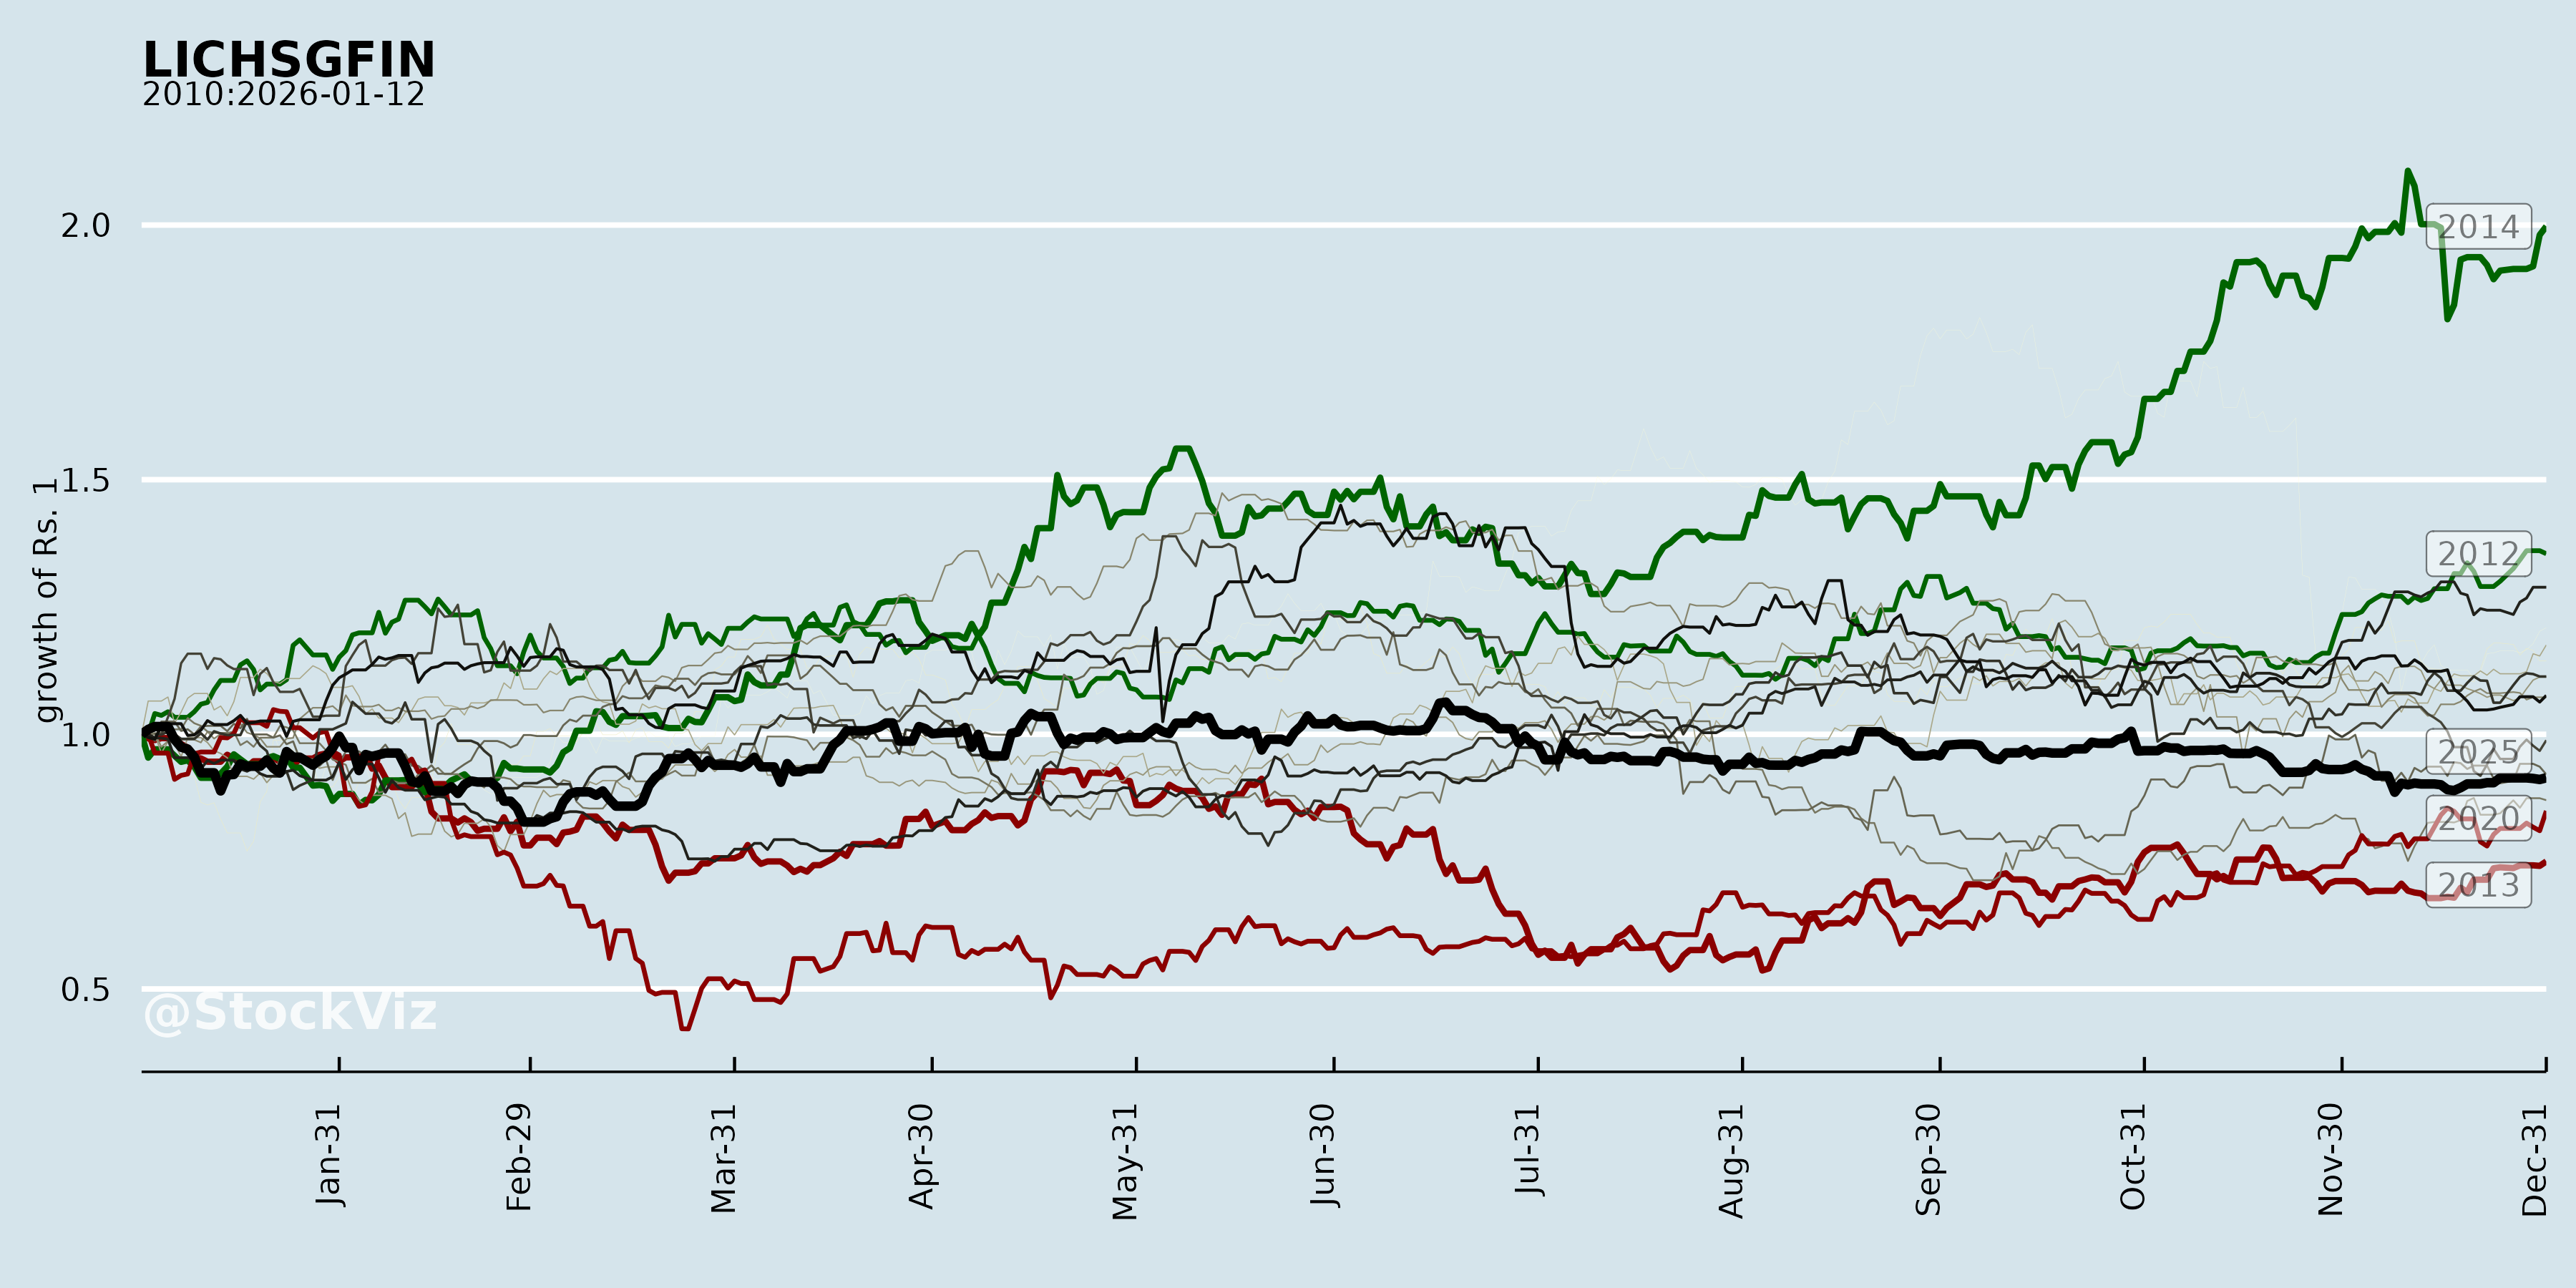
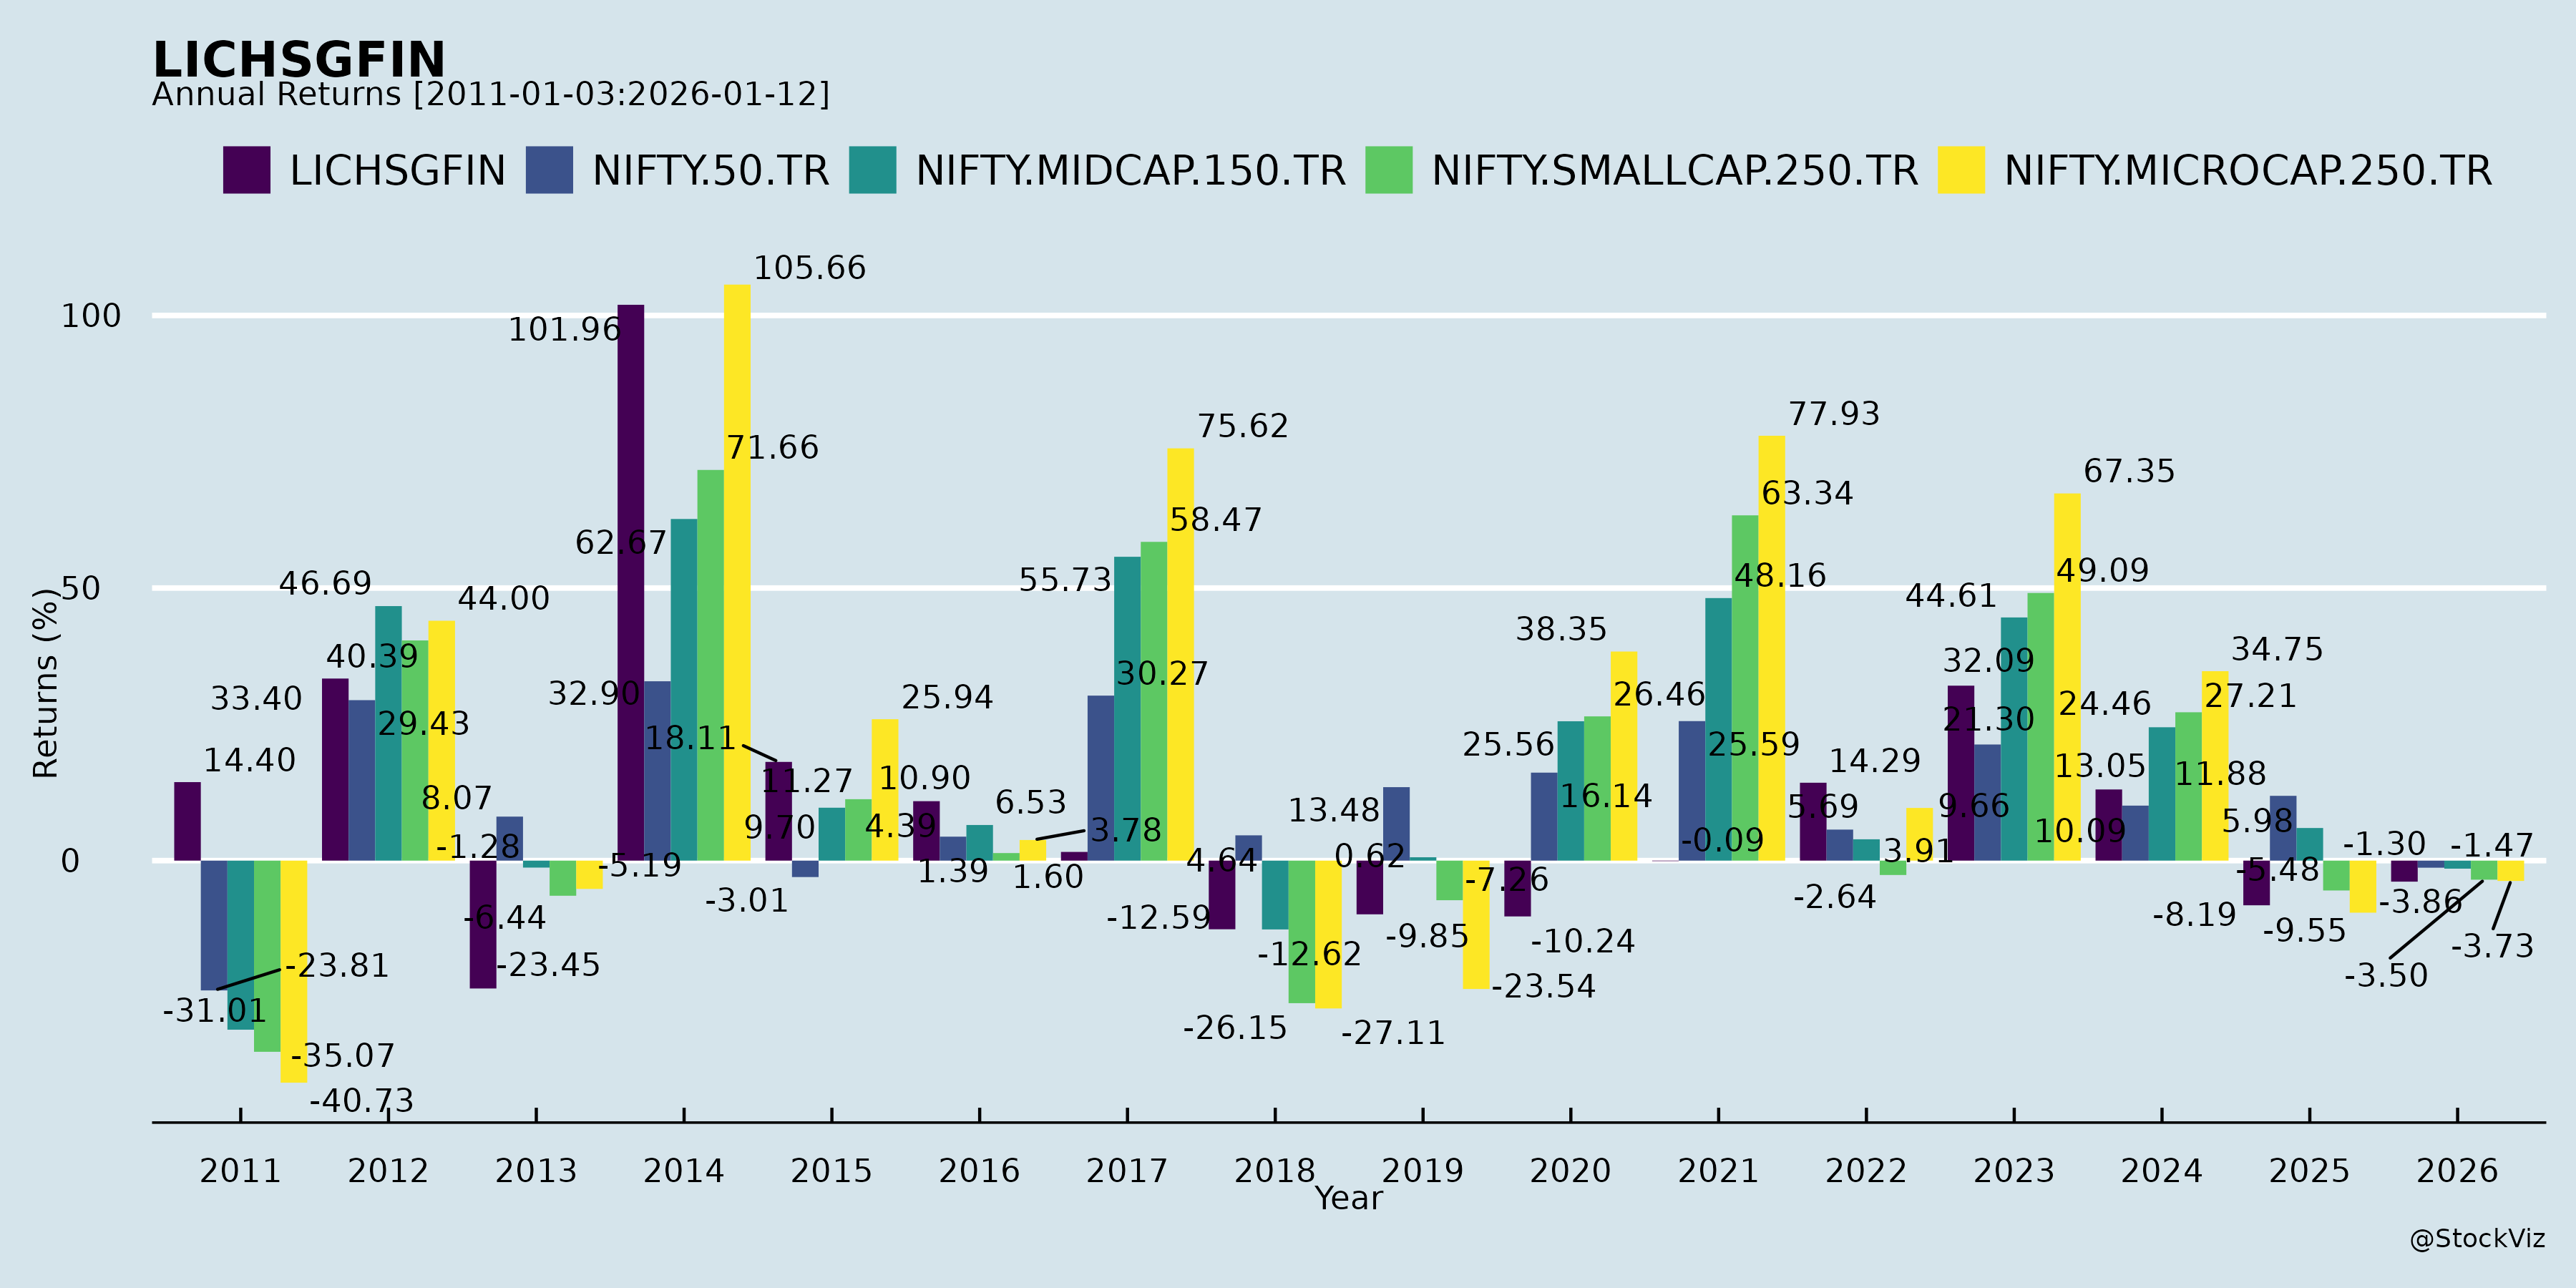
Annual Returns
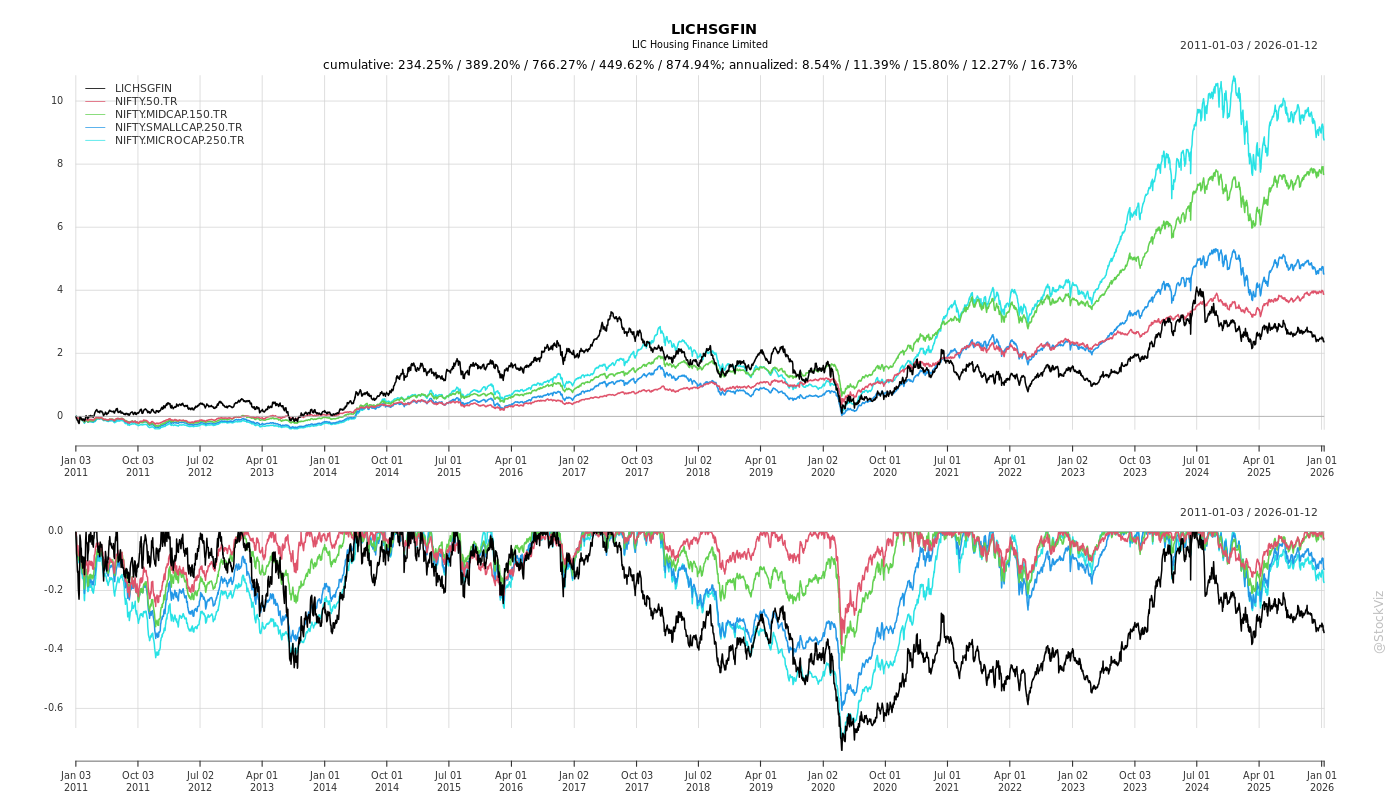
Cumulative Returns and Drawdowns
Fundamentals
Ownership
Margined
AI Summary
asof: 2026-09-16
LICHSGFIN Q1 FY27: Analysis of Recent Corporate Announcements
1. Headwinds and Challenges
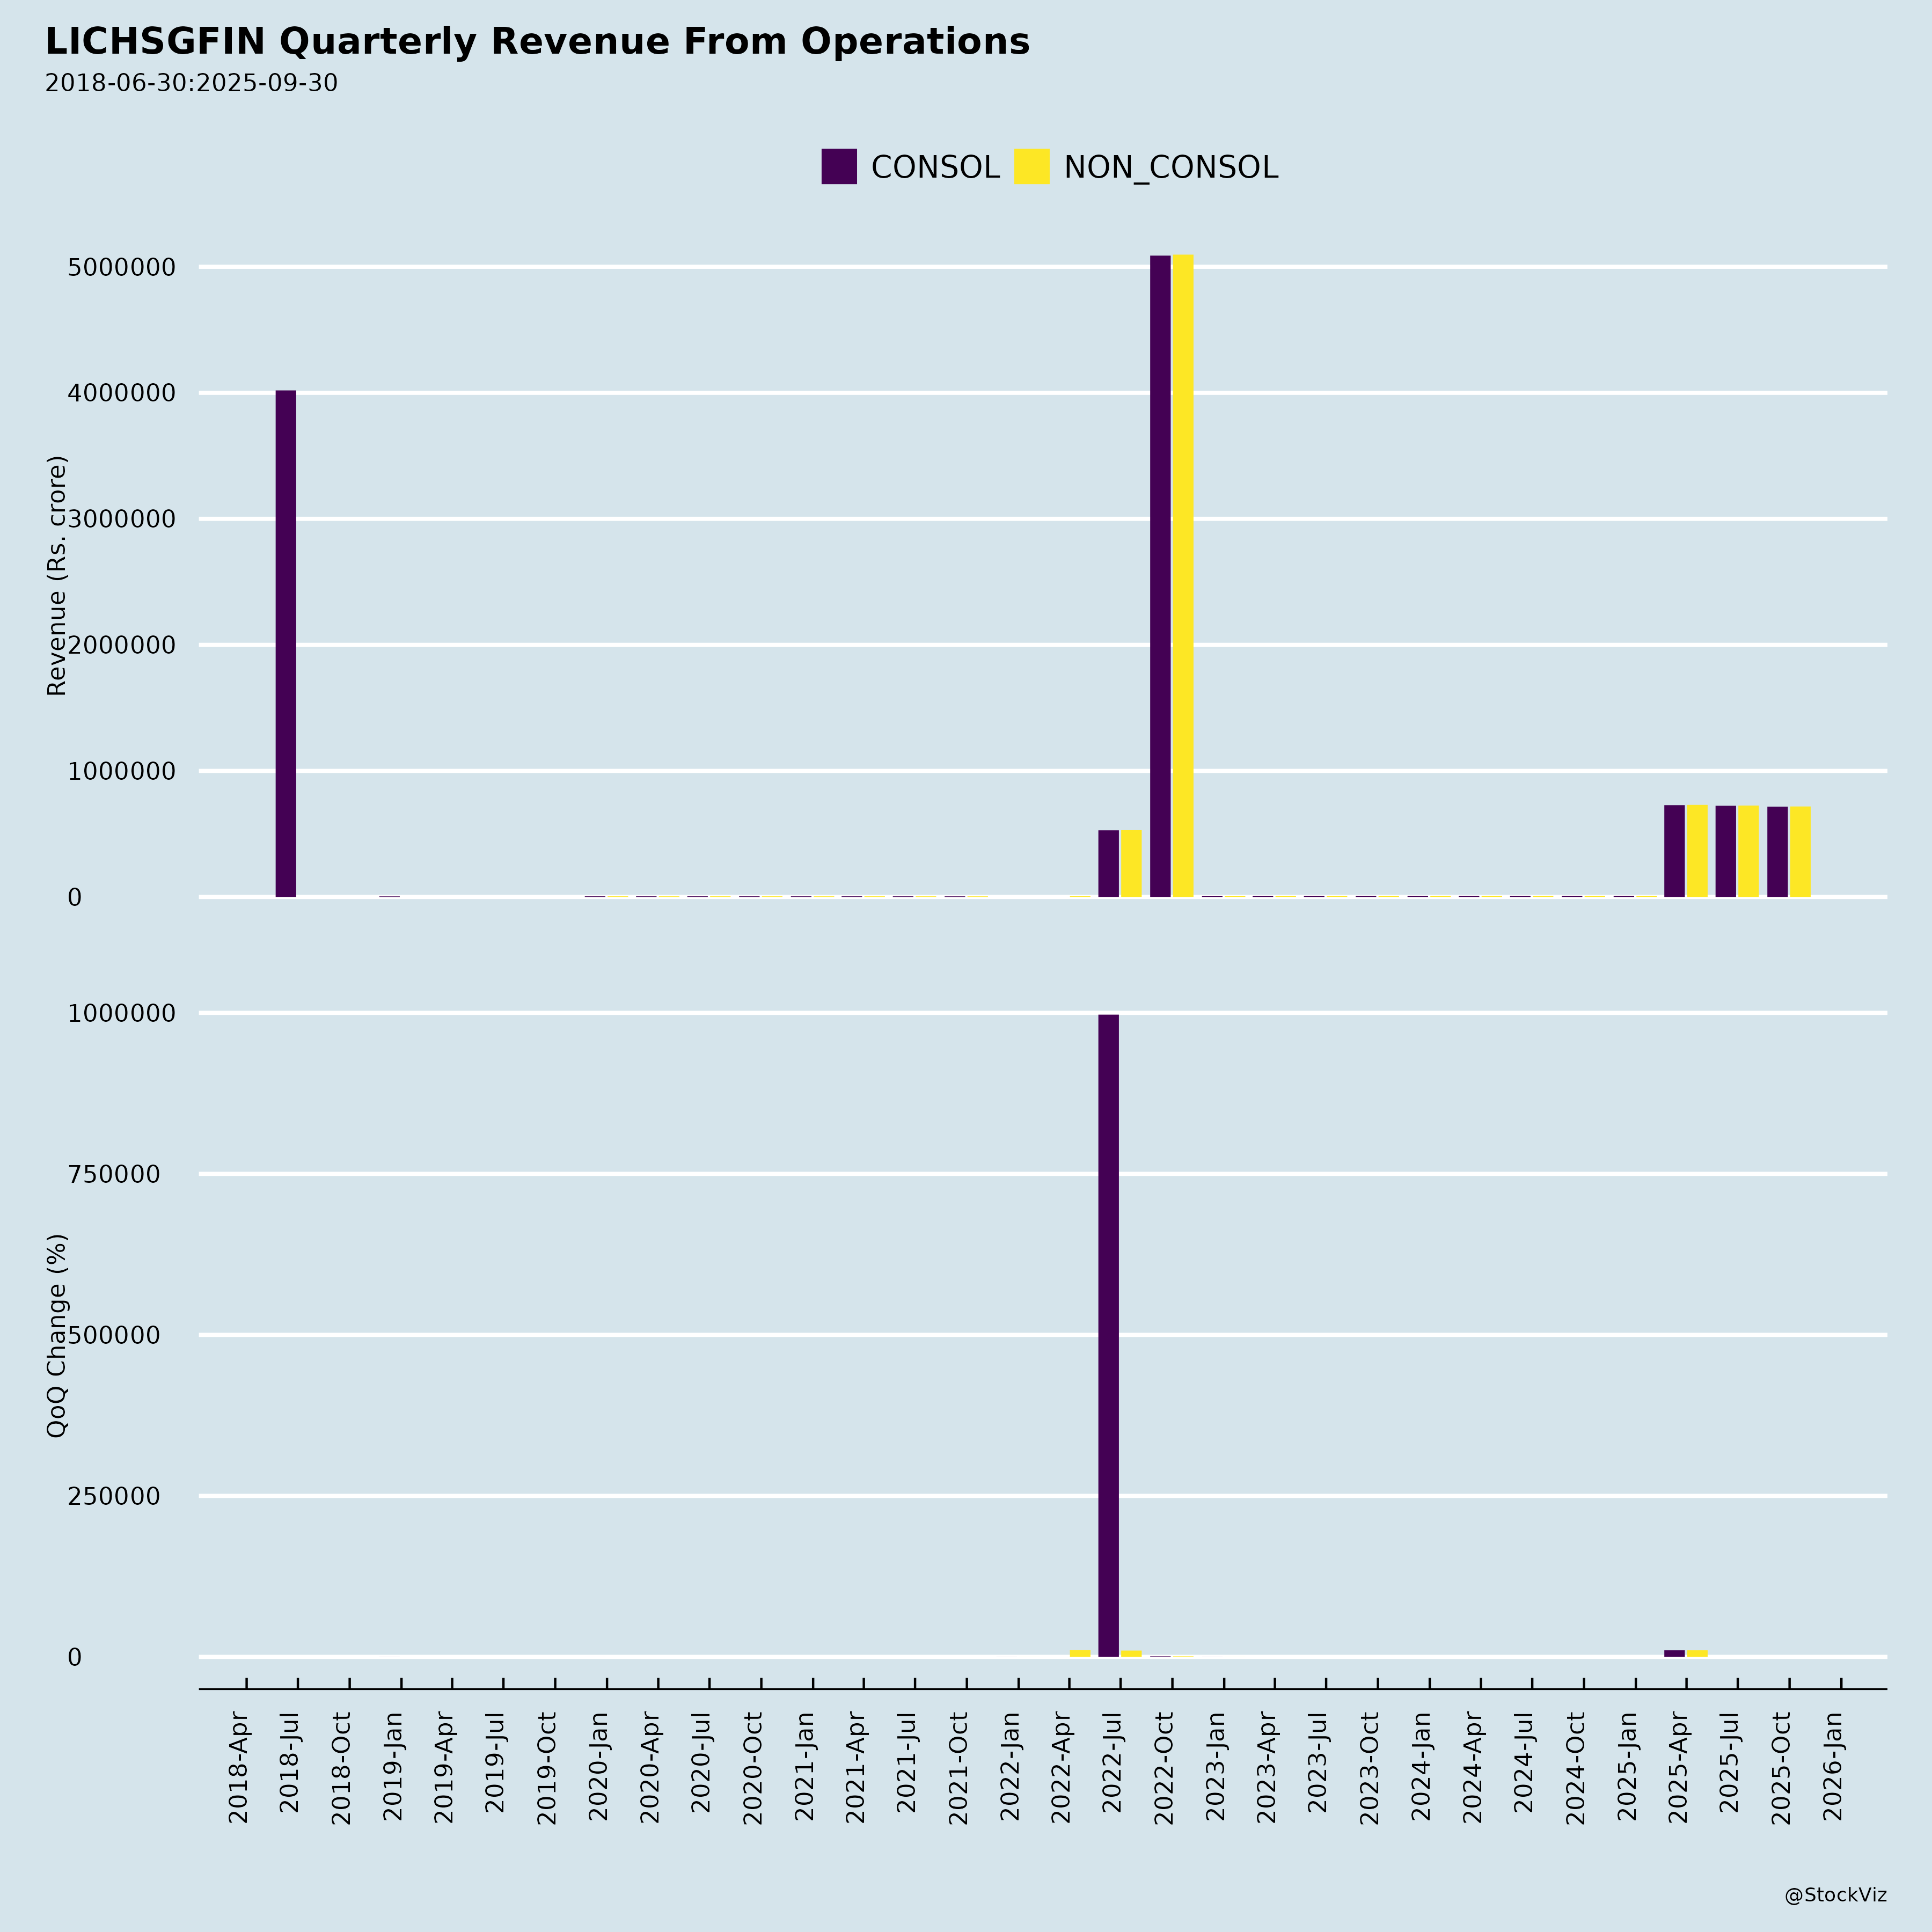
Margin compression: Net Interest Margin declined to 2.58% in Q1 FY27 from 2.68% in Q1 FY26. Spreads narrowed to 1.84% from 2.10%, as yield on advances (annualised) fell to 9.12% from 9.60%, even as weighted average cost of funds eased to 7.28% from 7.50%. Revenue from operations declined 1% year-on-year to Rs. 7,062.45 crores.
Competitive intensity: The company operates amid intense competition from 92 housing finance companies, numerous NBFCs, and aggressive public and private sector banks.
Interest rate volatility: Volatility in interest rates is cited as a material challenge.
Legacy non-performing assets: Approximately 11,000 loans remain in NPA, described as legacy NPAs.
Geopolitical uncertainty: Management flagged headwinds arising from geopolitical conflicts in other parts of the world, which could weigh on the sector despite an otherwise favourable domestic backdrop.
Prepayment pressure: Lump-sum prepayments as a percentage of opening book rose to 12.0% for FY26 and stood at 11.7% for Q1 FY27, compared with 9.4% for FY25 — a drag on portfolio growth.
Declining segments: Non-Housing Commercial disbursements fell 27% year-on-year to Rs. 48 crores in Q1 FY27.
2. Tailwinds and Growth Prospects
Disbursement momentum: Total disbursements rose 14.5% year-on-year to Rs. 15,014 crores in Q1 FY27. Individual Home Loan disbursements grew 8% to Rs. 12,119 crores, Non-Housing Individual loans grew 20% to Rs. 1,975 crores, and Project Finance disbursements surged 459% to Rs. 872 crores.
Portfolio growth: The outstanding loan portfolio grew 4% to Rs. 322,098 crores as of June 30, 2026. The Individual Home Loan portfolio rose 4% to Rs. 271,979 crores, and the Project loan portfolio rose 8% to Rs. 9,687 crores.
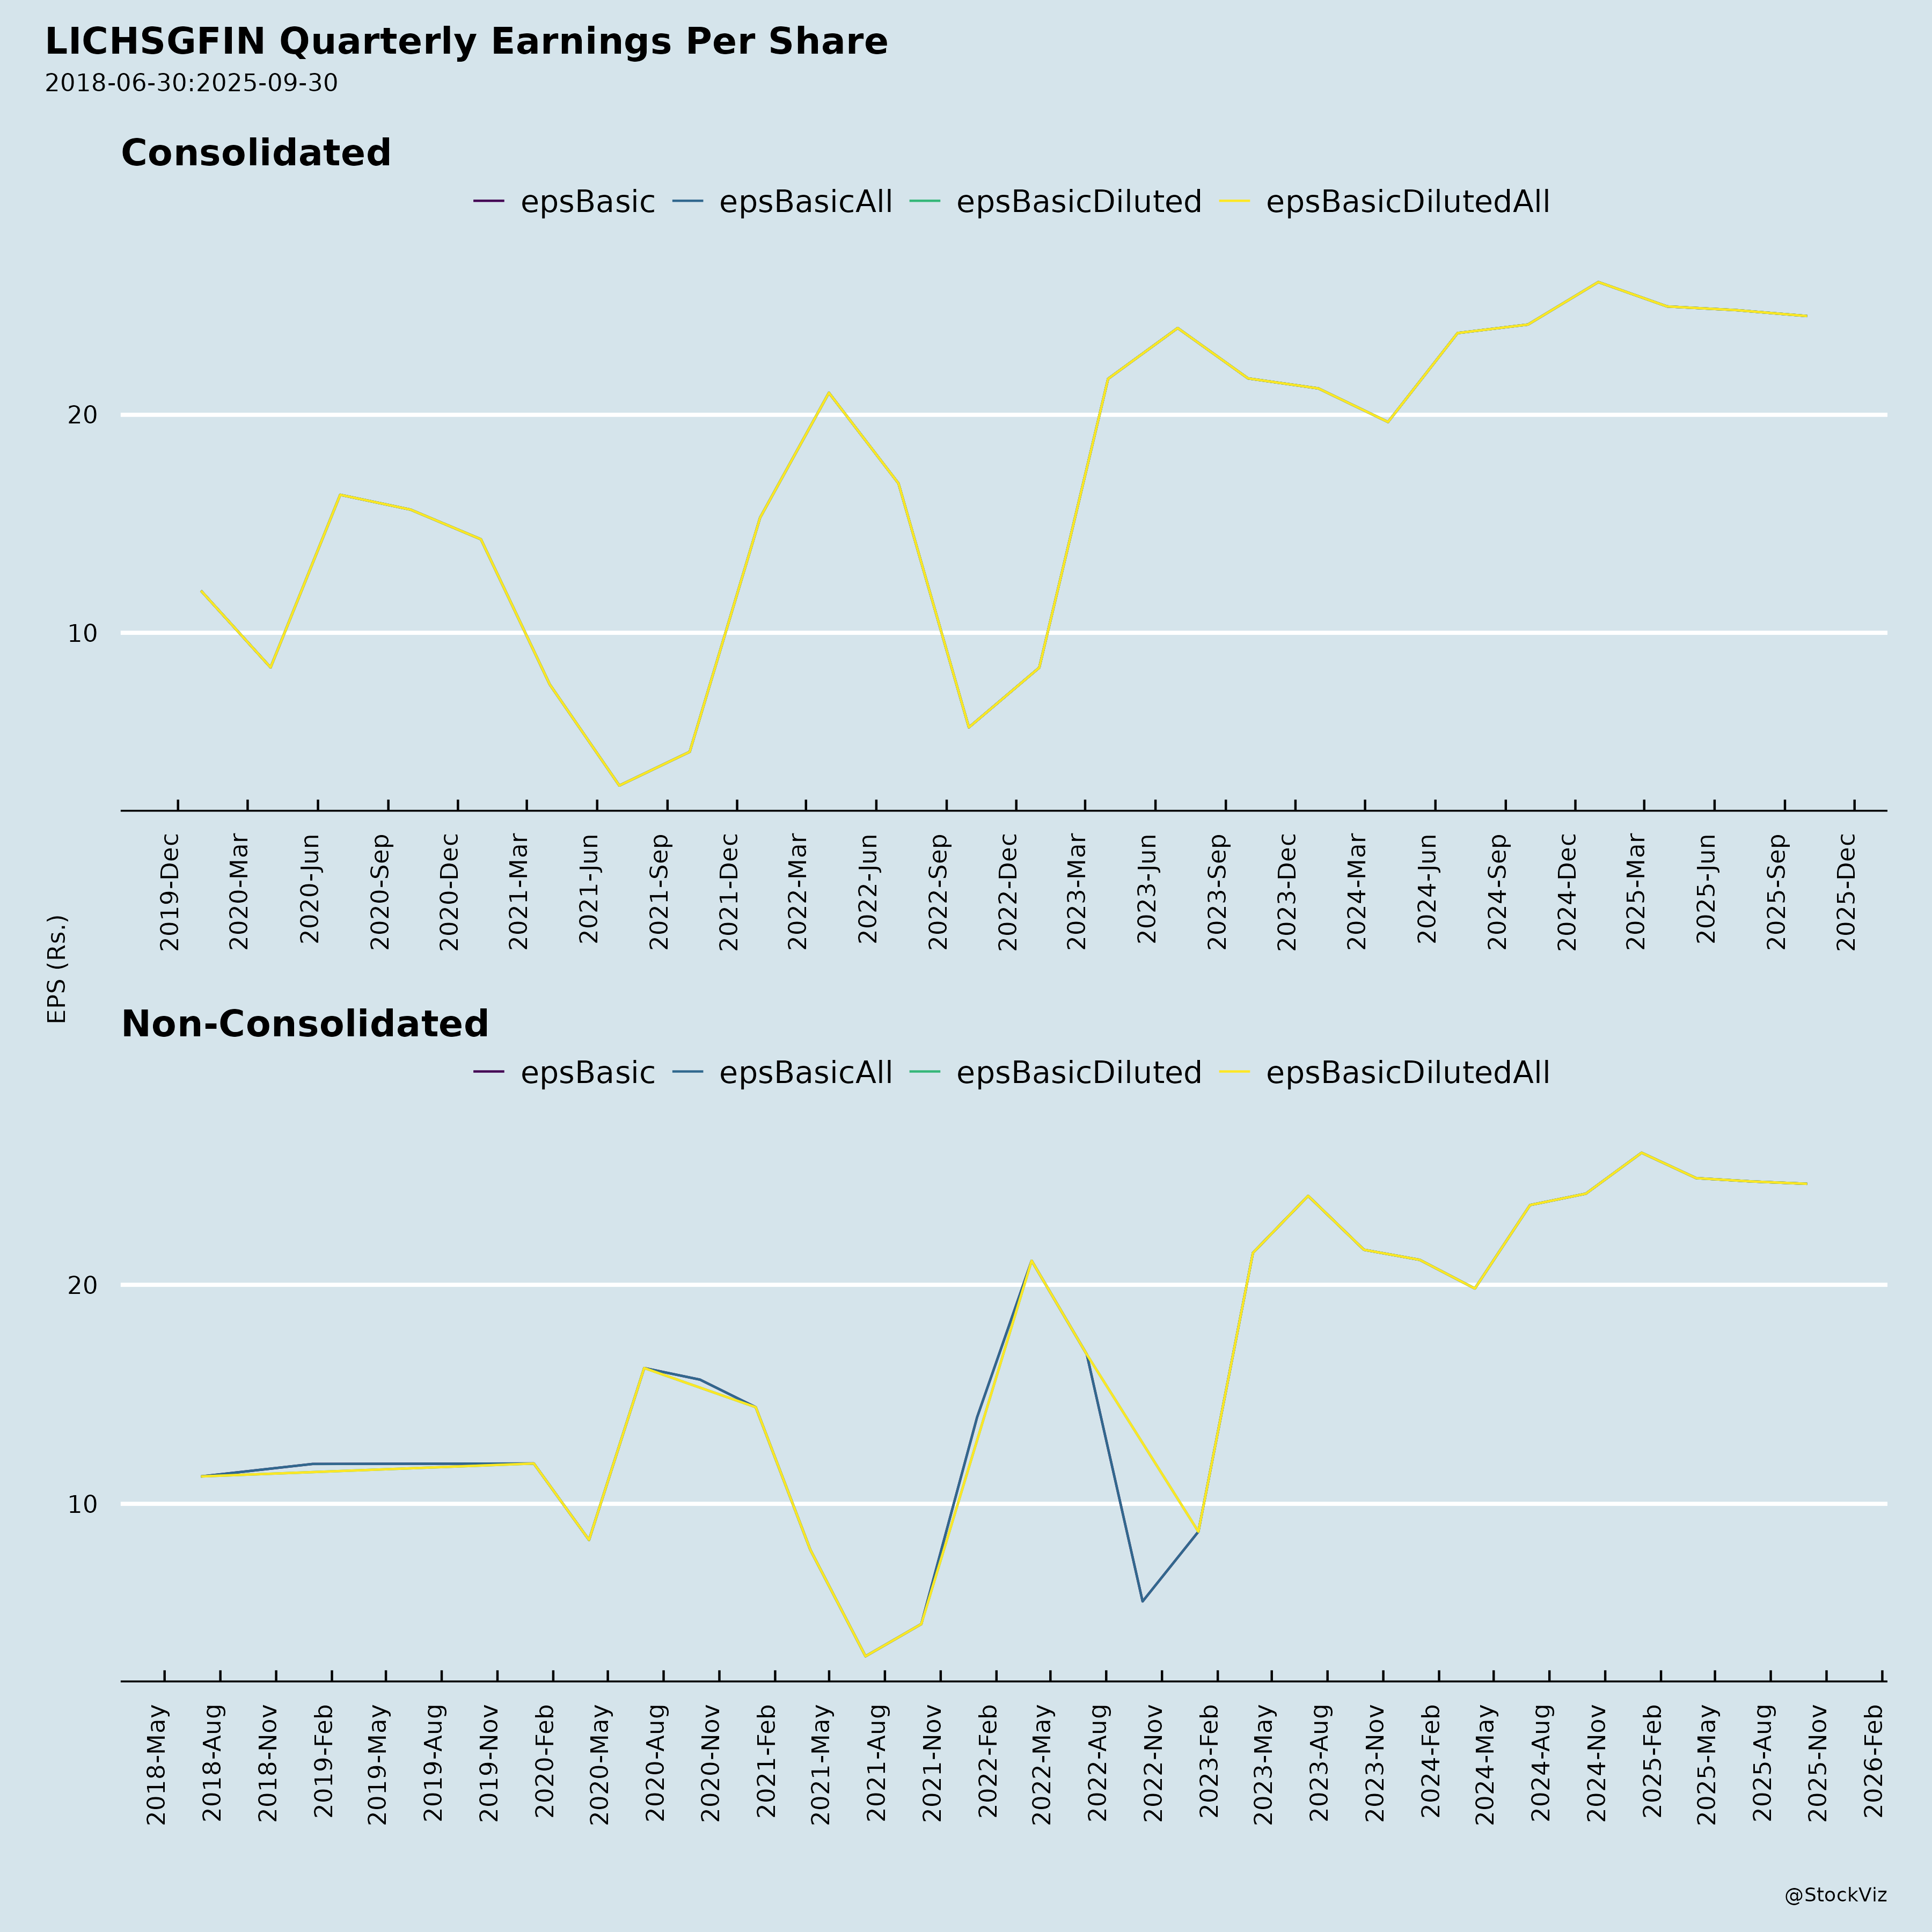
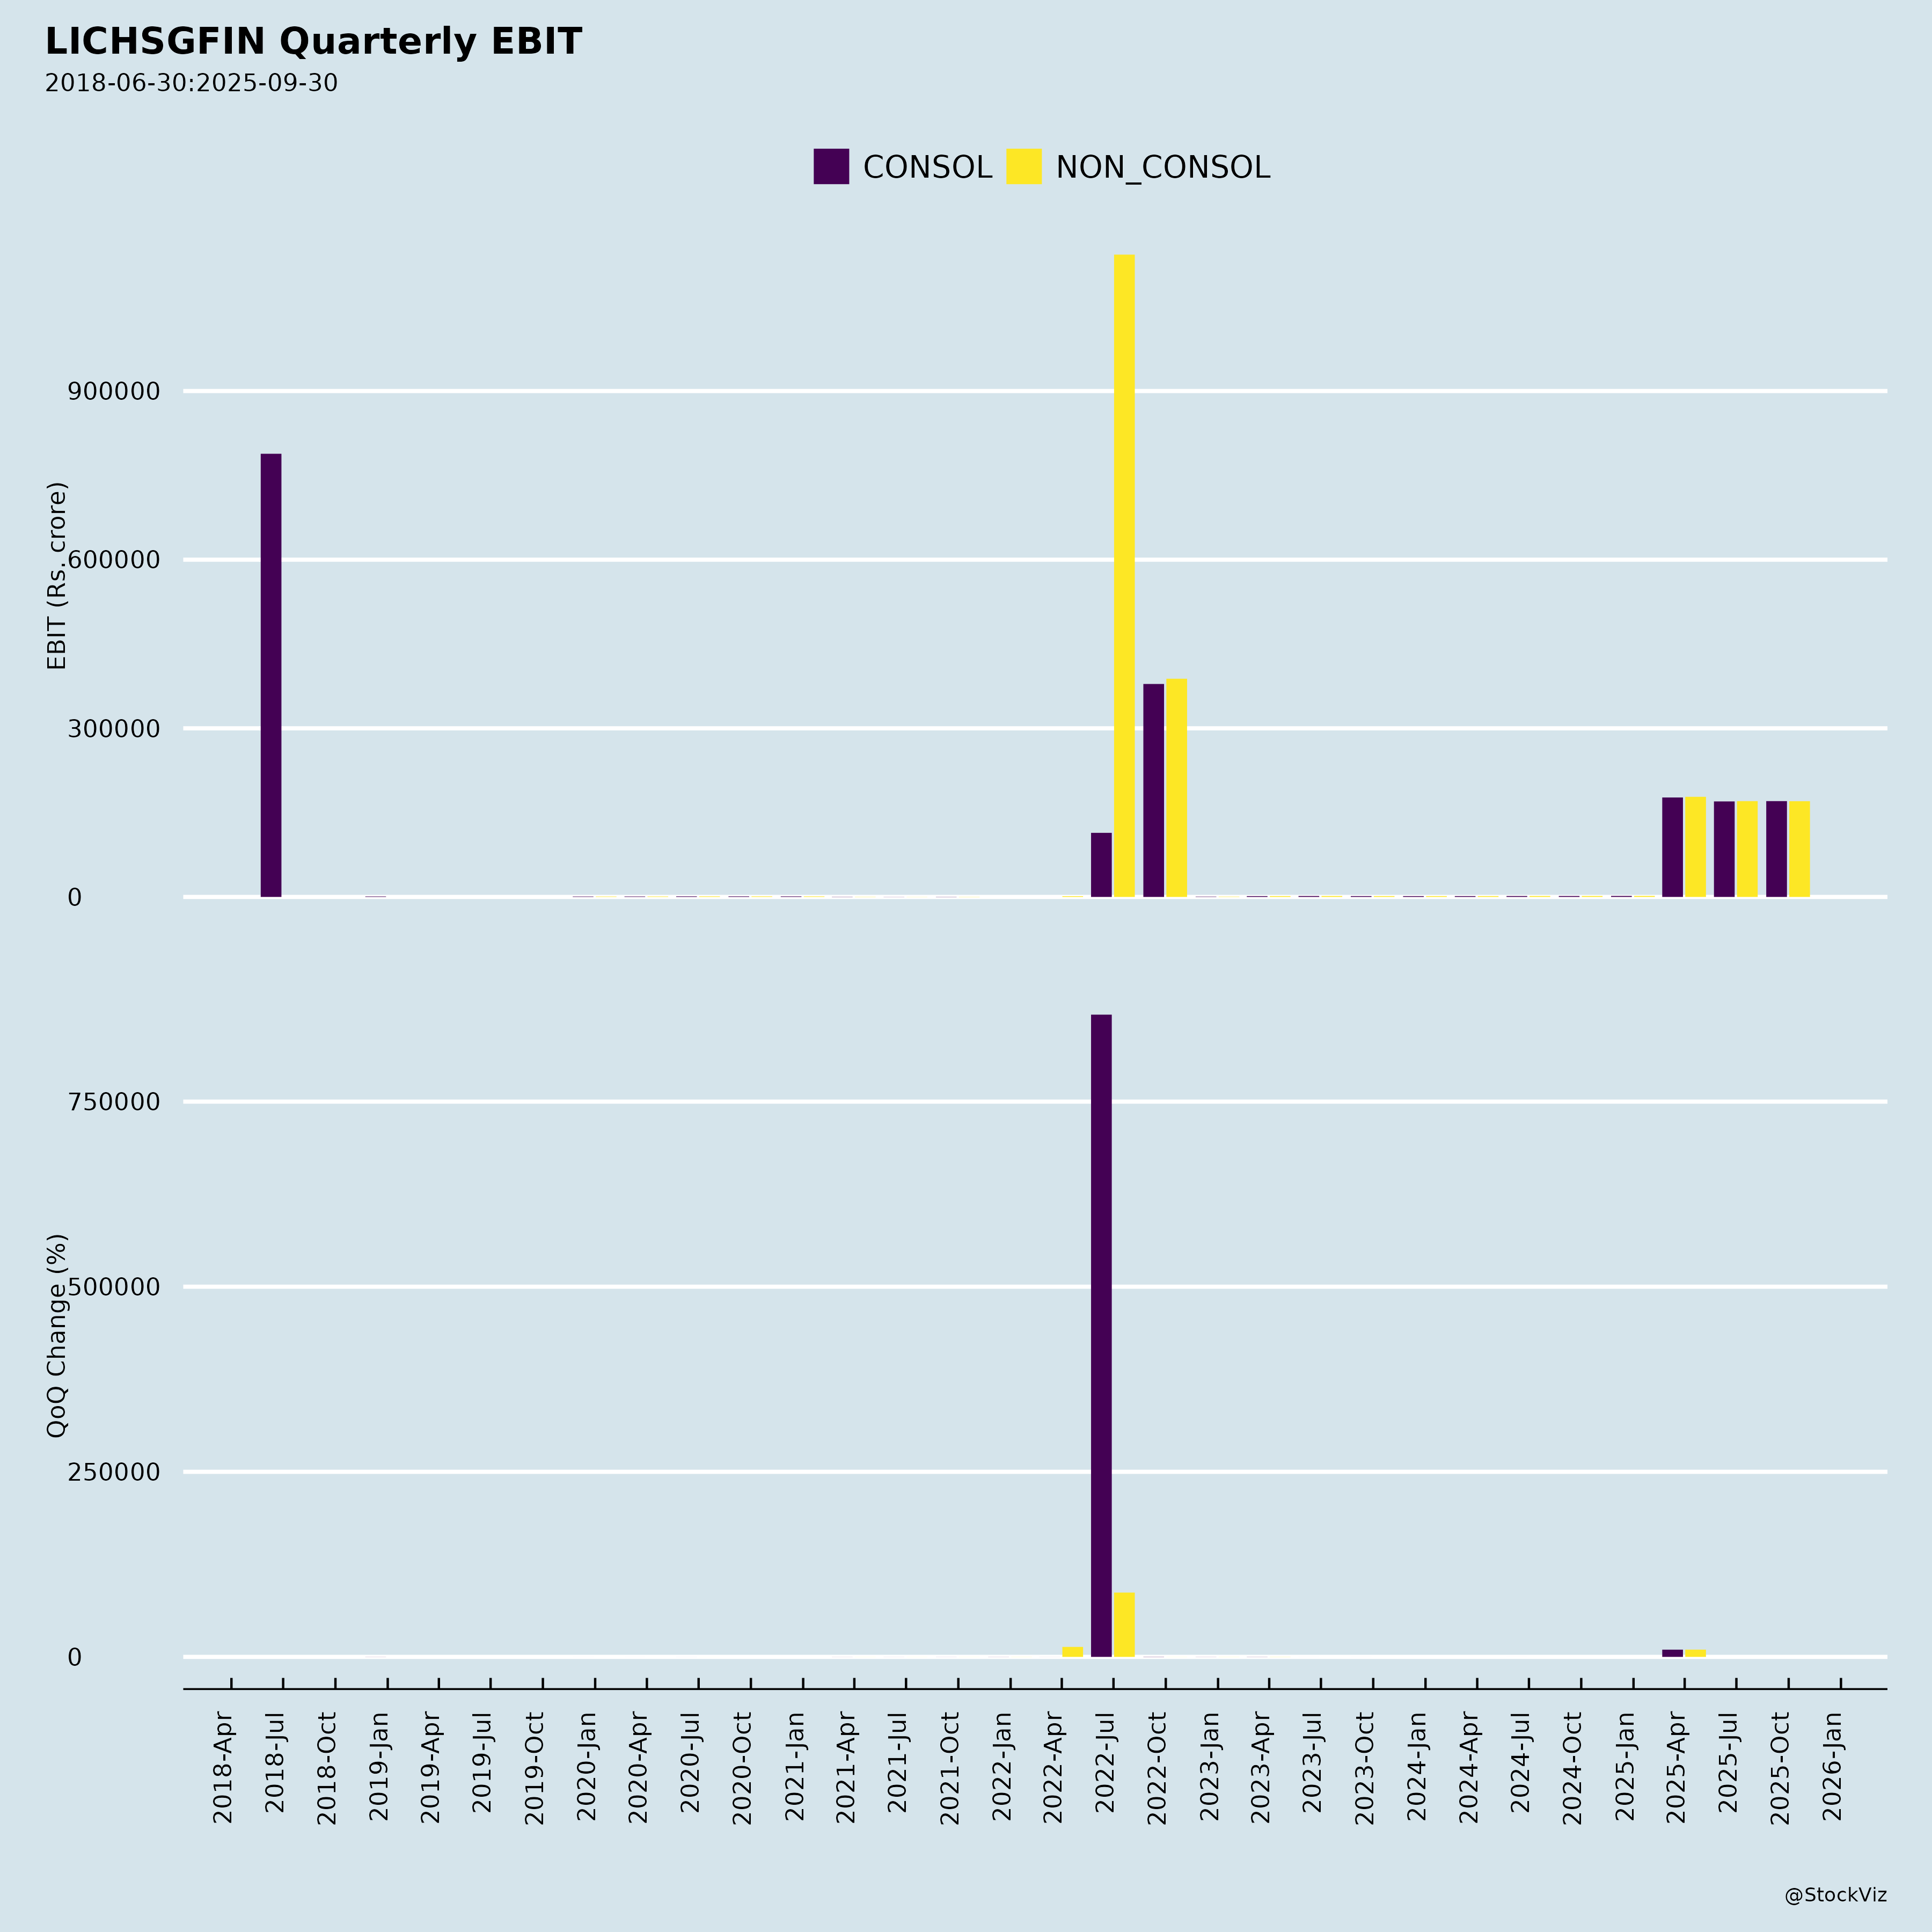
Profitability: Profit Before Tax increased 11% to Rs. 1,888.43 crores, and Profit After Tax rose 9.4% to Rs. 1,488.32 crores. Return on Average Assets improved to 1.85% from 1.76%, and Earnings Per Share rose to Rs. 27.06 from Rs. 24.72.
Asset quality improvement: Stage 3 Exposure at Default fell to 2.14% as of June 30, 2026, from 2.62% a year earlier. Stage 2 exposure declined to 2.60% from 3.58%, while Stage 1 rose to 95.26% from 93.80%. Total ECL provisions declined to Rs. 4,398.43 crores from Rs. 5,051.27 crores.
Impairment reversal: Impairment on financial instruments swung to a negative Rs. 164.23 crores in Q1 FY27 from a positive Rs. 121.67 crores in Q1 FY26, a variance of -235%.
Capital strength: Capital Adequacy Ratio stood at 25.48% as of March 2026 (Tier I at 24.20%), up from 23.20% as of March 2025. The company carries the highest credit rating AAA/Stable from CRISIL & CARE.
Structural demand drivers: Rapid urbanisation, rising household incomes, an expanding aspirational middle class, economic formalisation, digitalisation of credit assessment, and government initiatives such as PMAY 2.0 are cited as growth enablers. Product diversification into LAP and LRD segments is also highlighted.
Recognition: LIC Housing Finance was recognised by the National Housing Bank as ‘Best Housing Finance Company’ for the second consecutive year, and the company marked 37 years with the ‘Har Ghar Ka Humsafar’ campaign.
Stable rate outlook: Management expects a stable interest rate environment and a positive growth trajectory for the country.
3. Key Risks
- Competitive erosion: Pressure from banks, NBFCs, and 92 housing finance companies could constrain pricing power and market share.
- Margin sustainability: The decline in NIM and spreads, alongside a 1% fall in revenue from operations, indicates pressure on core profitability even as PAT grew.
- Asset quality tail: Despite improvement, Stage 3 EAD remains at 2.14%, and the Provision Coverage Ratio (Stage III) declined to 48% from 51%, meaning lower coverage against existing Stage 3 exposure.
- Prepayment risk: Elevated prepayment rates (11.7% in Q1 FY27) can slow book growth and require continued origination to offset runoff.
- Concentration in floating rate book: 99% of individual loans are pure floating rate, exposing the portfolio to interest rate movements.
- Geopolitical spillover: External conflicts could affect the domestic operating environment.
- Legacy NPA overhang: Approximately 11,000 loans in NPA continue to require resolution and provisioning attention.
4. Management Guidance Versus Observed Performance
Guidance on growth: Management targets double-digit growth in both the disbursement book and loan book for the current financial year and the next two to three years. Observed Q1 FY27 performance shows total disbursements up 14.5% (double-digit, consistent with guidance), but the outstanding loan portfolio grew only 4% year-on-year — below the double-digit ambition, partly reflecting prepayments and portfolio runoff.
Guidance on ROE: Management aims to improve ROE to upwards of 15%–16%. Observed Return on Average Equity for Q1 FY27 was 14%, down from 15% in Q1 FY26 — currently below the stated target range.
Guidance on asset quality: Management targets a GNPA ratio of 1.9% or lower. Observed Stage 3 EAD stood at 2.14% as of June 30, 2026 — improved from 2.62% but still above the stated target. For FY 2025-26, Gross NPAs were reported at 2.15%.
Guidance on healthy ROA, ROE, and asset quality: Return on Average Assets improved to 1.85% in Q1 FY27 from 1.76% in Q1 FY26, moving in the intended direction, while ROE and asset quality remain works in progress relative to stated targets.
FY 2025-26 reference points: For the prior financial year, the loan book reached Rs. 320,707 crores, total disbursements were Rs. 66,544 crores, revenue from operations was Rs. 28,765 crores, PAT was Rs. 5,595 crores, NIM was 2.68%, and Gross NPAs fell to 2.15%. The Board proposed a 500% dividend of Rs. 10 per share on a face value of Rs. 2.
Broker Narrative
Brokers began with Buy calls citing FY23 earnings strength, NIM expansion, and mortgage moats, while flagging muted loan growth, margin volatility, and stressed developer assets. By the last report the stance had shifted to Neutral, with loan growth still tepid (~4% YoY/flat QoQ) and NIM down to ~2.6%, but asset quality stable and developer finance re-rated from stress to a growth driver. The narrative moved from expecting resolution-led recoveries to power a re-rating to acknowledging no near-term catalyst amid competition, repayments, and cost pressures.
Fears that came true
- Muted loan growth and sluggish disbursements materialized, as the 1QFY27 book grew only ~4% YoY and was flat QoQ, with numerous subsequent reports ending in DISAPPOINTMENT.
- NIM volatility/materialization of margin pressure occurred, with NIM declining ~20bp QoQ to ~2.6% by the last report, coinciding with persistent negative actual returns.
- Cost of borrowings pressure persisted, with borrowing costs expected to rise 3-4bp and margins remaining compressed, contributing to DISAPPOINTMENT outcomes.
Optimism that failed
- Expected NIM expansion from dynamic pricing failed to hold, as intense competition and elevated BT-outs drove NIM down to ~2.6% by the last report.
- Retail mortgage moats failed to protect growth, as loan growth stayed tepid and the repayment rate rose to 17%, weighing on net loan growth.
- The hoped-for resolution/recovery-led re-rating failed to materialize in share-price terms, as repeated Buy calls after the first report delivered negative actual returns despite recoveries.
Broker Timeline
32 broker calls · 2023-05-17 to 2026-08-01
Copyright © 2023 SAS Data Analytics Pvt. Ltd. All rights reserved.