JSWCEMENT
Equity Metrics
January 13, 2026
JSW Cement Limited
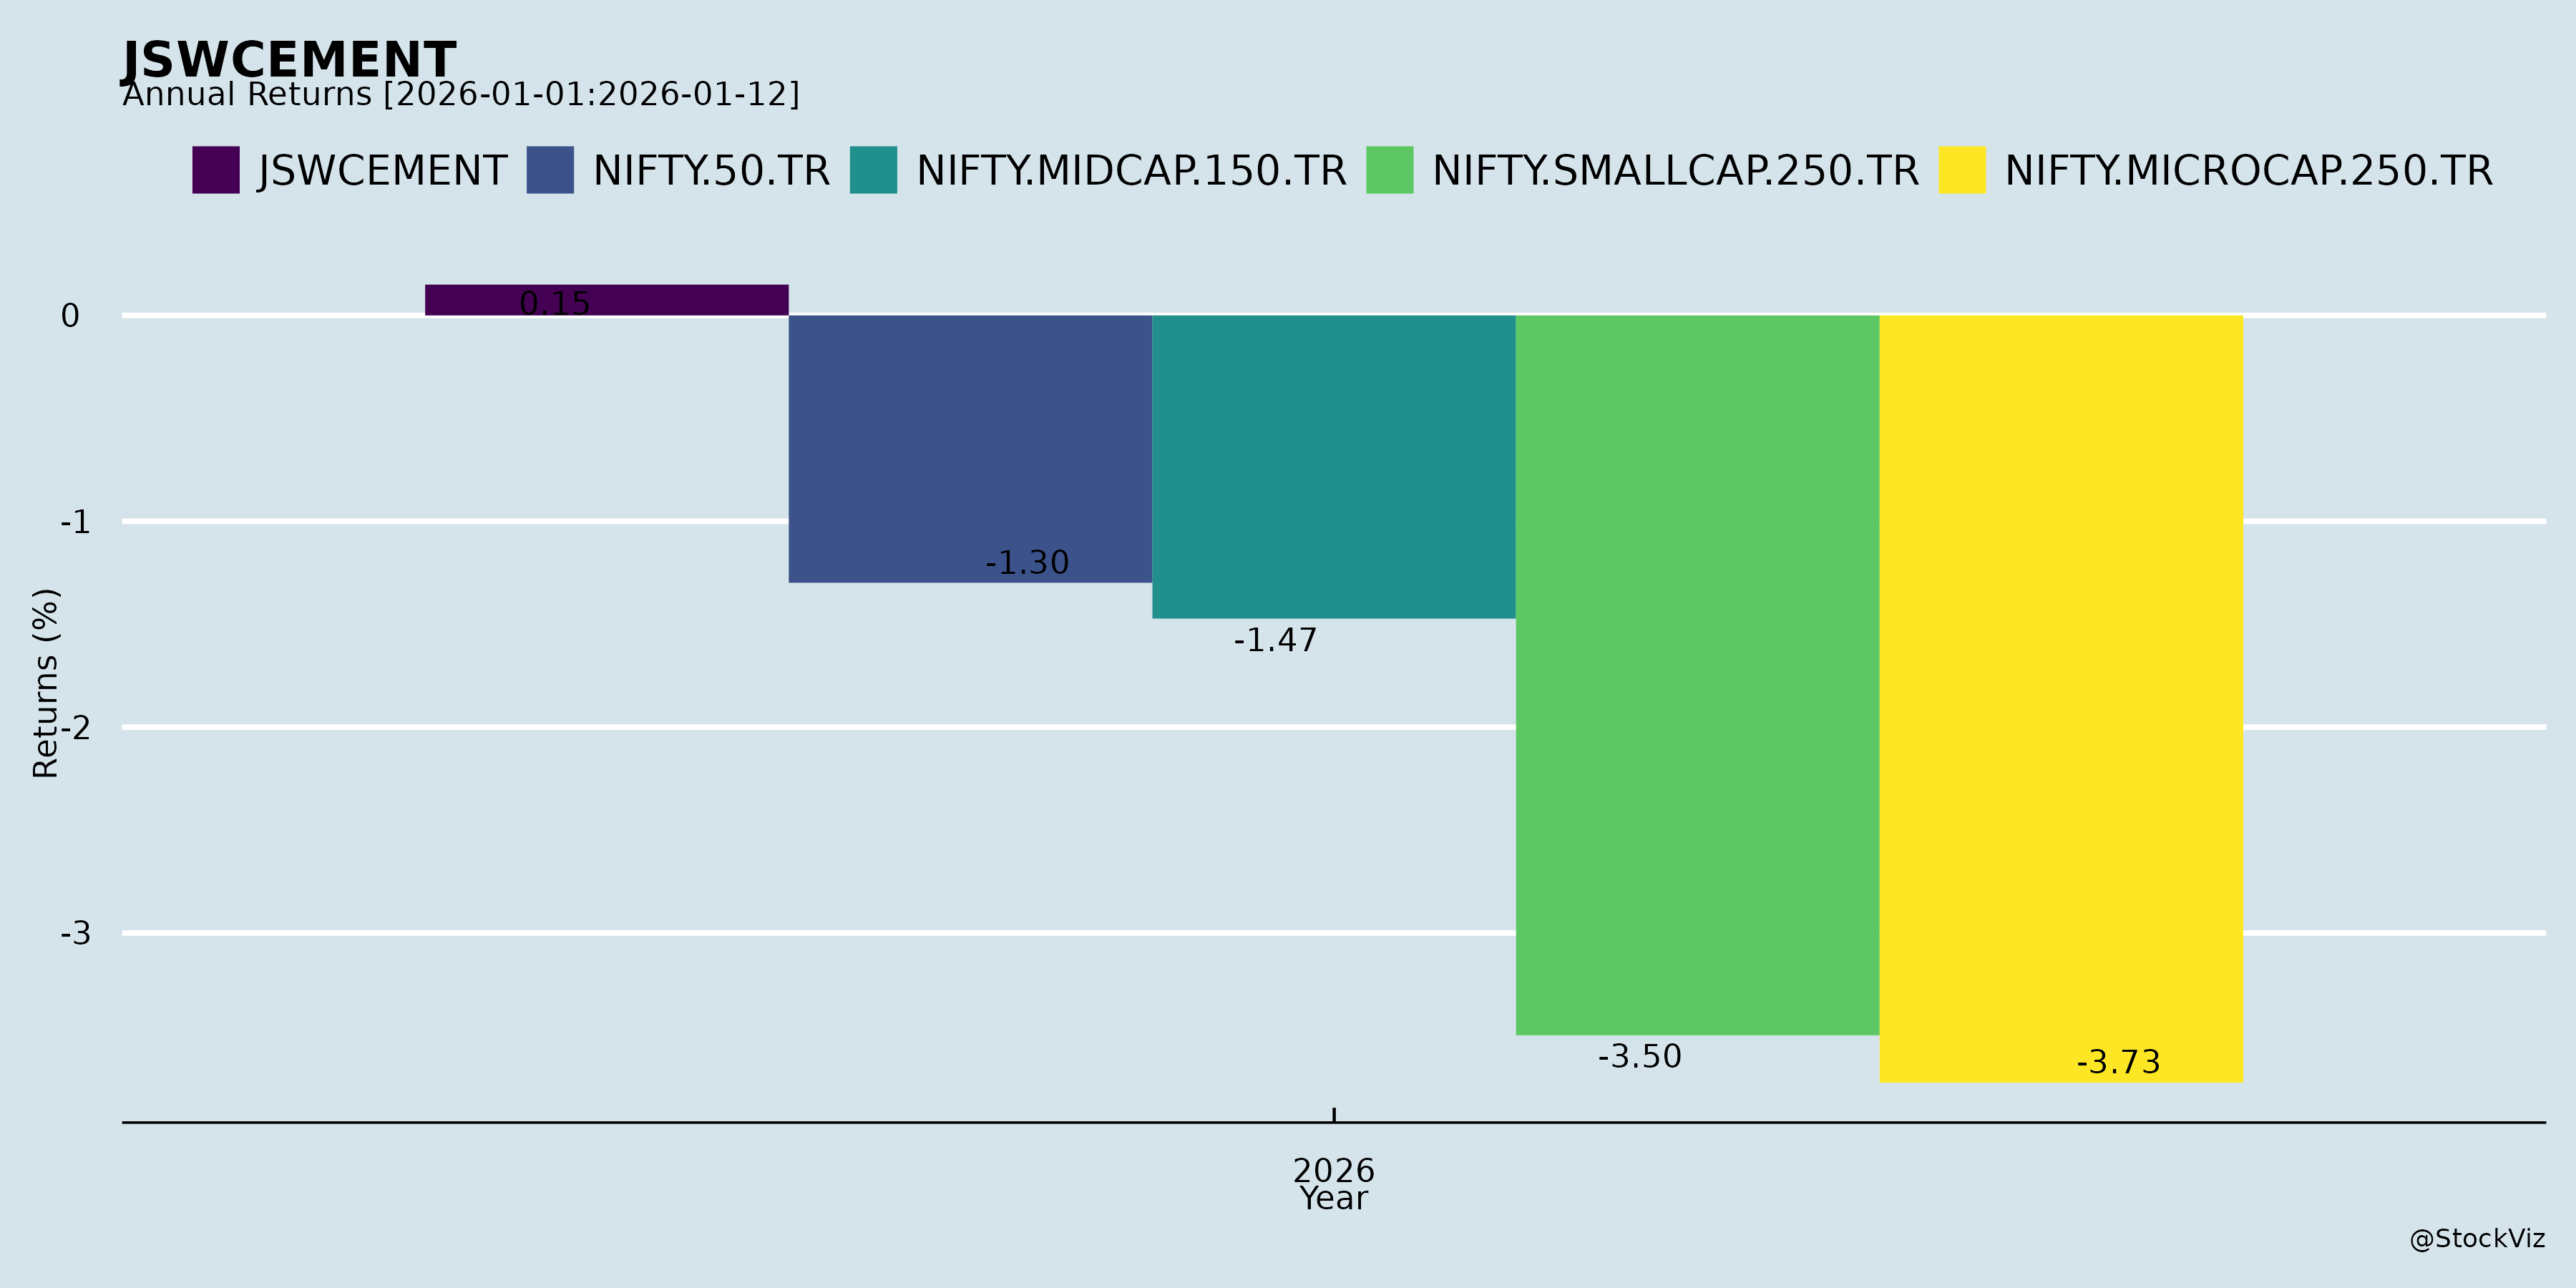
Annual Returns

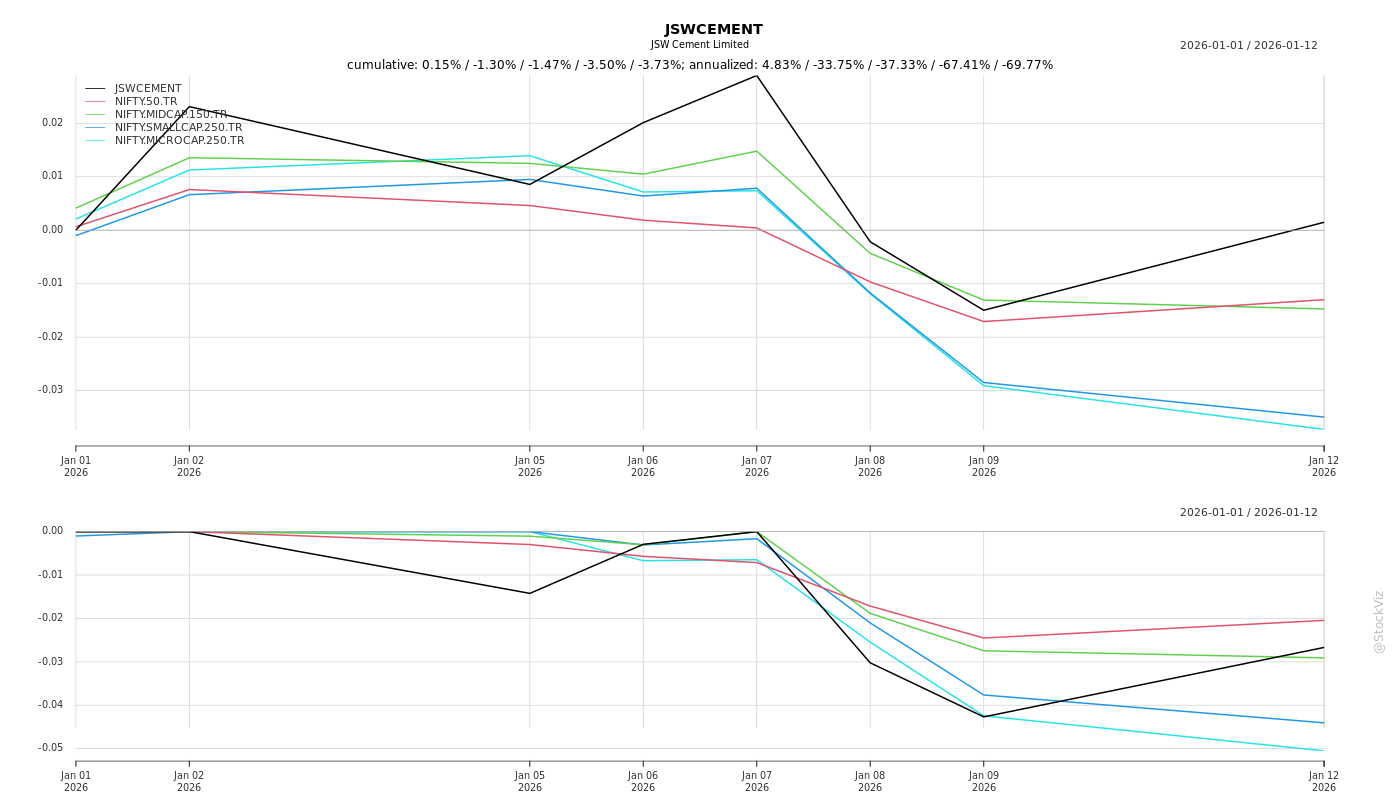
Cumulative Returns and Drawdowns
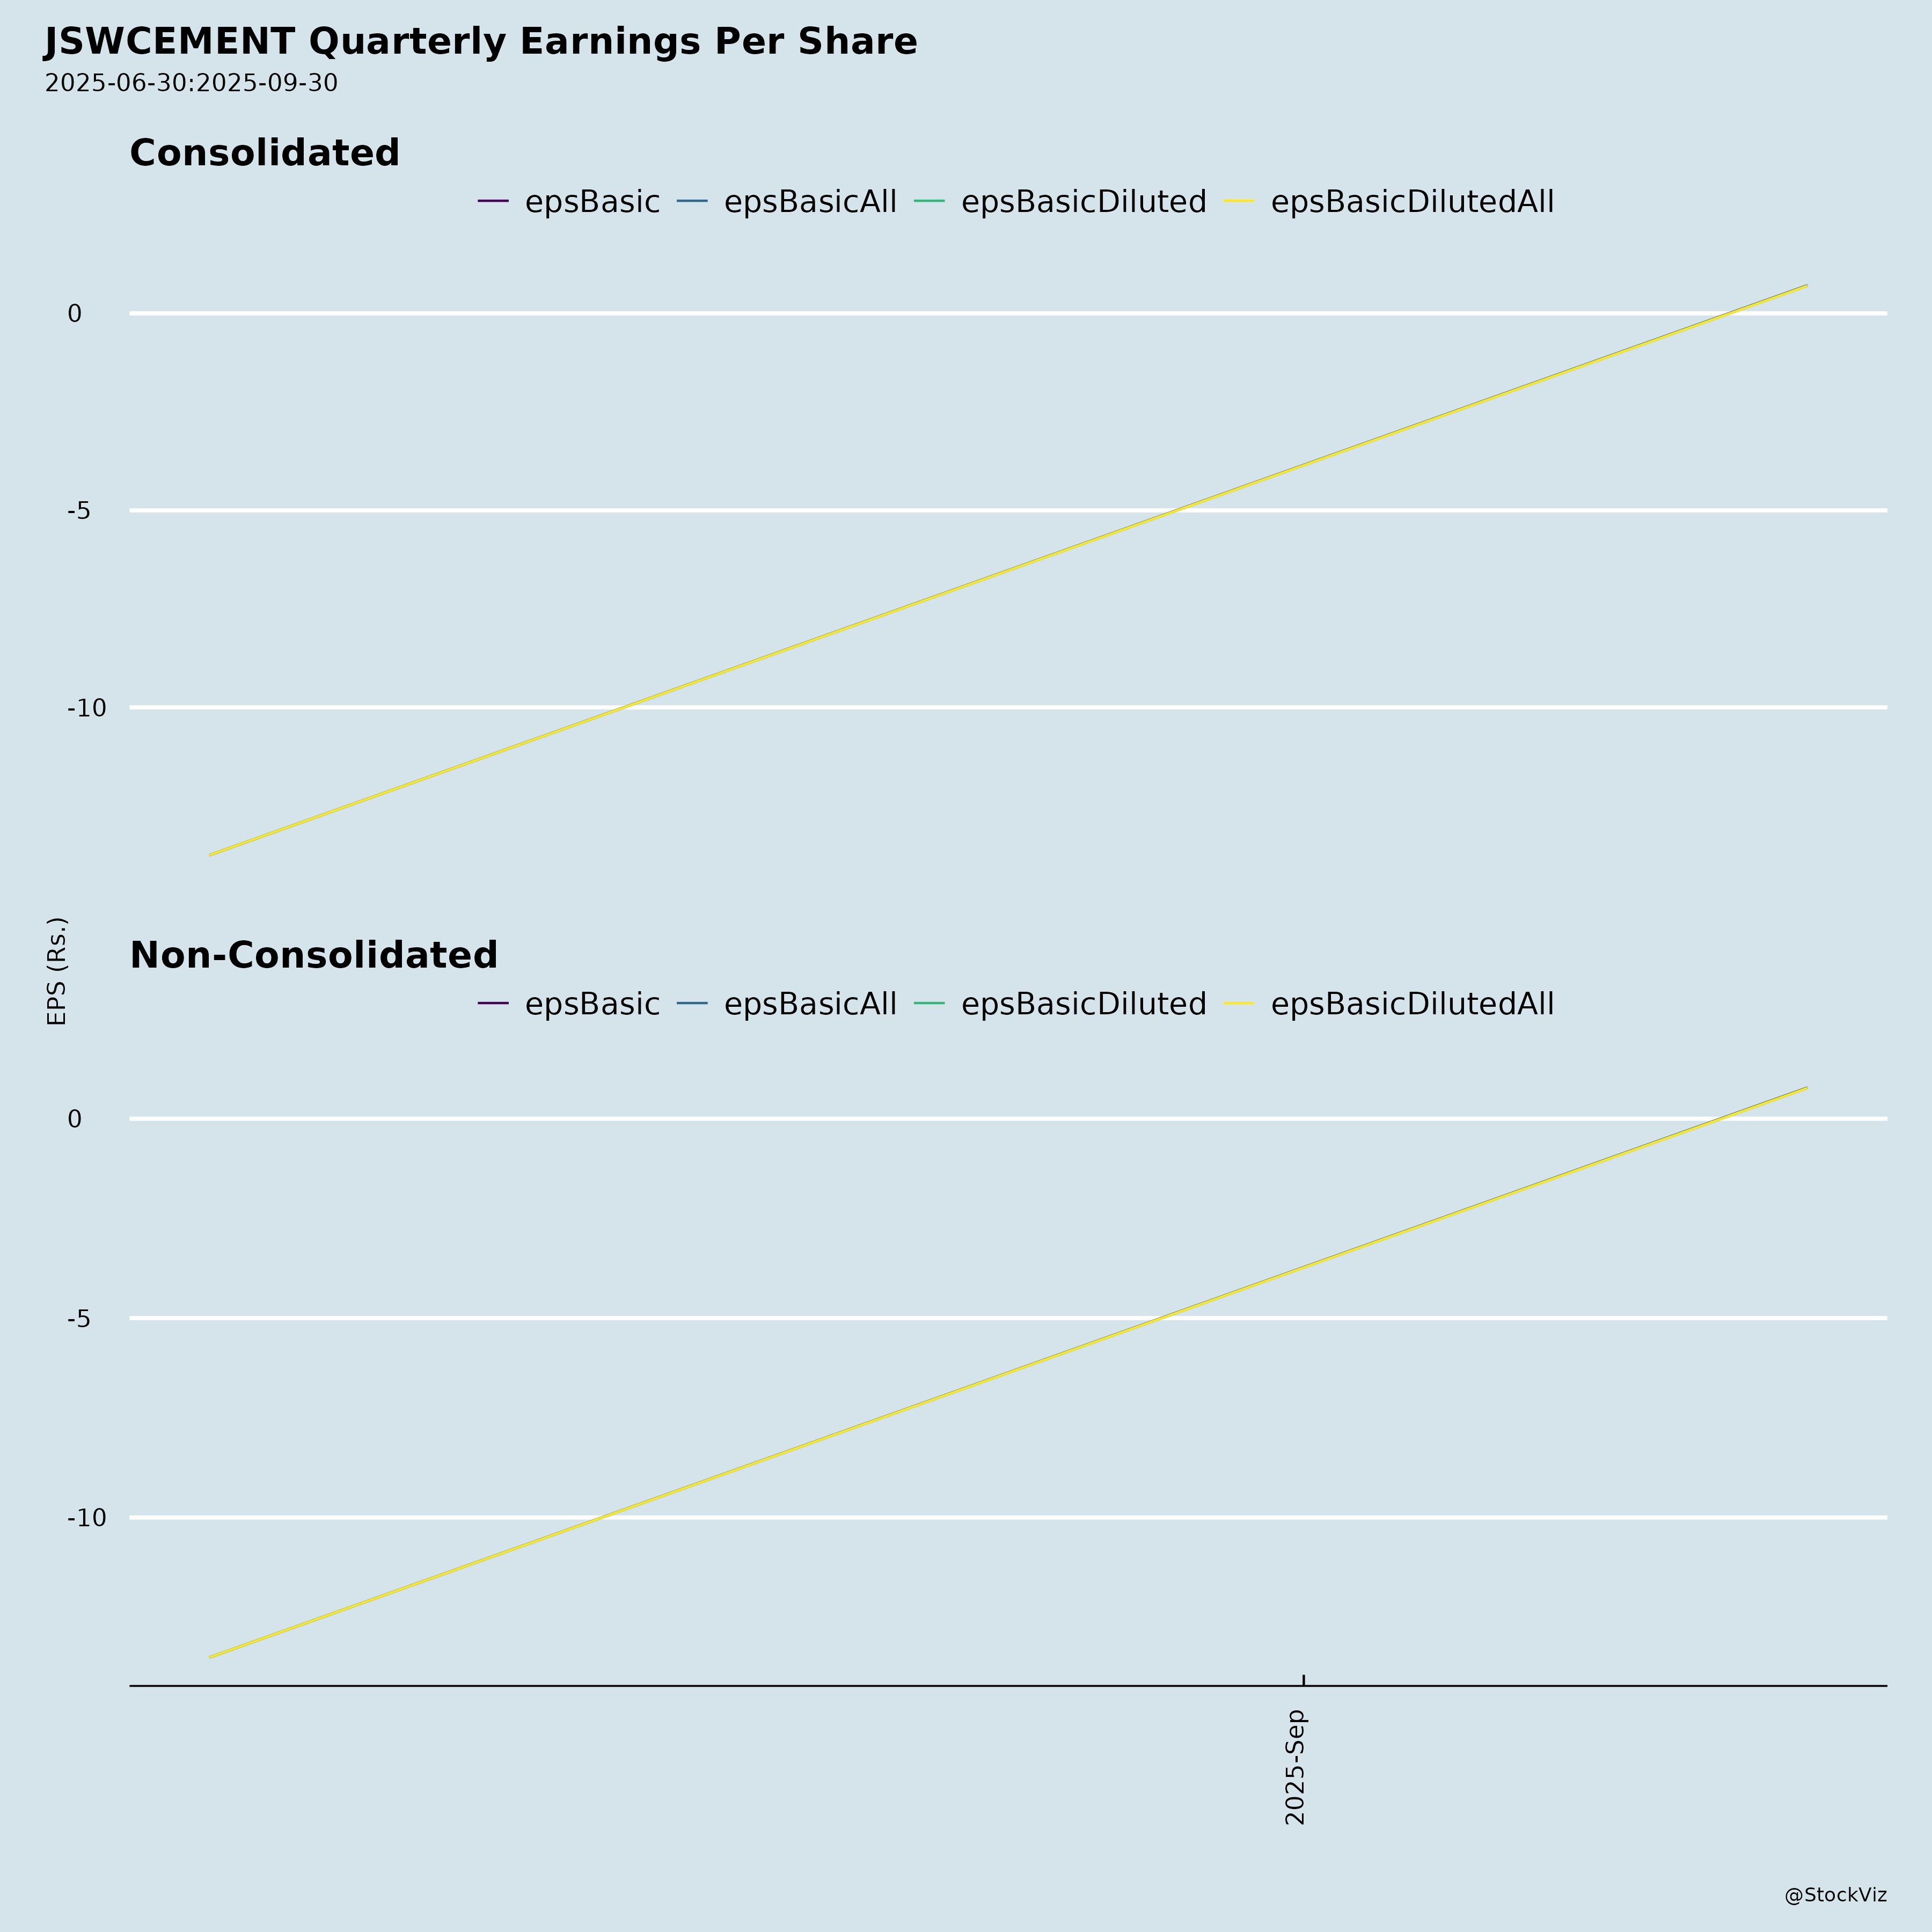
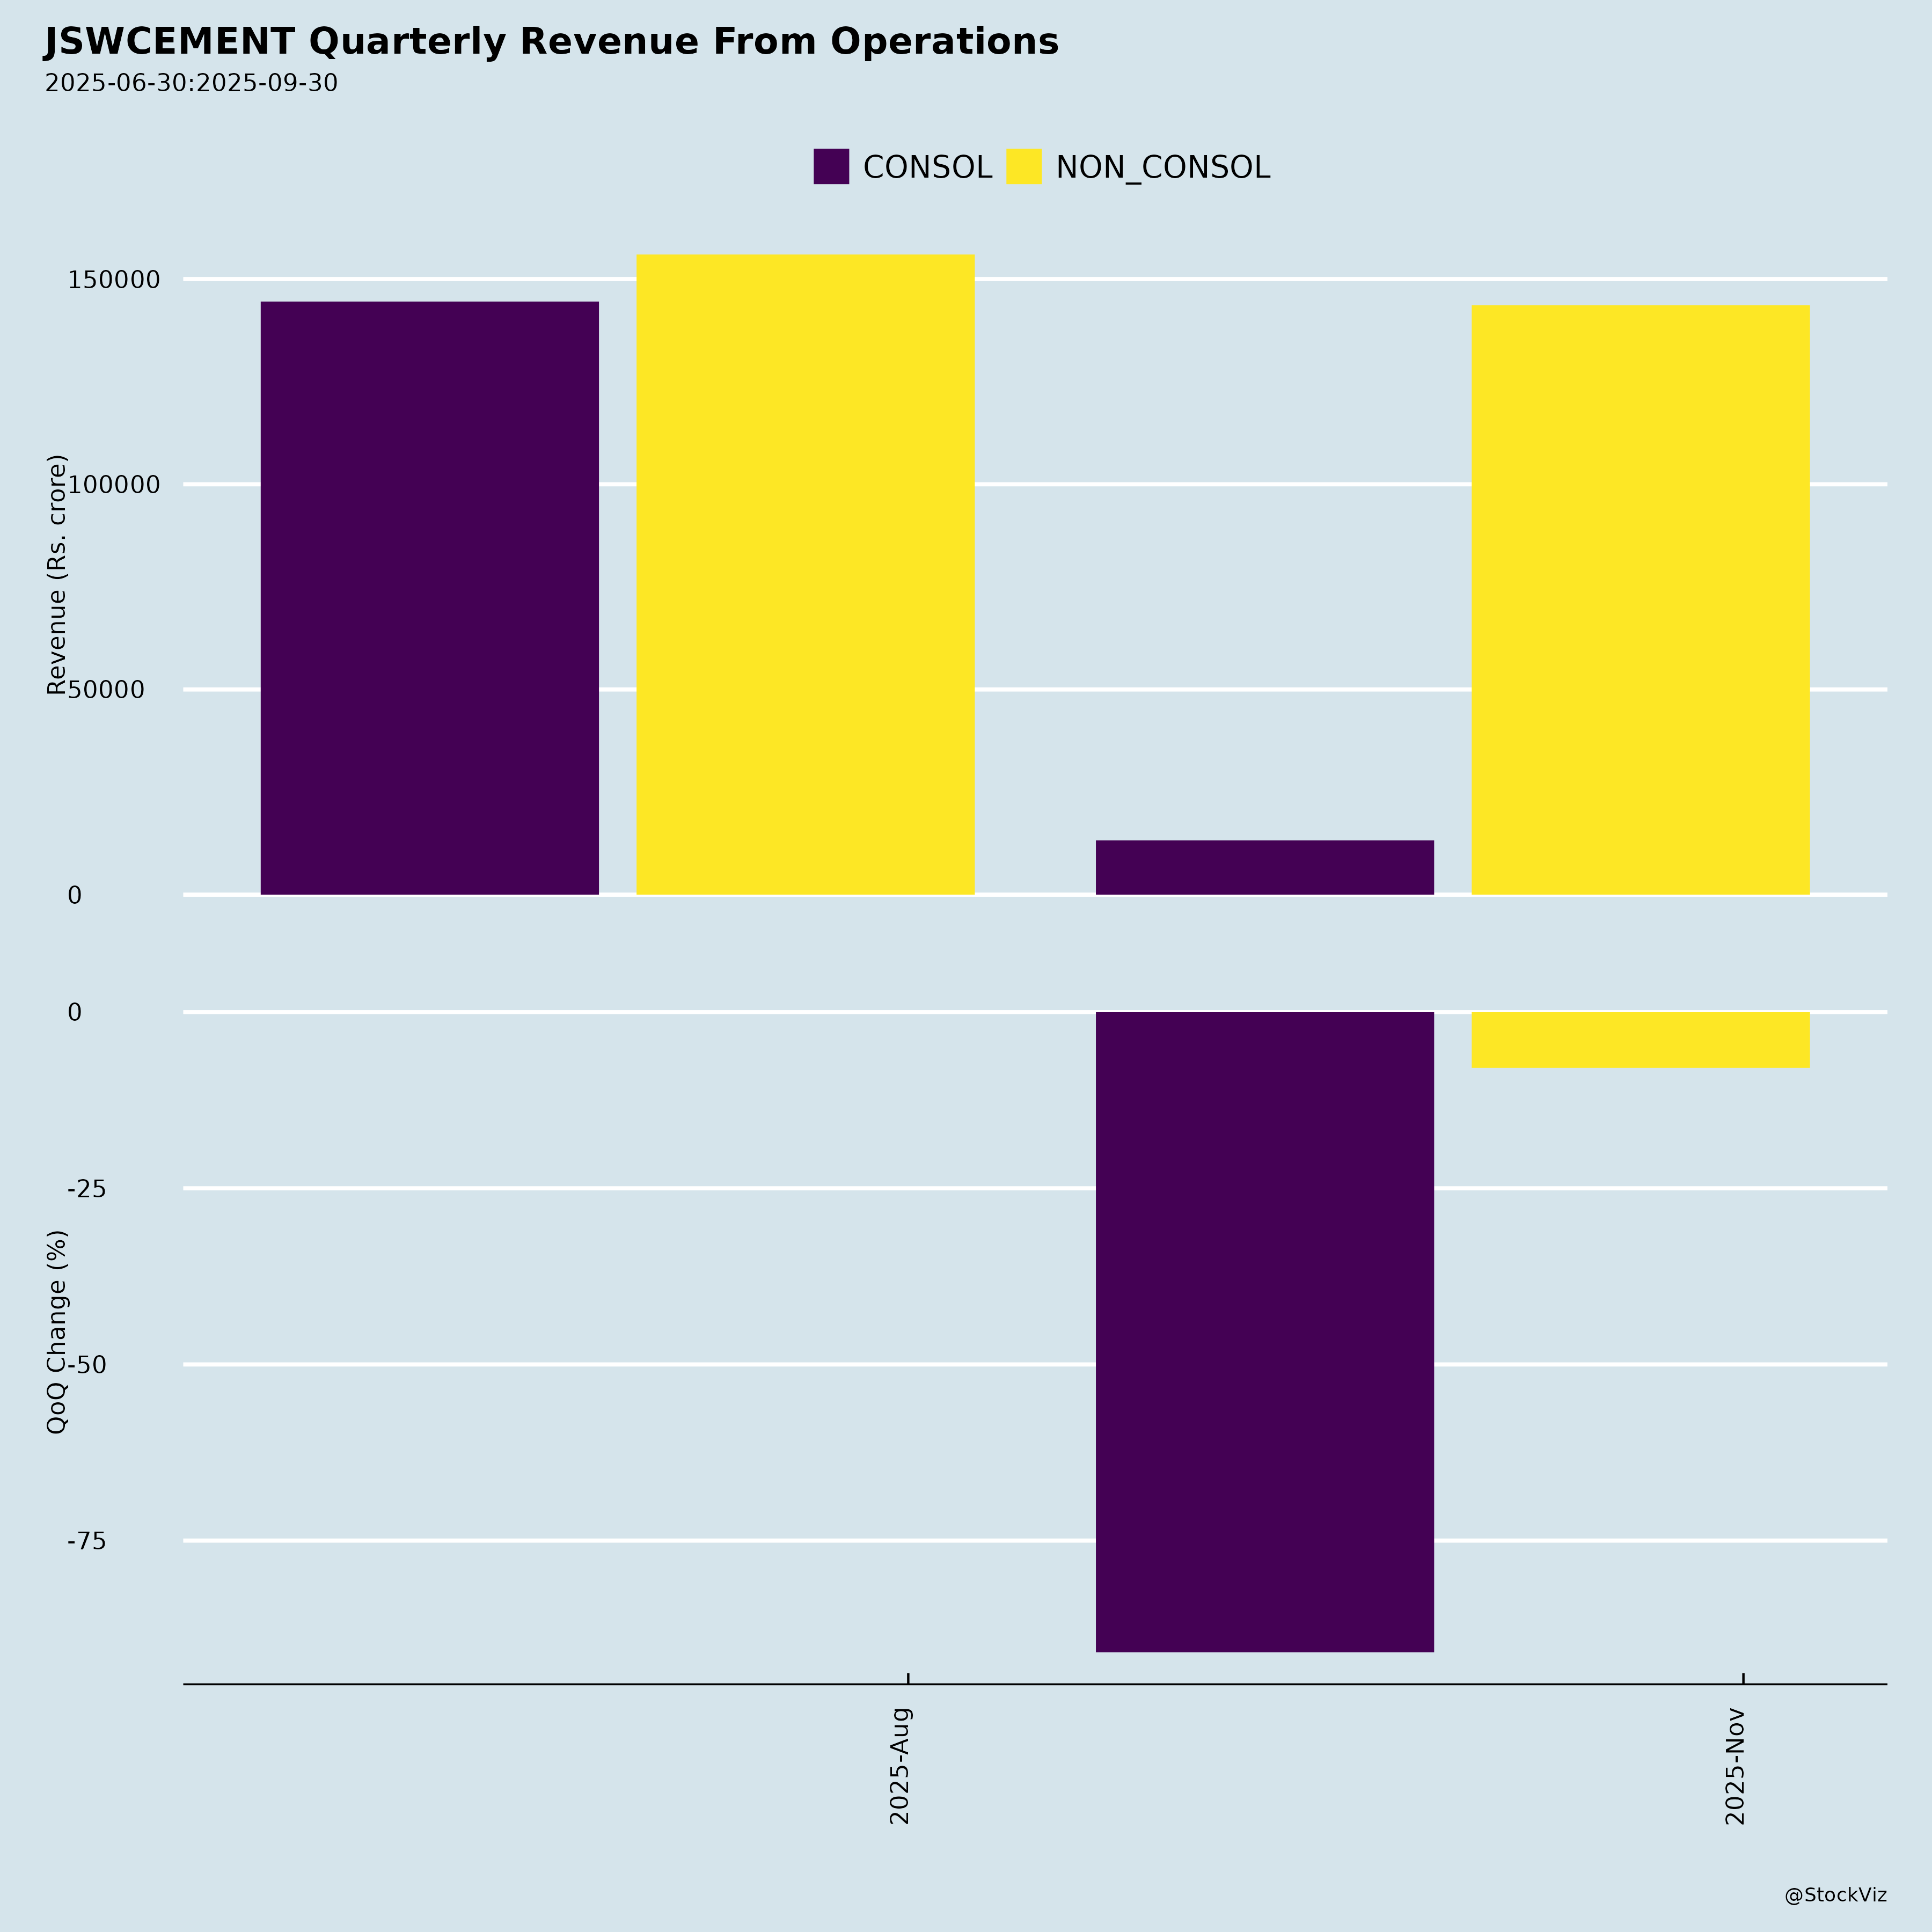
Fundamentals
Ownership
Margined
AI Summary
asof: 2025-12-03
Analysis of JSW Cement Limited (JSWCEMENT): Headwinds, Tailwinds, Growth Prospects, and Key Risks
JSW Cement Limited, part of the JSW Group, is a fast-growing cement player with 21.6 MTPA grinding capacity (as of Sep 2025), focusing on GGBS (84% market share) and low-CO2 products. Q2/H1 FY26 showed robust volume growth (15%/11% YoY) amid capacity ramps, but pricing softness QoQ. Post-IPO debt reduction supports expansions. Below is a structured summary based on the provided filings (Q2/H1 FY26 results, investor presentation, announcements).
Tailwinds (Positive Catalysts)
- Strong Operational Momentum: Total volumes hit 3.11 MT (Q2, +15% YoY) / 6.42 MT (H1, +11% YoY), driven by GGBS (+21% YoY Q2). Cement trade mix at 52.9%, clinker factor at 50% (low-cost).
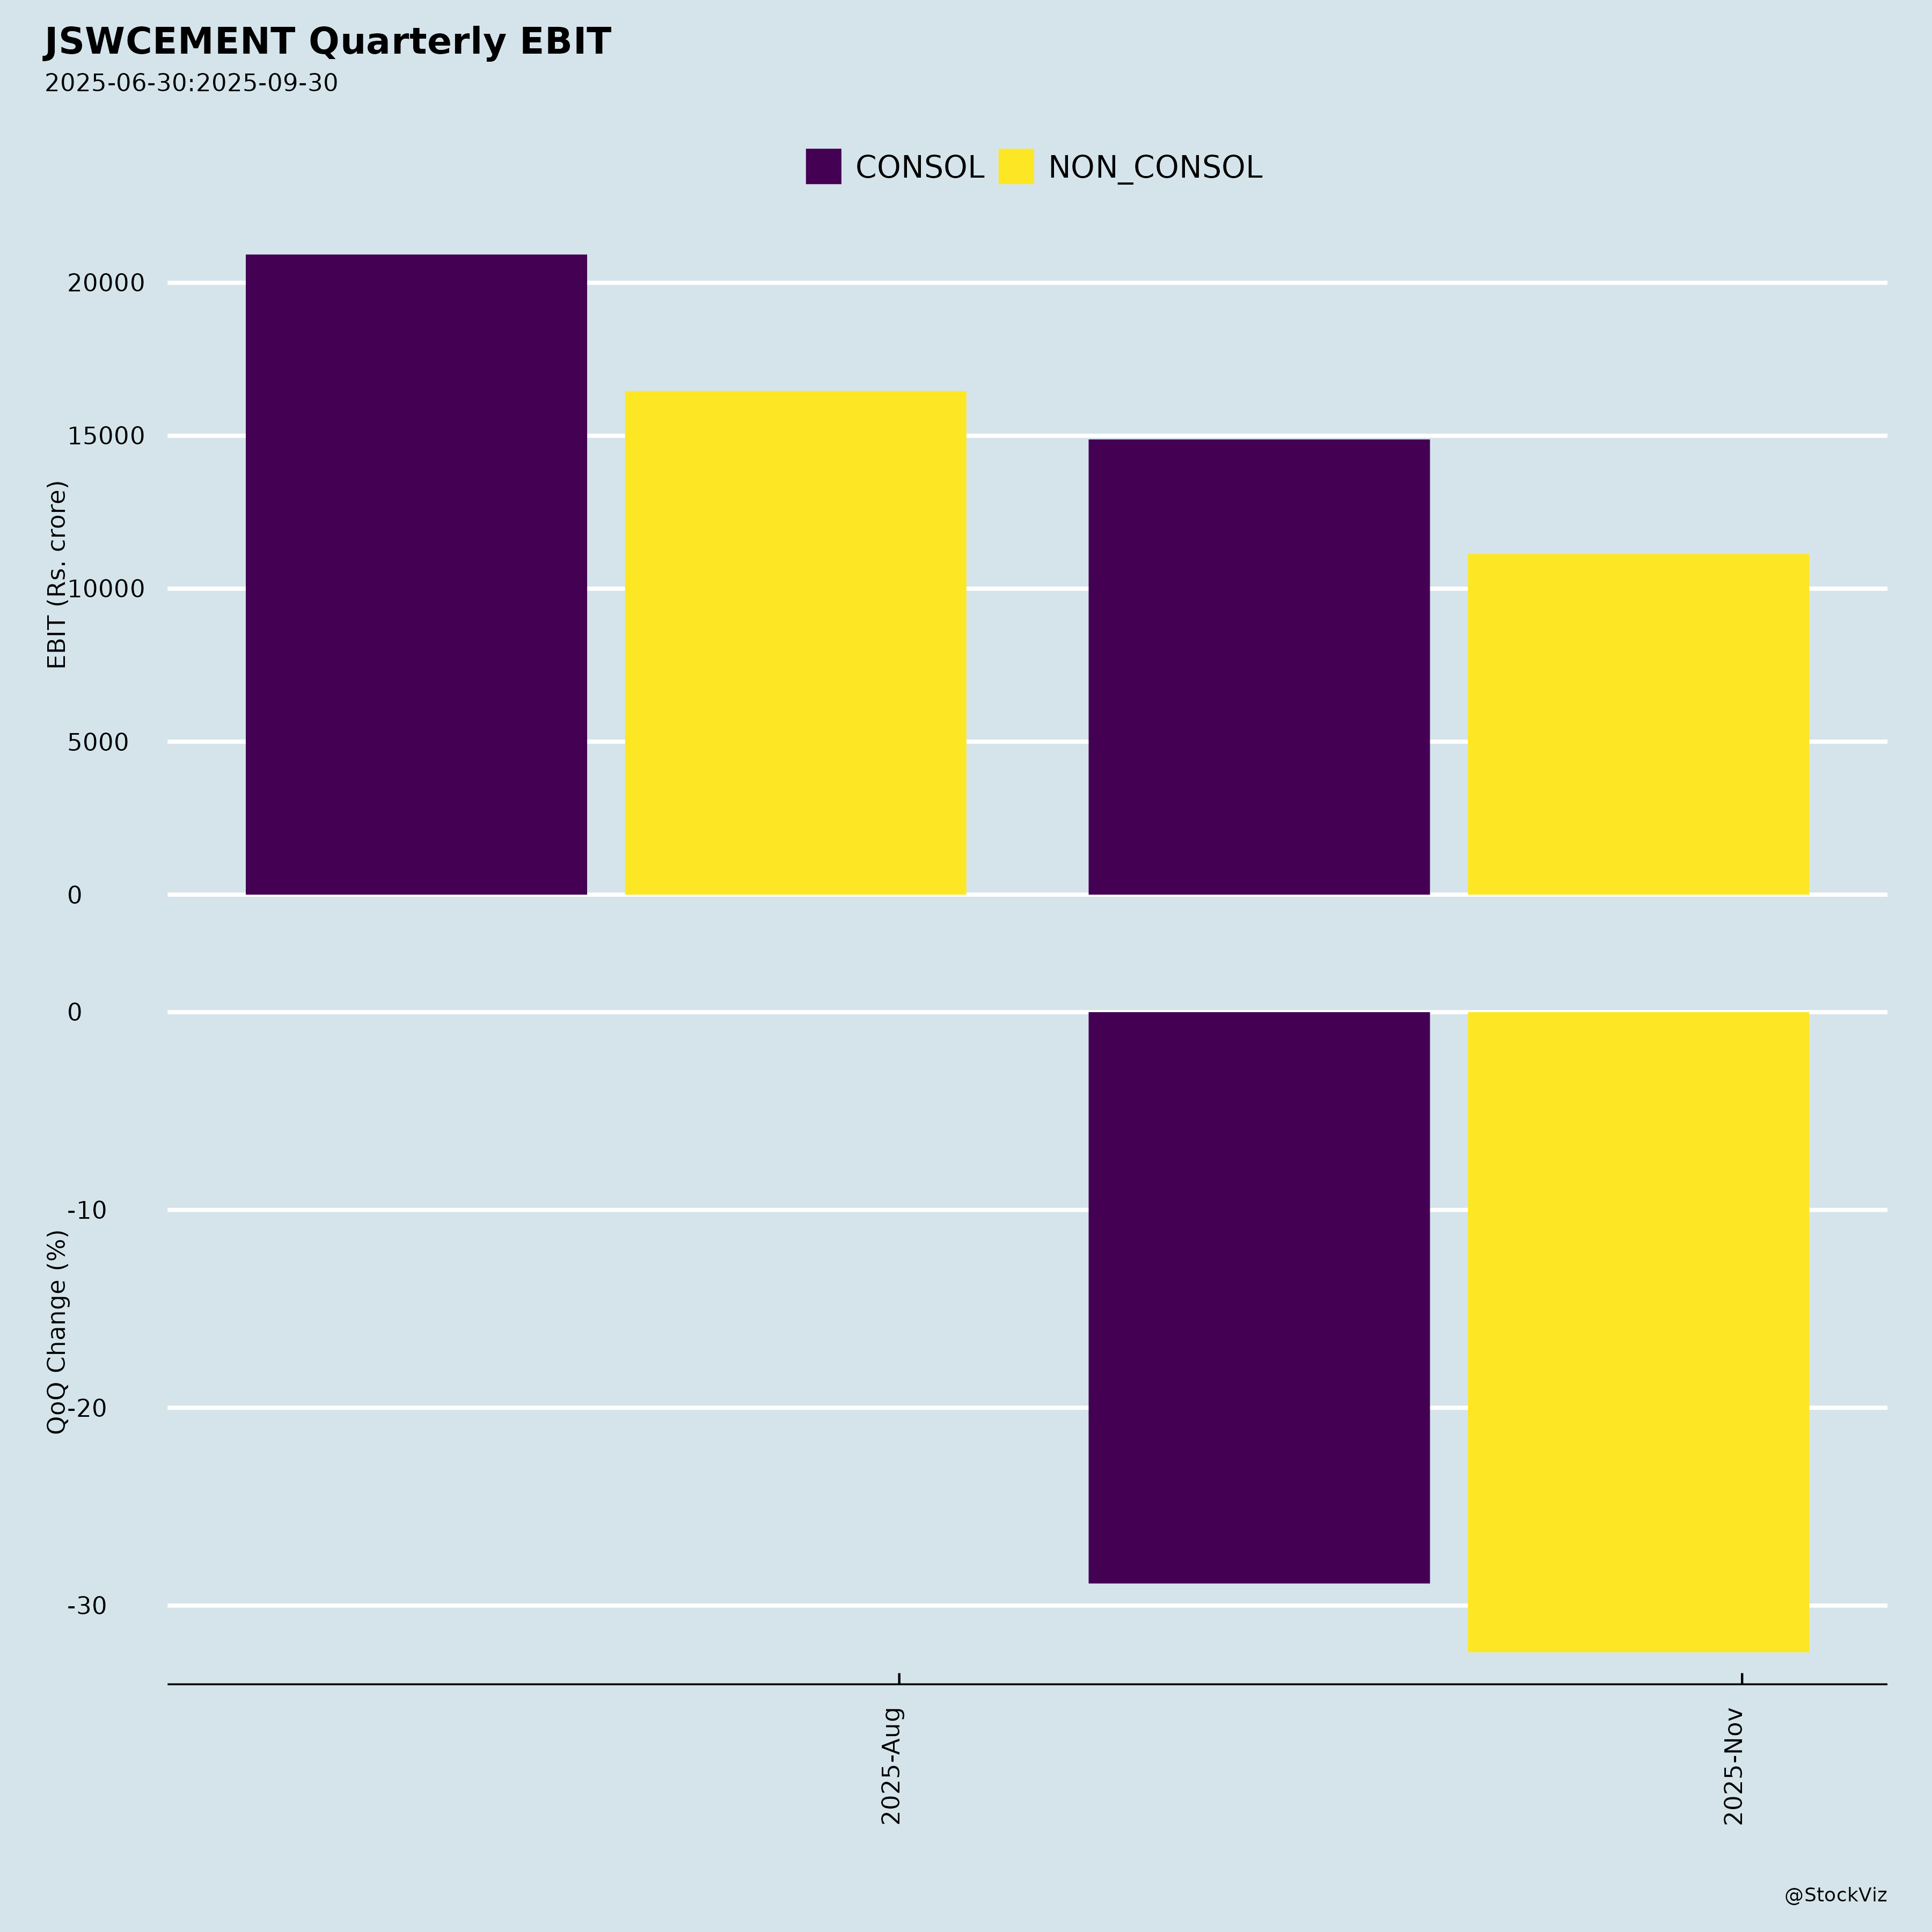
- Financial Resilience: Revenue +17% YoY (Q2: ₹1,436 Cr), Op. EBITDA +64% YoY (₹268 Cr, margin 18.6% vs. 13.3%). Per-ton EBITDA ₹860 (Q2). Costs down YoY (RM/P&F, logistics efficiencies).
- Group Synergies: Secured slag from JSW Steel (co-located plants), logistics/power access. Lowest CO2 intensity (258 kg/ton, 52% below peers).
- Sustainability Edge: GGBS leader (41% of sales, stable pricing ₹3,685/MT), demand tailwinds (14-15% CAGR FY25-30 vs. cement 7.5-8.5%). Used in infra (metro, airports, expressways).
- Improved Balance Sheet: Post-IPO, net debt fell to ₹3,231 Cr (Sep’25) from ₹4,566 Cr (Jun’25); Net D/E 0.53x (vs. 1.04x), Net Debt/EBITDA 2.8x.
- Macro Support: Infra capex front-loaded (51.8% H1 FY26 utilization), cement demand to grow on housing/infra (670-680 MT by FY30).
Headwinds (Challenges)
- Pricing Pressure: Cement realization -5.2% QoQ (₹4,638/MT), impacted EBITDA/ton (-17% QoQ to ₹860).
- Cost Volatility: Fuel/power costs up QoQ (though YoY down via mix/efficiencies). Logistics stable but lead distance key.
- Macro Moderation: GDP growth revised to 6.8% FY26 (from 6.5%), PMI softening, inflation at 2.6%. Geopolitical/tariff risks.
- Regional Demand Variance: East/South strong (8.5-9.5%/7-8% CAGR), but West/North slower (6-7.5%).
- One-Time Drag Resolved: CCPS conversion caused ₹1,466 Cr exceptional loss (Q1 FY26); no recurrence.
Growth Prospects
- Capacity Ramp: From 21.6 MTPA grinding to 41.85 MTPA (+94%) by CY2028+, with 13 MTPA clinker. Key milestones: | Project | Capacity | Status | |———|———-|——–| | Sambalpur GU (Odisha) | 1 MTPA | Commissioned Sep’25 | | Nagaur IU (Rajasthan) | 3.3 MTPA clinker + 3.5 MTPA grinding | Q4 FY26 | | Talwandi Sabo GU (Punjab) | 2.75 MTPA | Approvals in progress | | Others (Dolvi, Vijaynagar, etc.) | ~14 MTPA | FY26-28 |
- Pan-India Footprint: North entry via Nagaur; East/West/South dominance.
- GGBS Focus: 23% CAGR (FY15-25); RMC/infra adoption rising (50% OPC replacement potential).
- Capex Funding: H1 FY26 capex ₹964 Cr; IPO proceeds de-leveraging.
- Outlook: 12-15% vol. growth FY26; EBITDA/ton sustainable at ₹900+ on scale/efficiencies. Pan-India + green products = 2-3x capacity by FY30.
Key Risks
| Risk Category | Details | Mitigation |
|---|---|---|
| Execution | Delays in Nagaur/Punjab (95% equip. delivery; regulatory nods pending). Capex intensity high (₹964 Cr H1). | Phased rollout; JSW Group expertise. |
| Demand/Competition | Infra slowdown (51% H1 capex but pipeline-dependent); pricing wars (top 5 players ~50% capacity). | GGBS premiumization; 13k dealers/6k customers. |
| Costs/Inflation | Fuel/slag/power volatility; logistics (283 km lead). | Backward integration (12 limestone mines); WHRS. |
| Financial/Legal | Net debt ₹3,231 Cr; ₹340 Cr WB incentive claim litigated (Revocation Act). | Debt reduction trajectory; strong cash flows (₹508 Cr op. cash H1). |
| Regulatory/External | Environmental norms; geopolitical (tariffs); monsoon impacts. | Low CO2 leader; diversified regions. |
| One-Offs | CCPS resolved; related-party SPA (Algebra sale ₹192 Cr, non-material). | Clean post-IPO. |
Overall Outlook: Bullish on growth (expansions + GGBS) amid tailwinds from infra/JSW synergies. Near-term pricing headwinds offset by volumes/cost control. Valuation supported by 2x capacity target, but monitor execution/debt. Target upside on FY26 delivery. (Analysis as of Nov 2025 filings; current price not assessed.)
Copyright © 2023 SAS Data Analytics Pvt. Ltd. All rights reserved.