IOB
Equity Metrics
January 13, 2026
Indian Overseas Bank
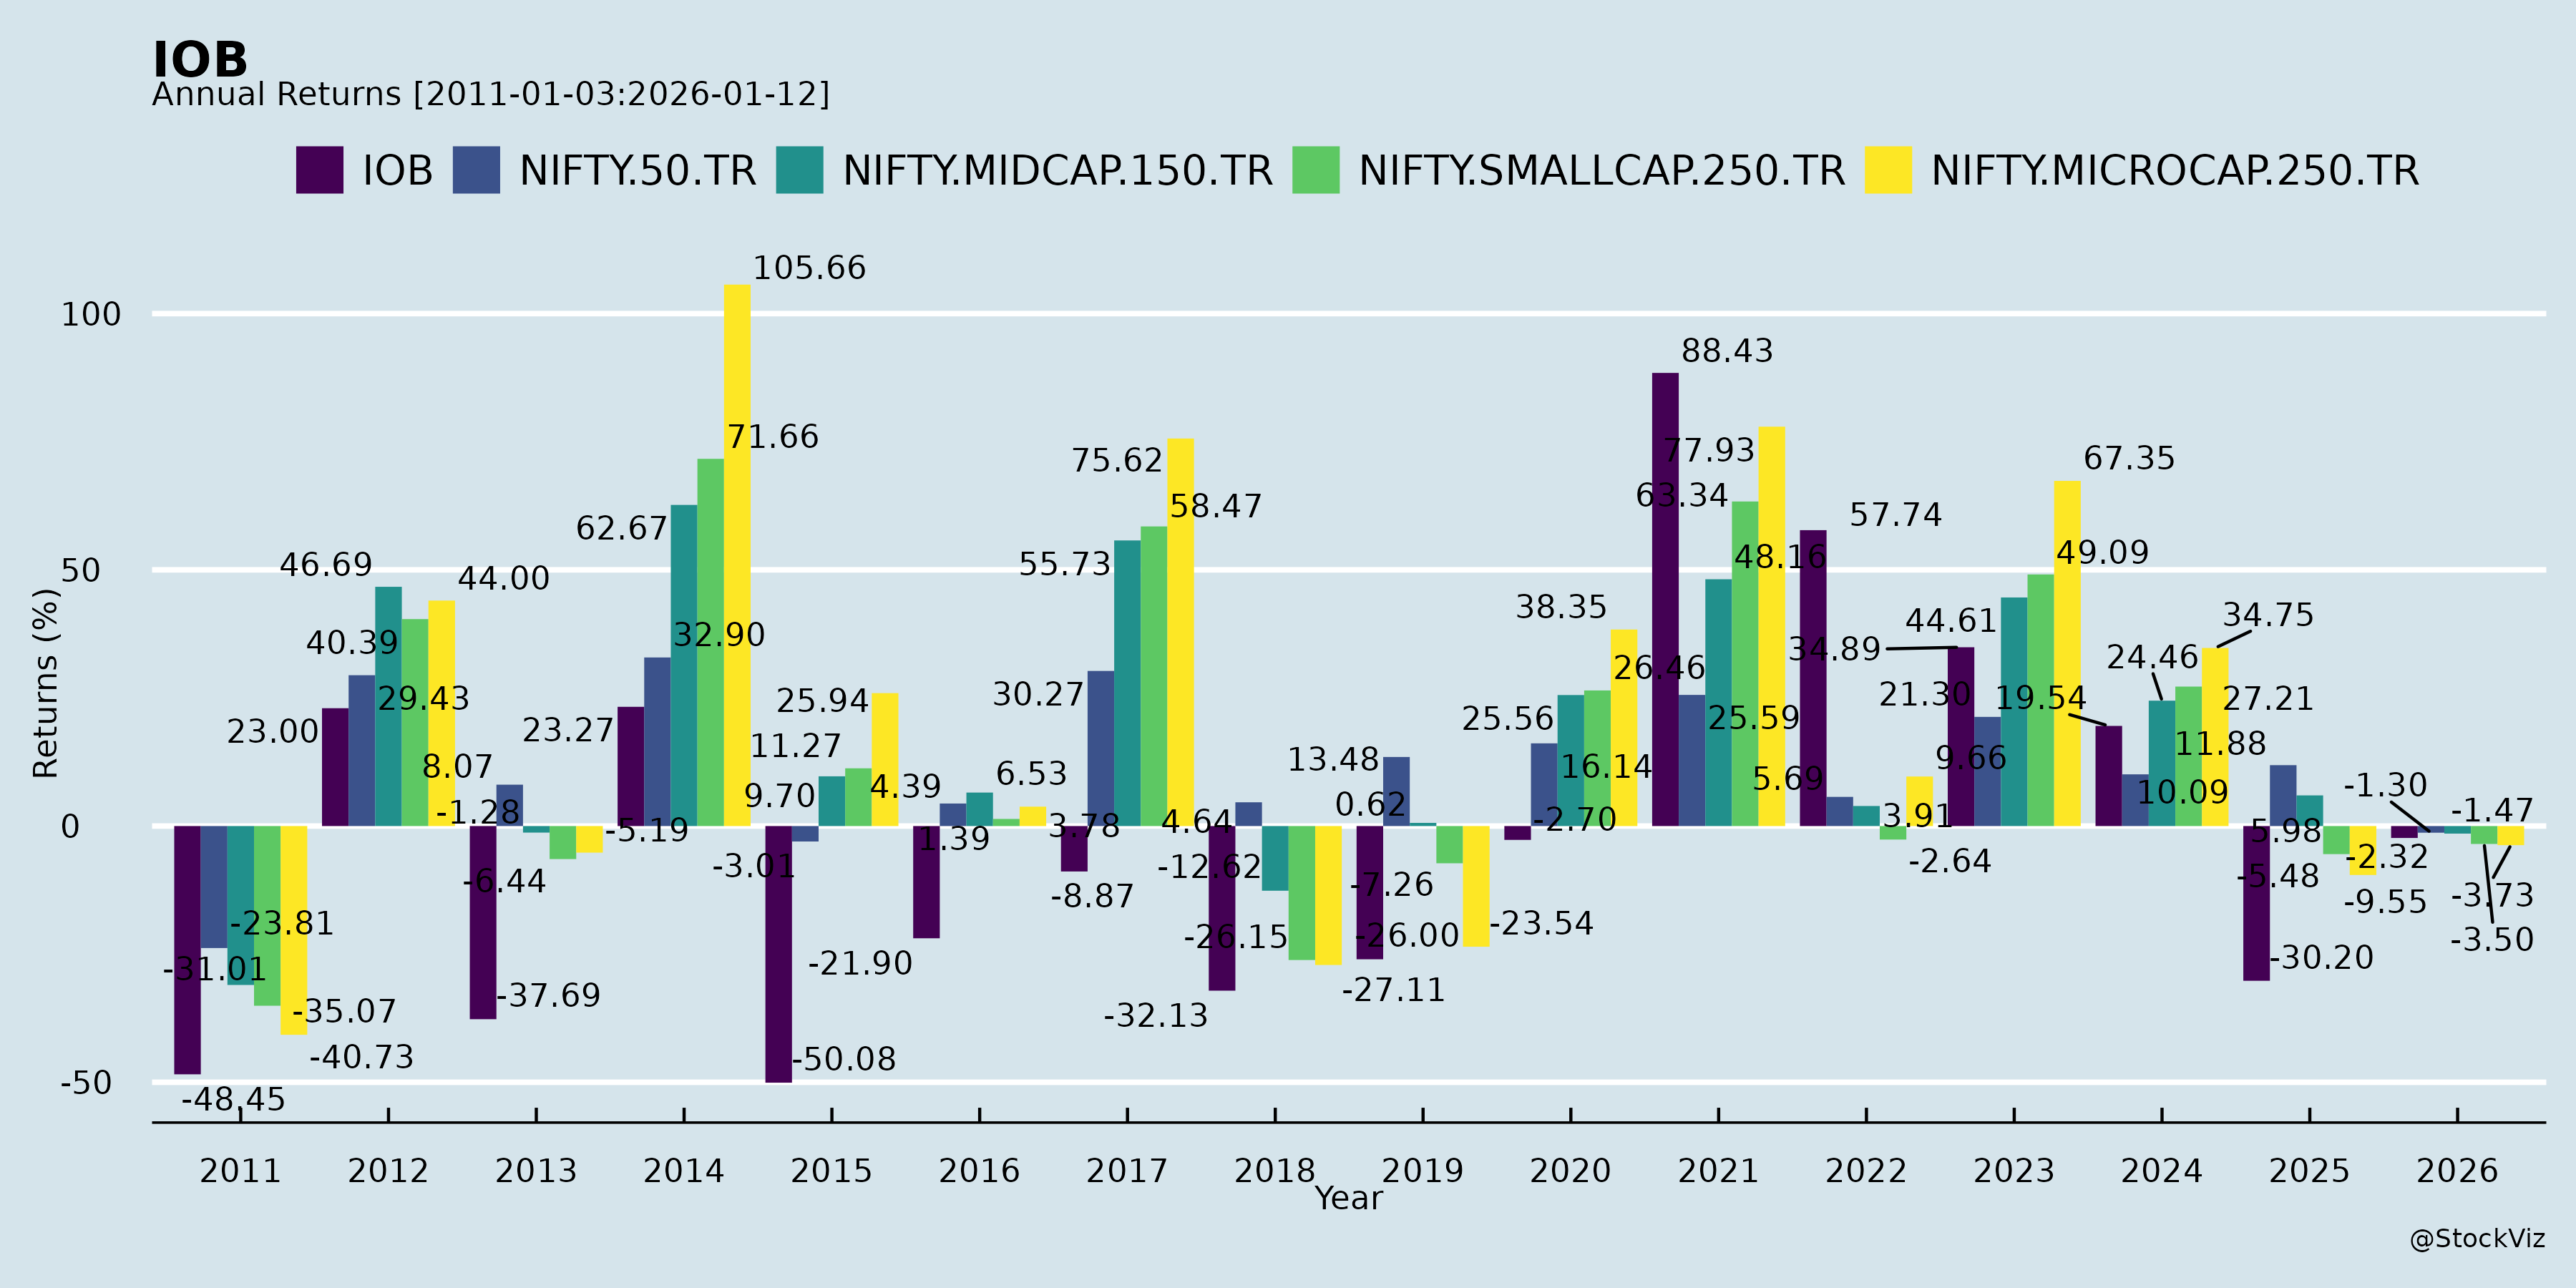
Annual Returns
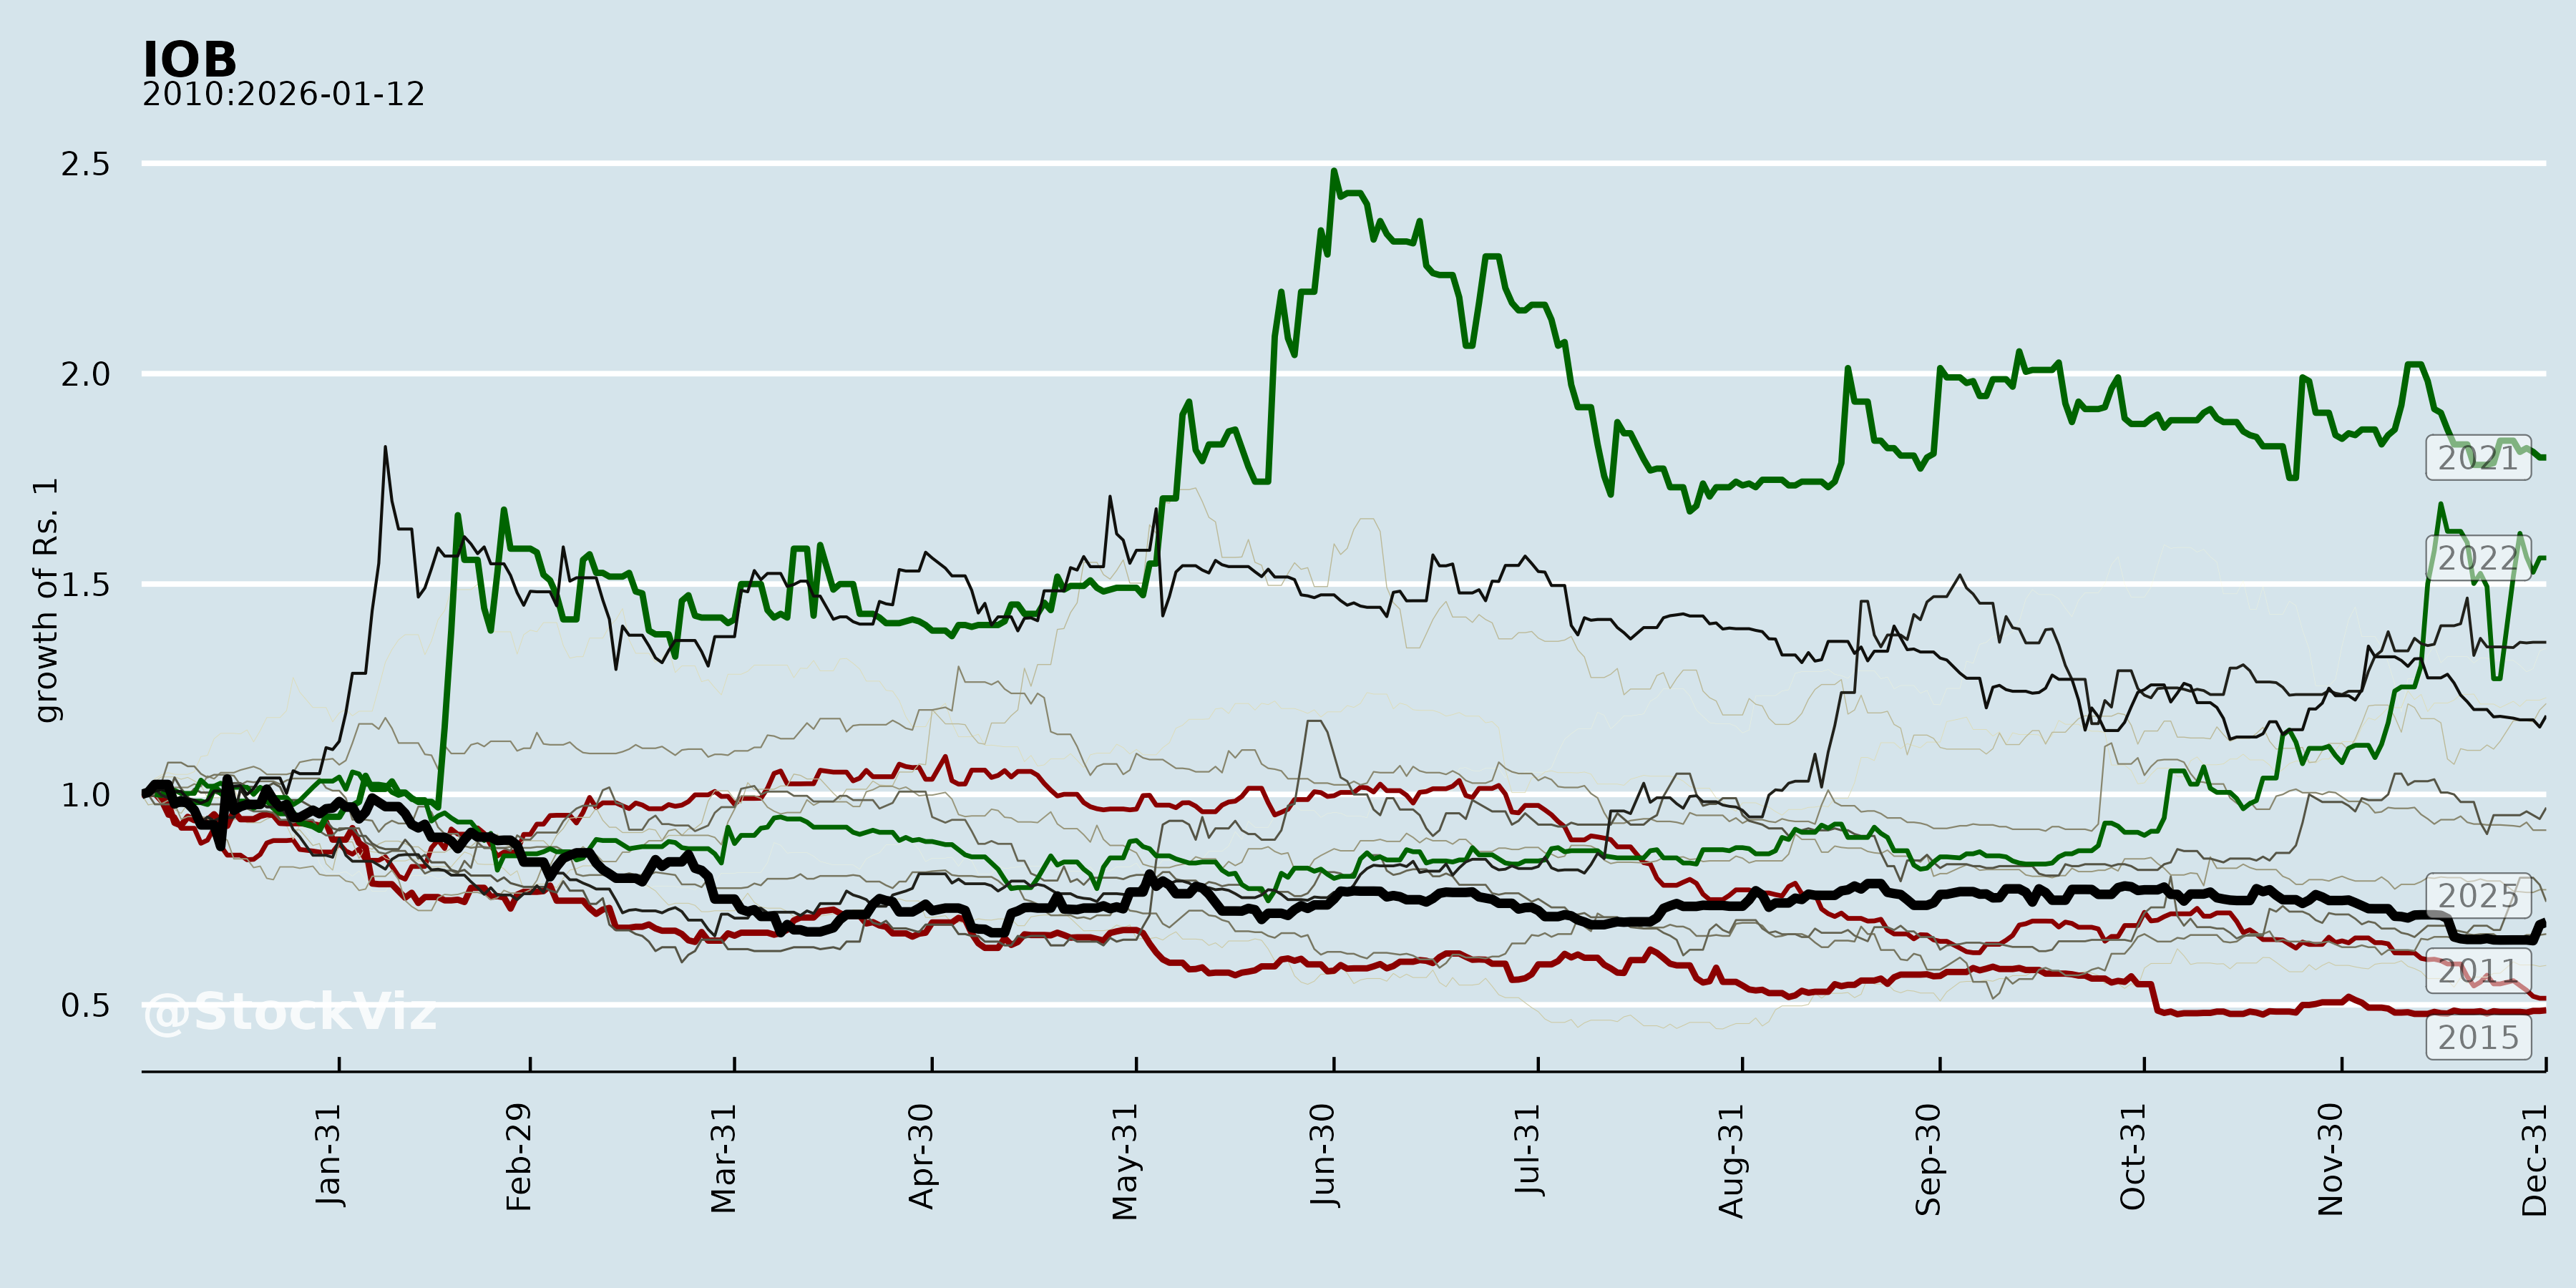
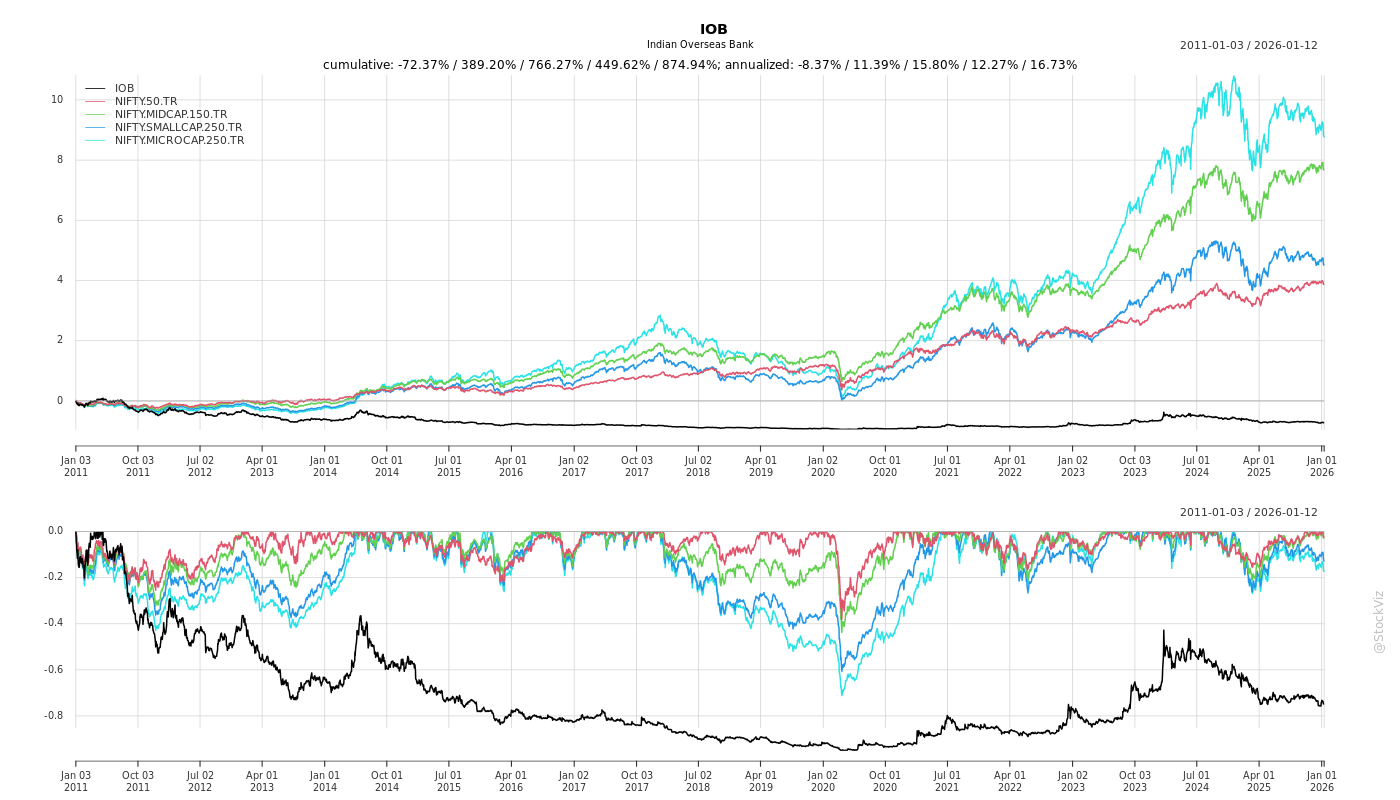
Cumulative Returns and Drawdowns
Fundamentals
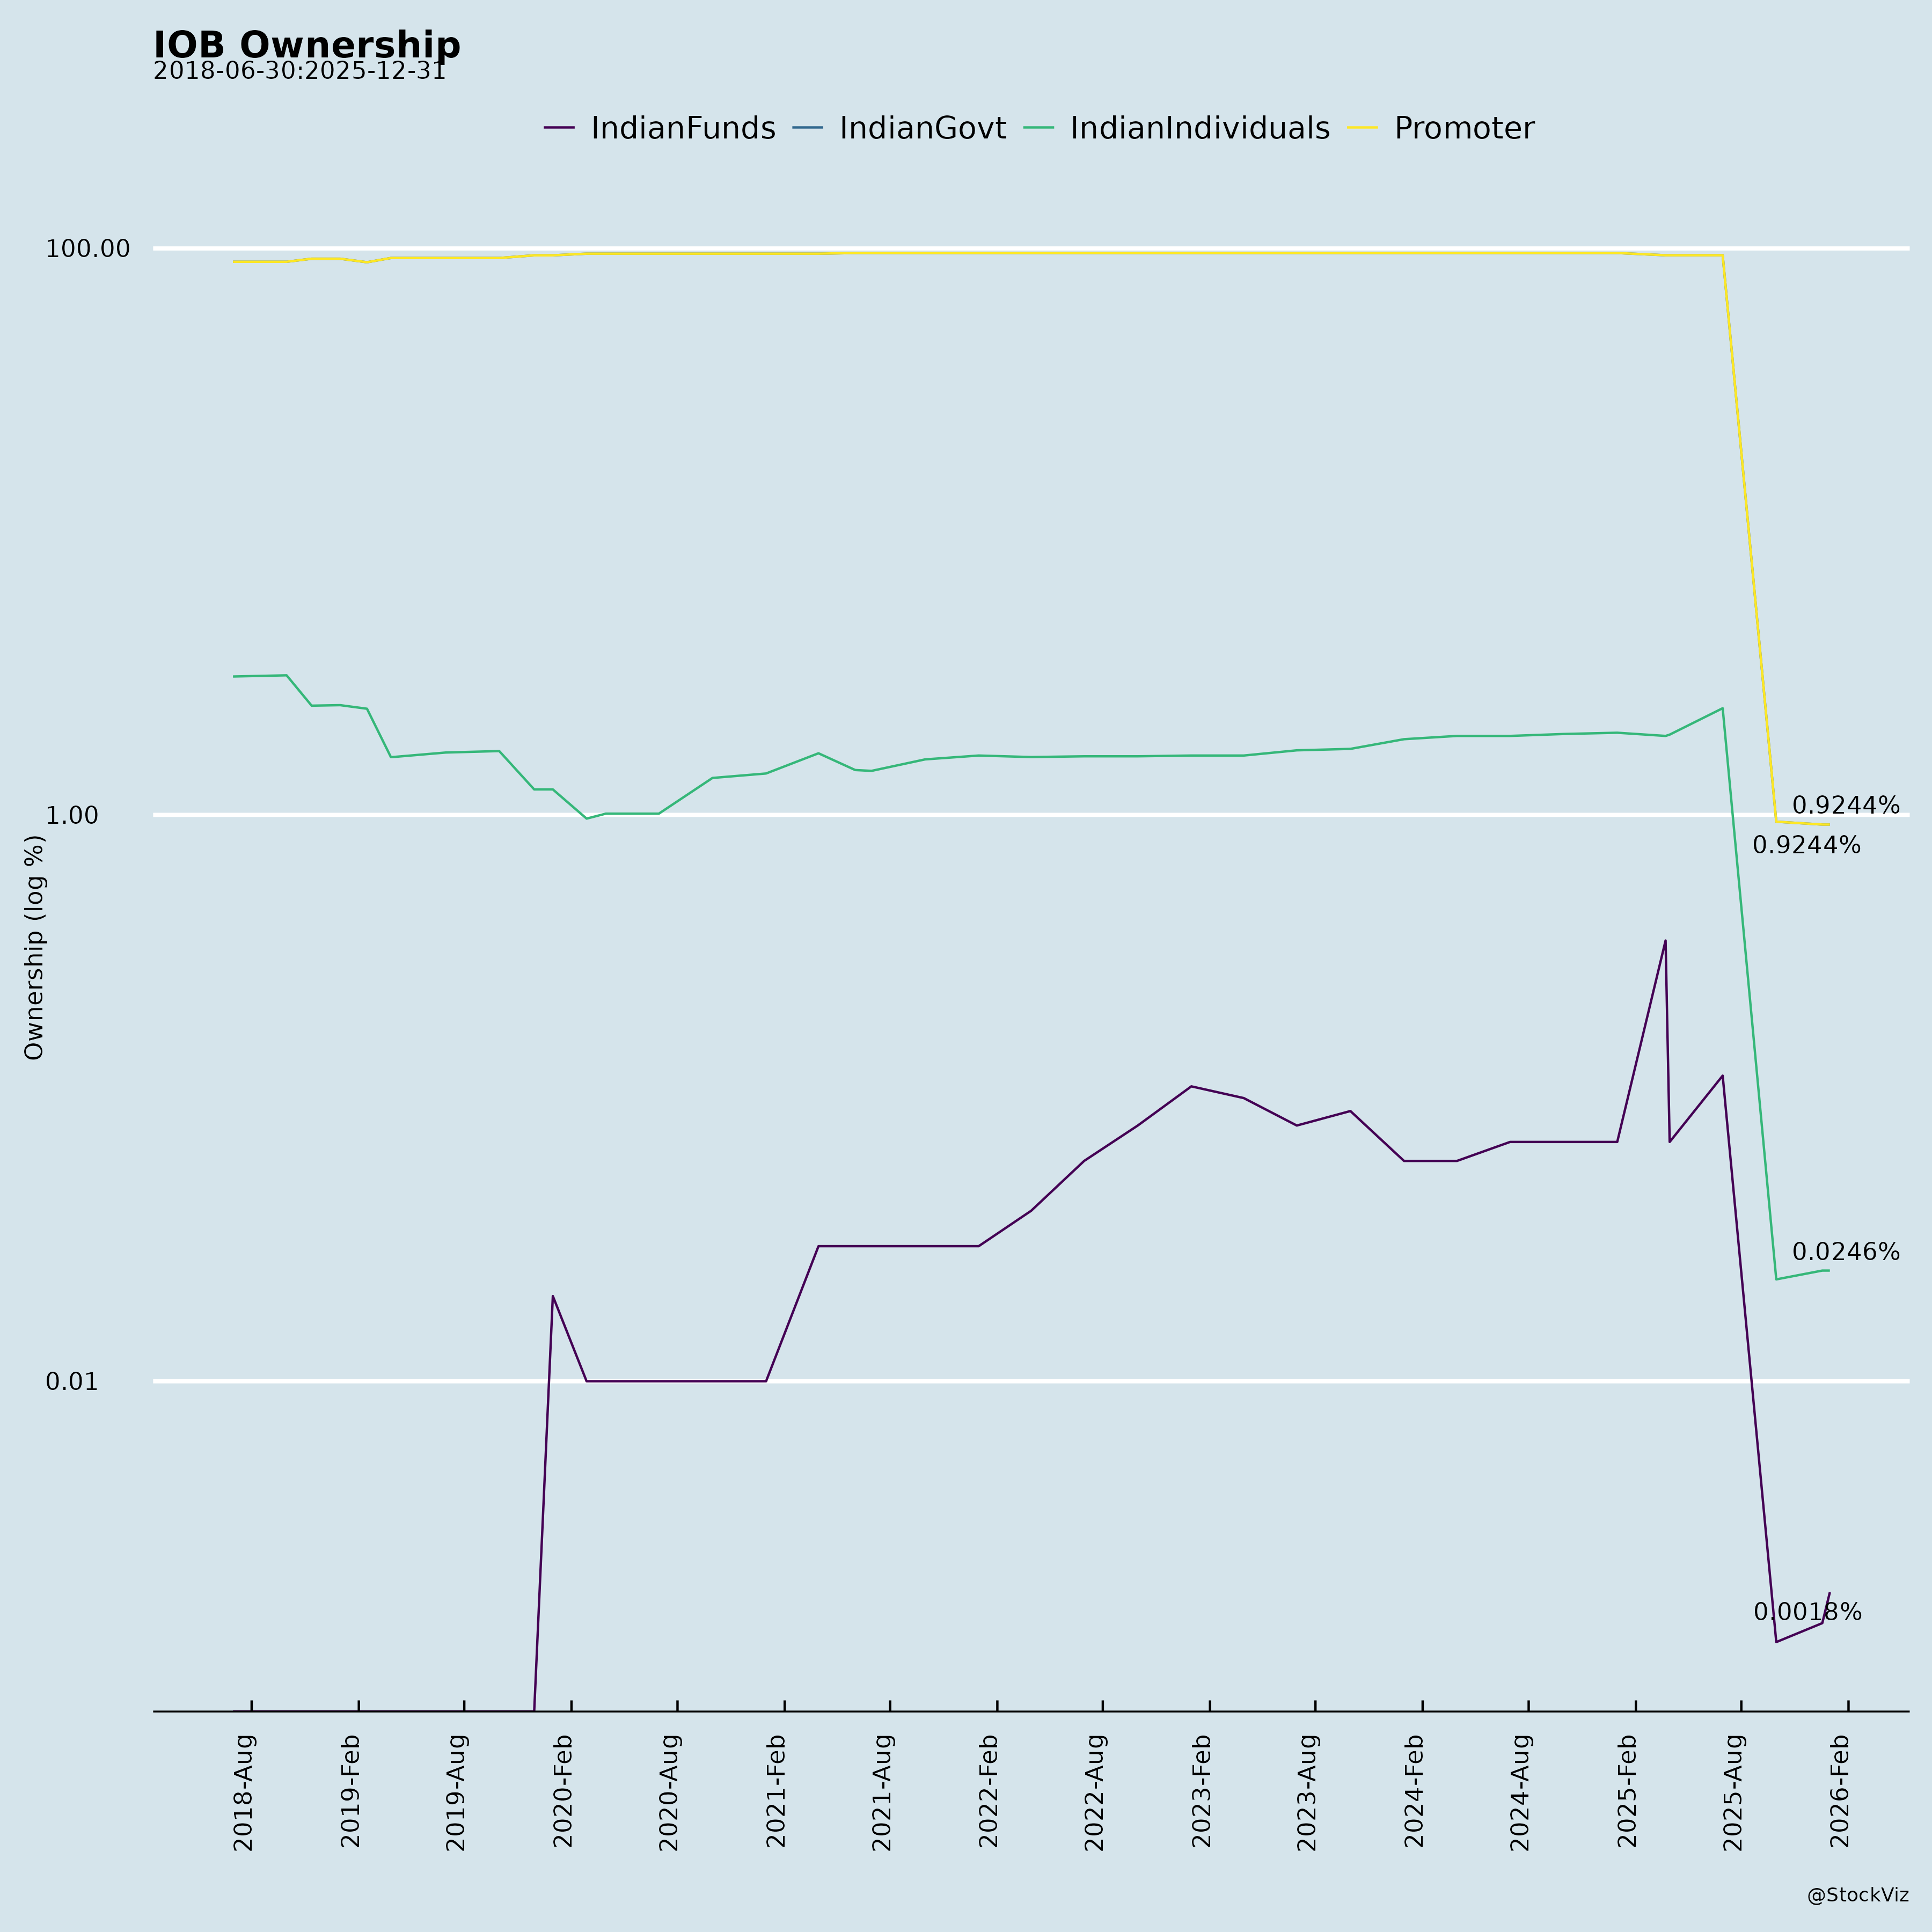
Ownership
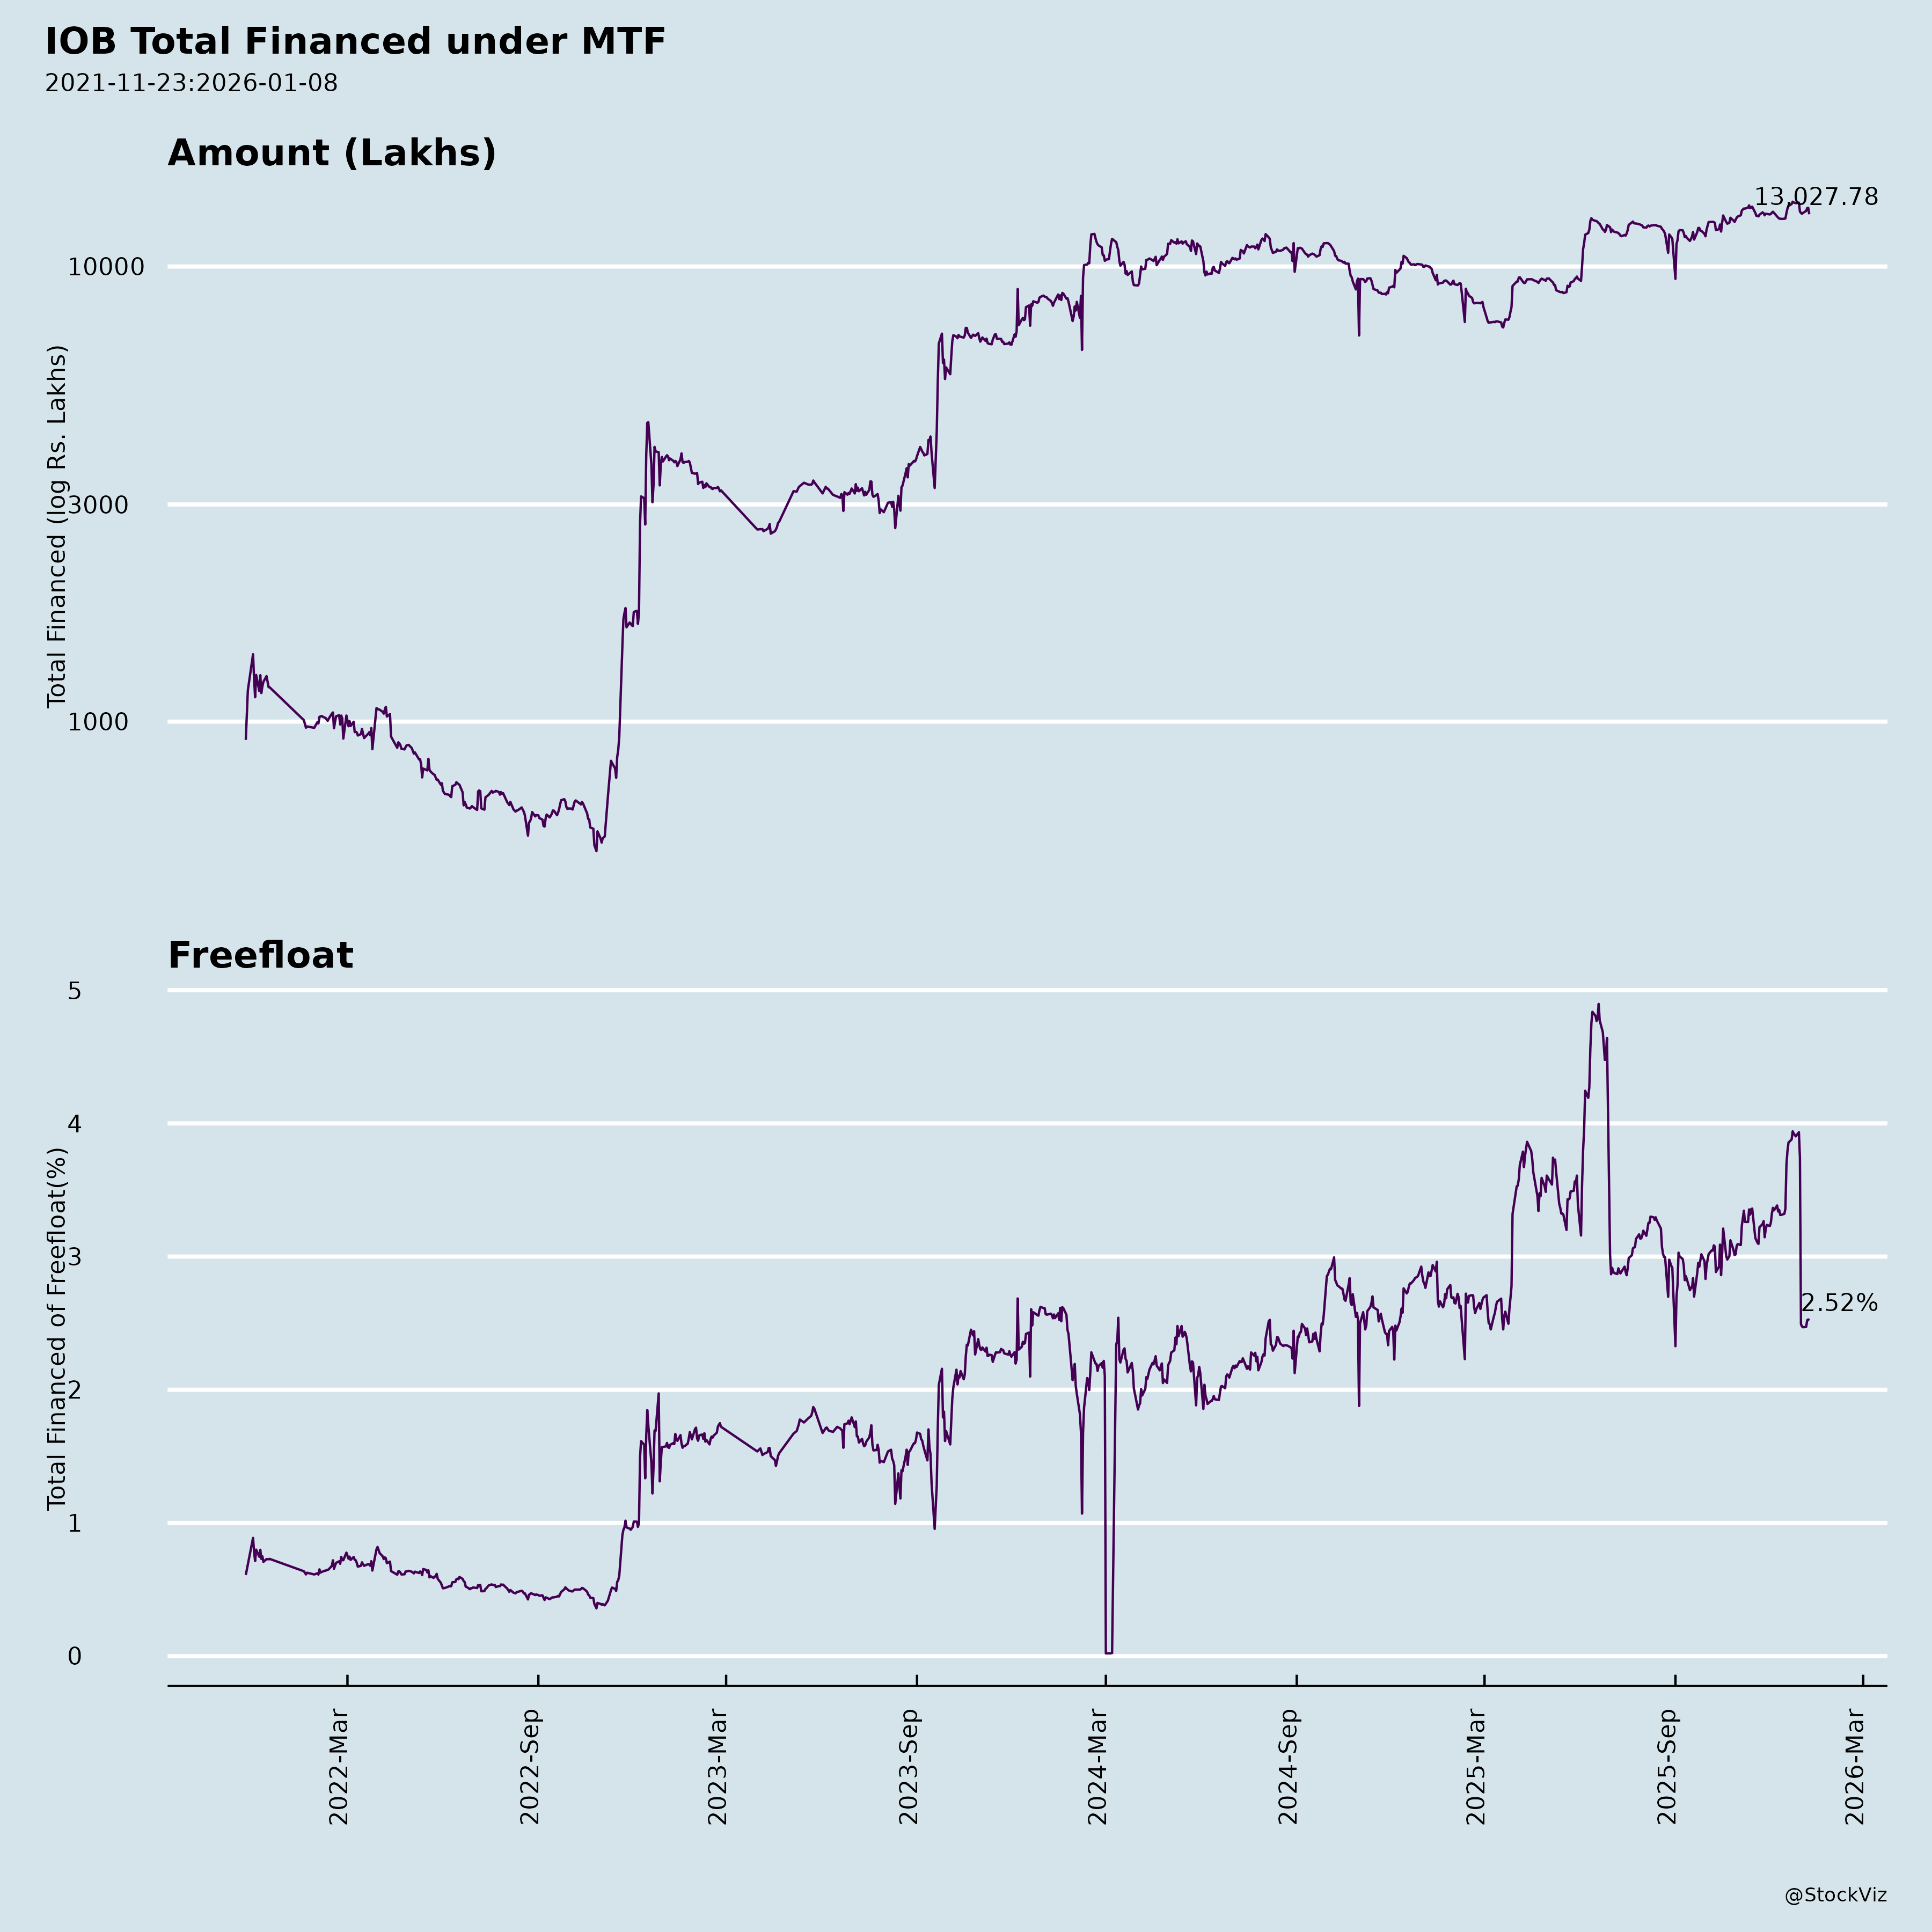
Margined
AI Summary
asof: 2025-12-03
Indian Overseas Bank (IOB) Analysis: Headwinds, Tailwinds, Growth Prospects, and Key Risks
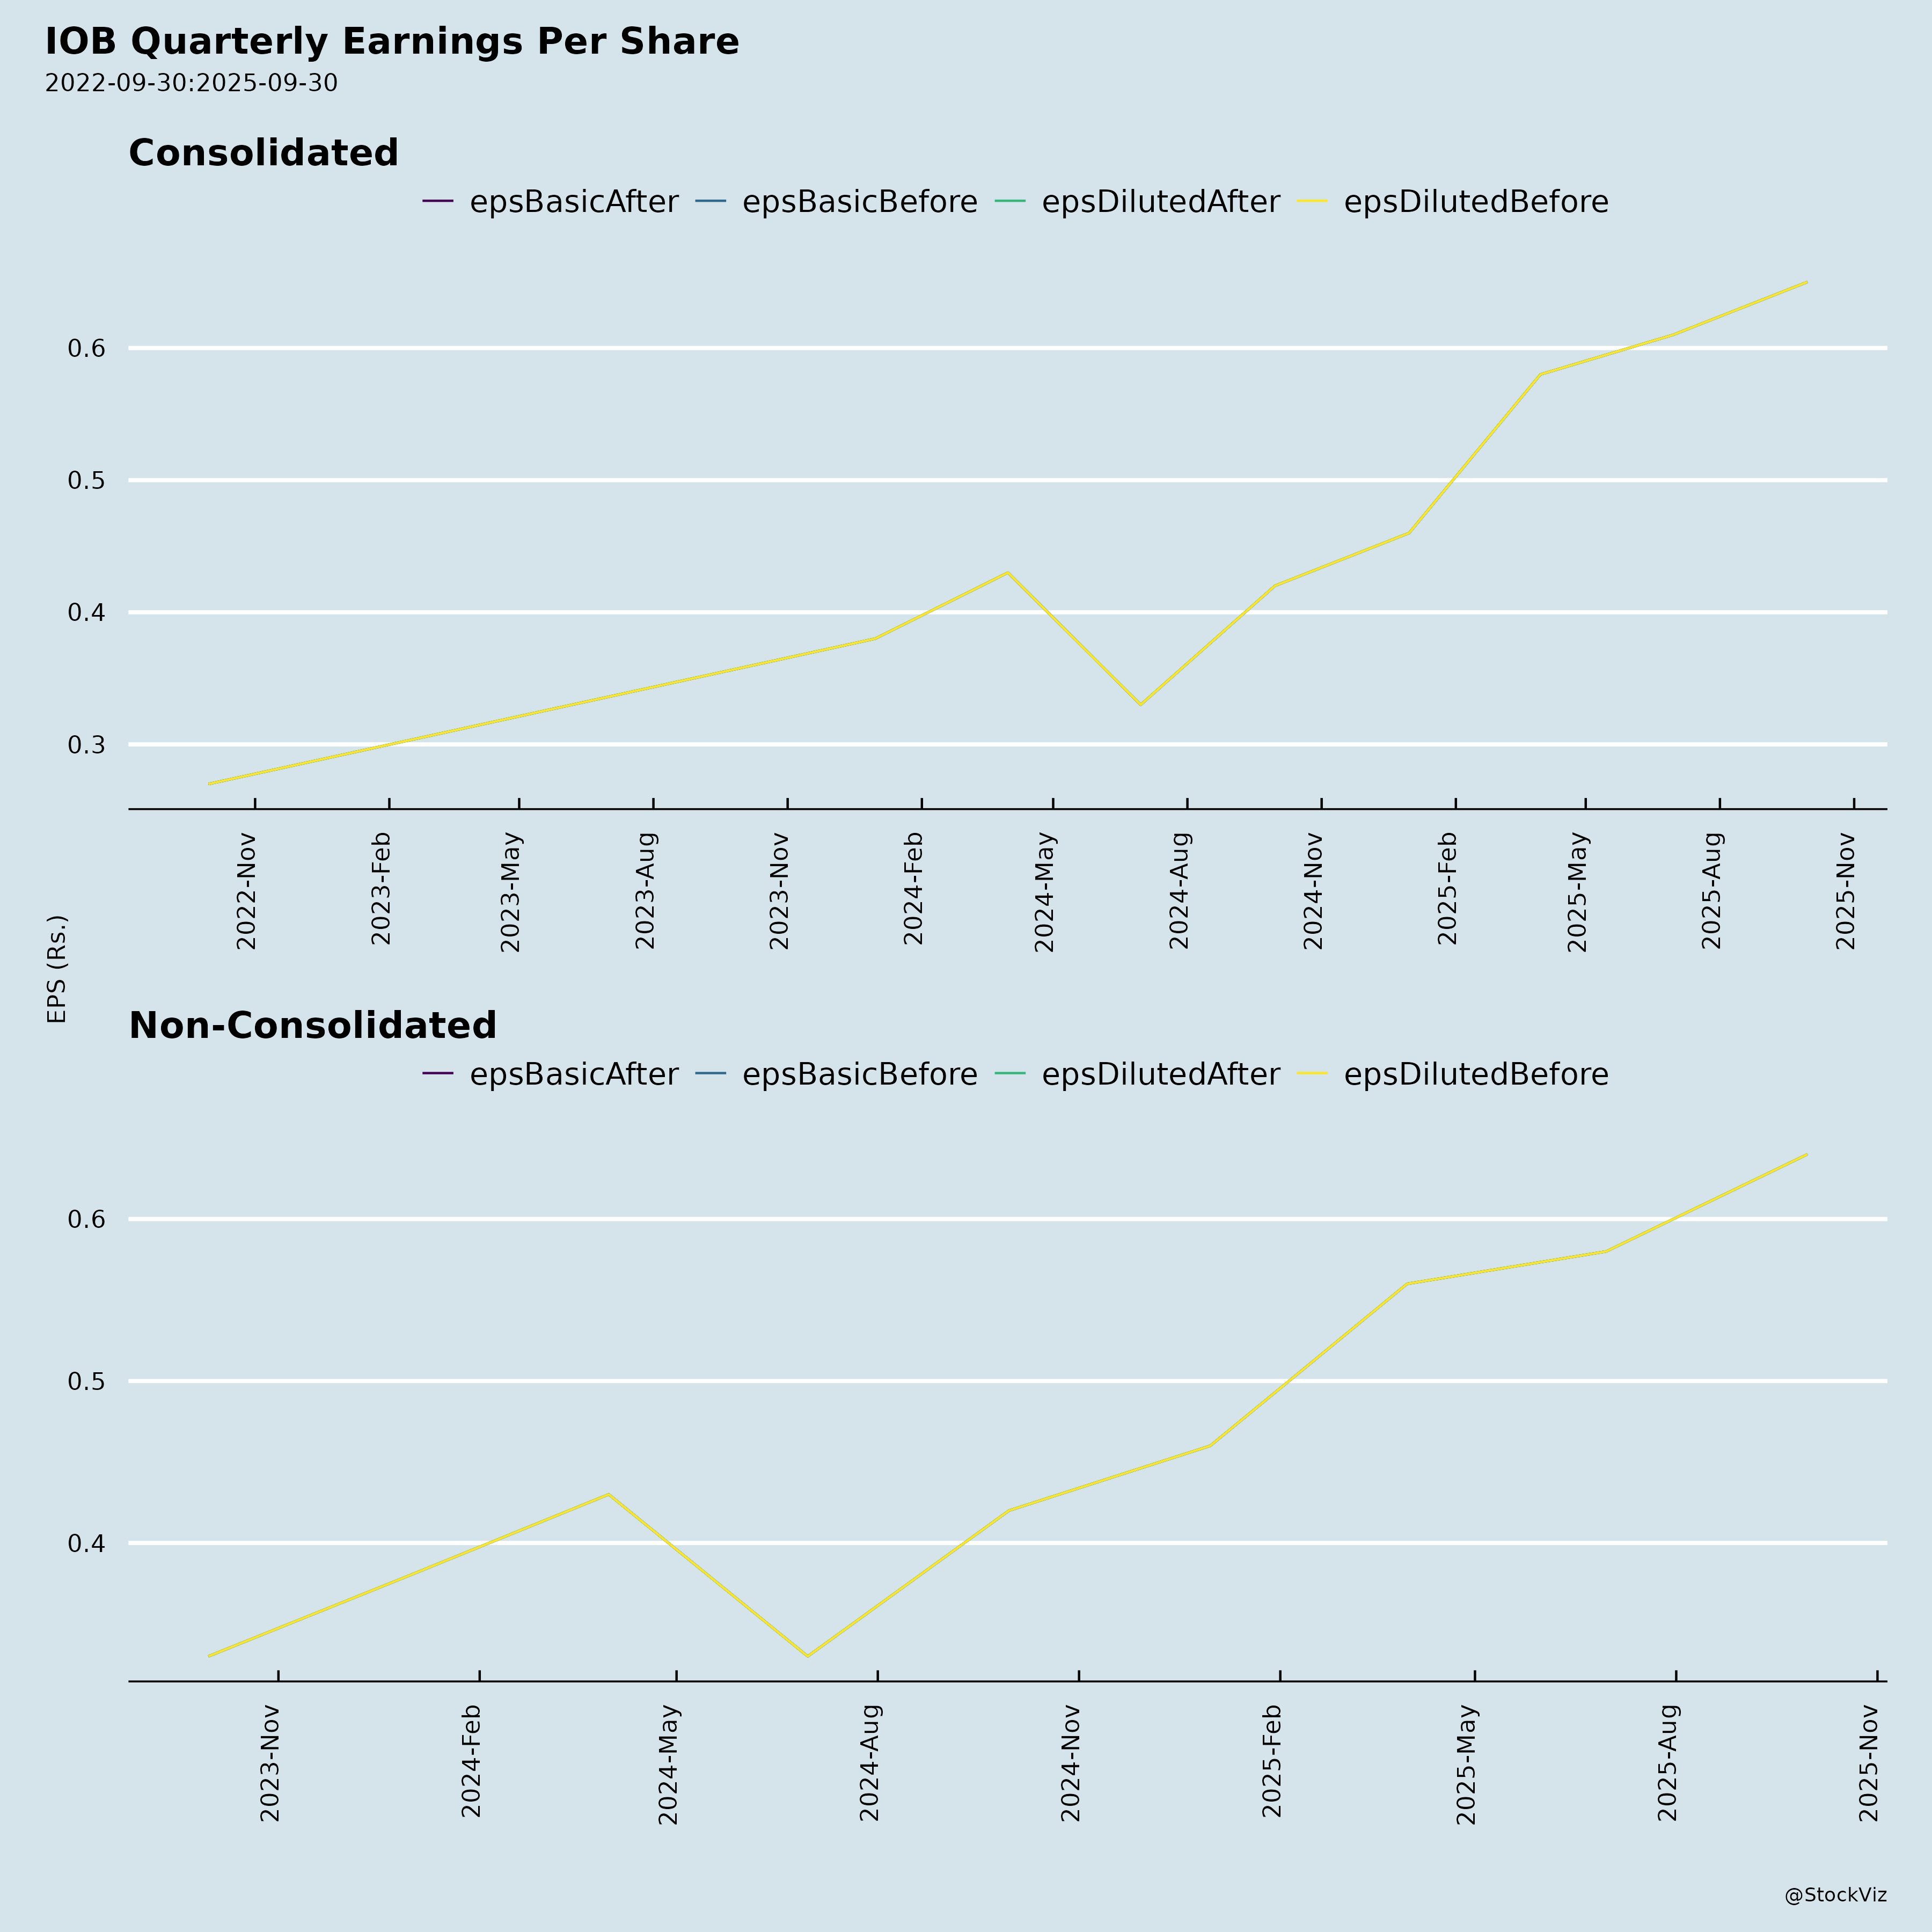
IOB, a public sector bank (PSB) listed on BSE/NSE (Scrip: 532388/IOB), reported robust Q2 FY26 results (ended Sep 30, 2025) with record half-year net profit of ₹1,226 Cr (+57.79% YoY). Total business reached ₹6.17 lakh Cr (+14.1% YoY), driven by advances growth (20.78% YoY). Asset quality improved (GNPA 1.83%, NNPA 0.28%, PCR 97.48%). CRAR at 17.94%. Below is a structured summary based on filings, earnings call, presentation, and disclosures.
Tailwinds (Positive Catalysts)
- Strong Profitability & Efficiency: Half-year NII +20.53% YoY to ₹3,059 Cr; NIM expanded to 3.21% (+13 bps YoY). Cost-to-income ratio fell to 45.76% (-321 bps YoY). ROA 1.20% (+38 bps), ROE 19.95% (+305 bps).
- Asset Quality Turnaround: GNPA down 89 bps YoY to 1.83%; NNPA 0.28%; slippage ratio stable at 0.11%; recovery ₹874 Cr (incl. ₹461 Cr from write-offs). Credit cost low at 0.18%.
- Capital Strength: CRAR 17.94% (CET1 15.53%); supports 2+ years of growth. QIP plans for ₹4,000 Cr (Board-approved).
- Digital & Operational Momentum: 98% transactions digital; awards for tech (IBA Banking Tech Awards, GRAI #1). 3,373 branches (+104 YoY); customer base +21 lakh in H1FY26.
- PSB Support: Govt stake ~94.6%; merger rumors denied; focus on govt business/non-interest income.
Headwinds (Challenges)
- Deposit Mobilization Lag: Deposits +9.15% YoY (vs. advances +20.78%); CASA ratio dipped to 40.52% QoQ (-326 bps). CD ratio rose to 81.98% (+789 bps YoY), straining liquidity.
- Regulatory Fines/Compliance: RBI penalty ₹31.8 lakh for PSL charge violations (no financial impact, but signals oversight needs).
- Provision Pressures: ECL draft guidelines may require ₹2,700-2,800 Cr extra provisions (phased; buffer building). Deferred tax asset ₹29,636 Cr (under review).
- Margin Squeeze Risk: NIM stable but sensitive to rate cuts; old tax regime continues (new regime shift Q3/Q4).
- Slow CASA Growth: +4.19% YoY but absolute pressure from competition.
Growth Prospects (High Potential)
- Credit Expansion: Organic growth across retail (19% CAGR), agri/MSME (healthy); corporate pipeline ₹15,000 Cr. FY26 guidance: Credit 17-18% (min. 12%), deposits 12-13%.
- Non-Interest Income: Fintech tie-ups, credit cards, govt business, PSLC sales; H1FY26 non-interest income ₹1,365 Cr (+YoY).
- Network & Digital Scale: +240 branches in pipeline (6-9 months); 11,467 BCs; UPI/mobile users surging (CAGR 20-30%). ESG/green loans ramp-up.
- Profitability Trajectory: FY26 profit target exceeded in H1; ROE >19%; potential tax regime shift boosts PAT.
- Strategic: GIFT City branch soon; QIP for dilution (Govt stake to 75%); IIB Malaysia wind-up (₹200 Cr recovery expected).
Projected FY26 (Mgmt Guidance/Implied): Credit ~₹3.3-3.4 lakh Cr; NIM ~3.2%; Profit >₹5,000 Cr (conservative).
Key Risks (Moderate-Moderate High)
| Risk Category | Description | Mitigation |
|---|---|---|
| Asset Quality | Slippages (0.11%); ECL norms; agri/MSME exposure (~48% portfolio). SMA <6%. | Robust monitoring; PCR 97.48%; recovery focus. |
| Liquidity/Interest Rate | Deposit lag; high CD ratio; potential rate cuts. | CRAR buffer; QIP; govt business. |
| Regulatory/Compliance | RBI penalties; ECL provisions; tax regime shift. | Compliance officer oversight; buffers created. |
| Macro/Economic | Slowdown, US tariffs on MSME exports; ECL impact. | Diversified portfolio (retail/agri/MSME 60%+). |
| Operational | Branch migration (Utkal Grameen); cyber/digital risks. | Digital overhaul; IT spend ₹1,700 Cr. |
| Execution | Capital raise timing; merger speculation (denied). | Strong mgmt track record (8-10 quarters consistency). |
Overall Outlook: Positive. Tailwinds dominate with consistent execution (profit growth 58% YoY, NPA cleanup). Growth prospects strong (17-20% credit); risks manageable (high CRAR/PCR). PSB status provides stability. Target upside on NIM stability/asset quality. Watch ECL finalization/deposit mobilization. Valuation attractive vs. PSB peers.
Copyright © 2023 SAS Data Analytics Pvt. Ltd. All rights reserved.