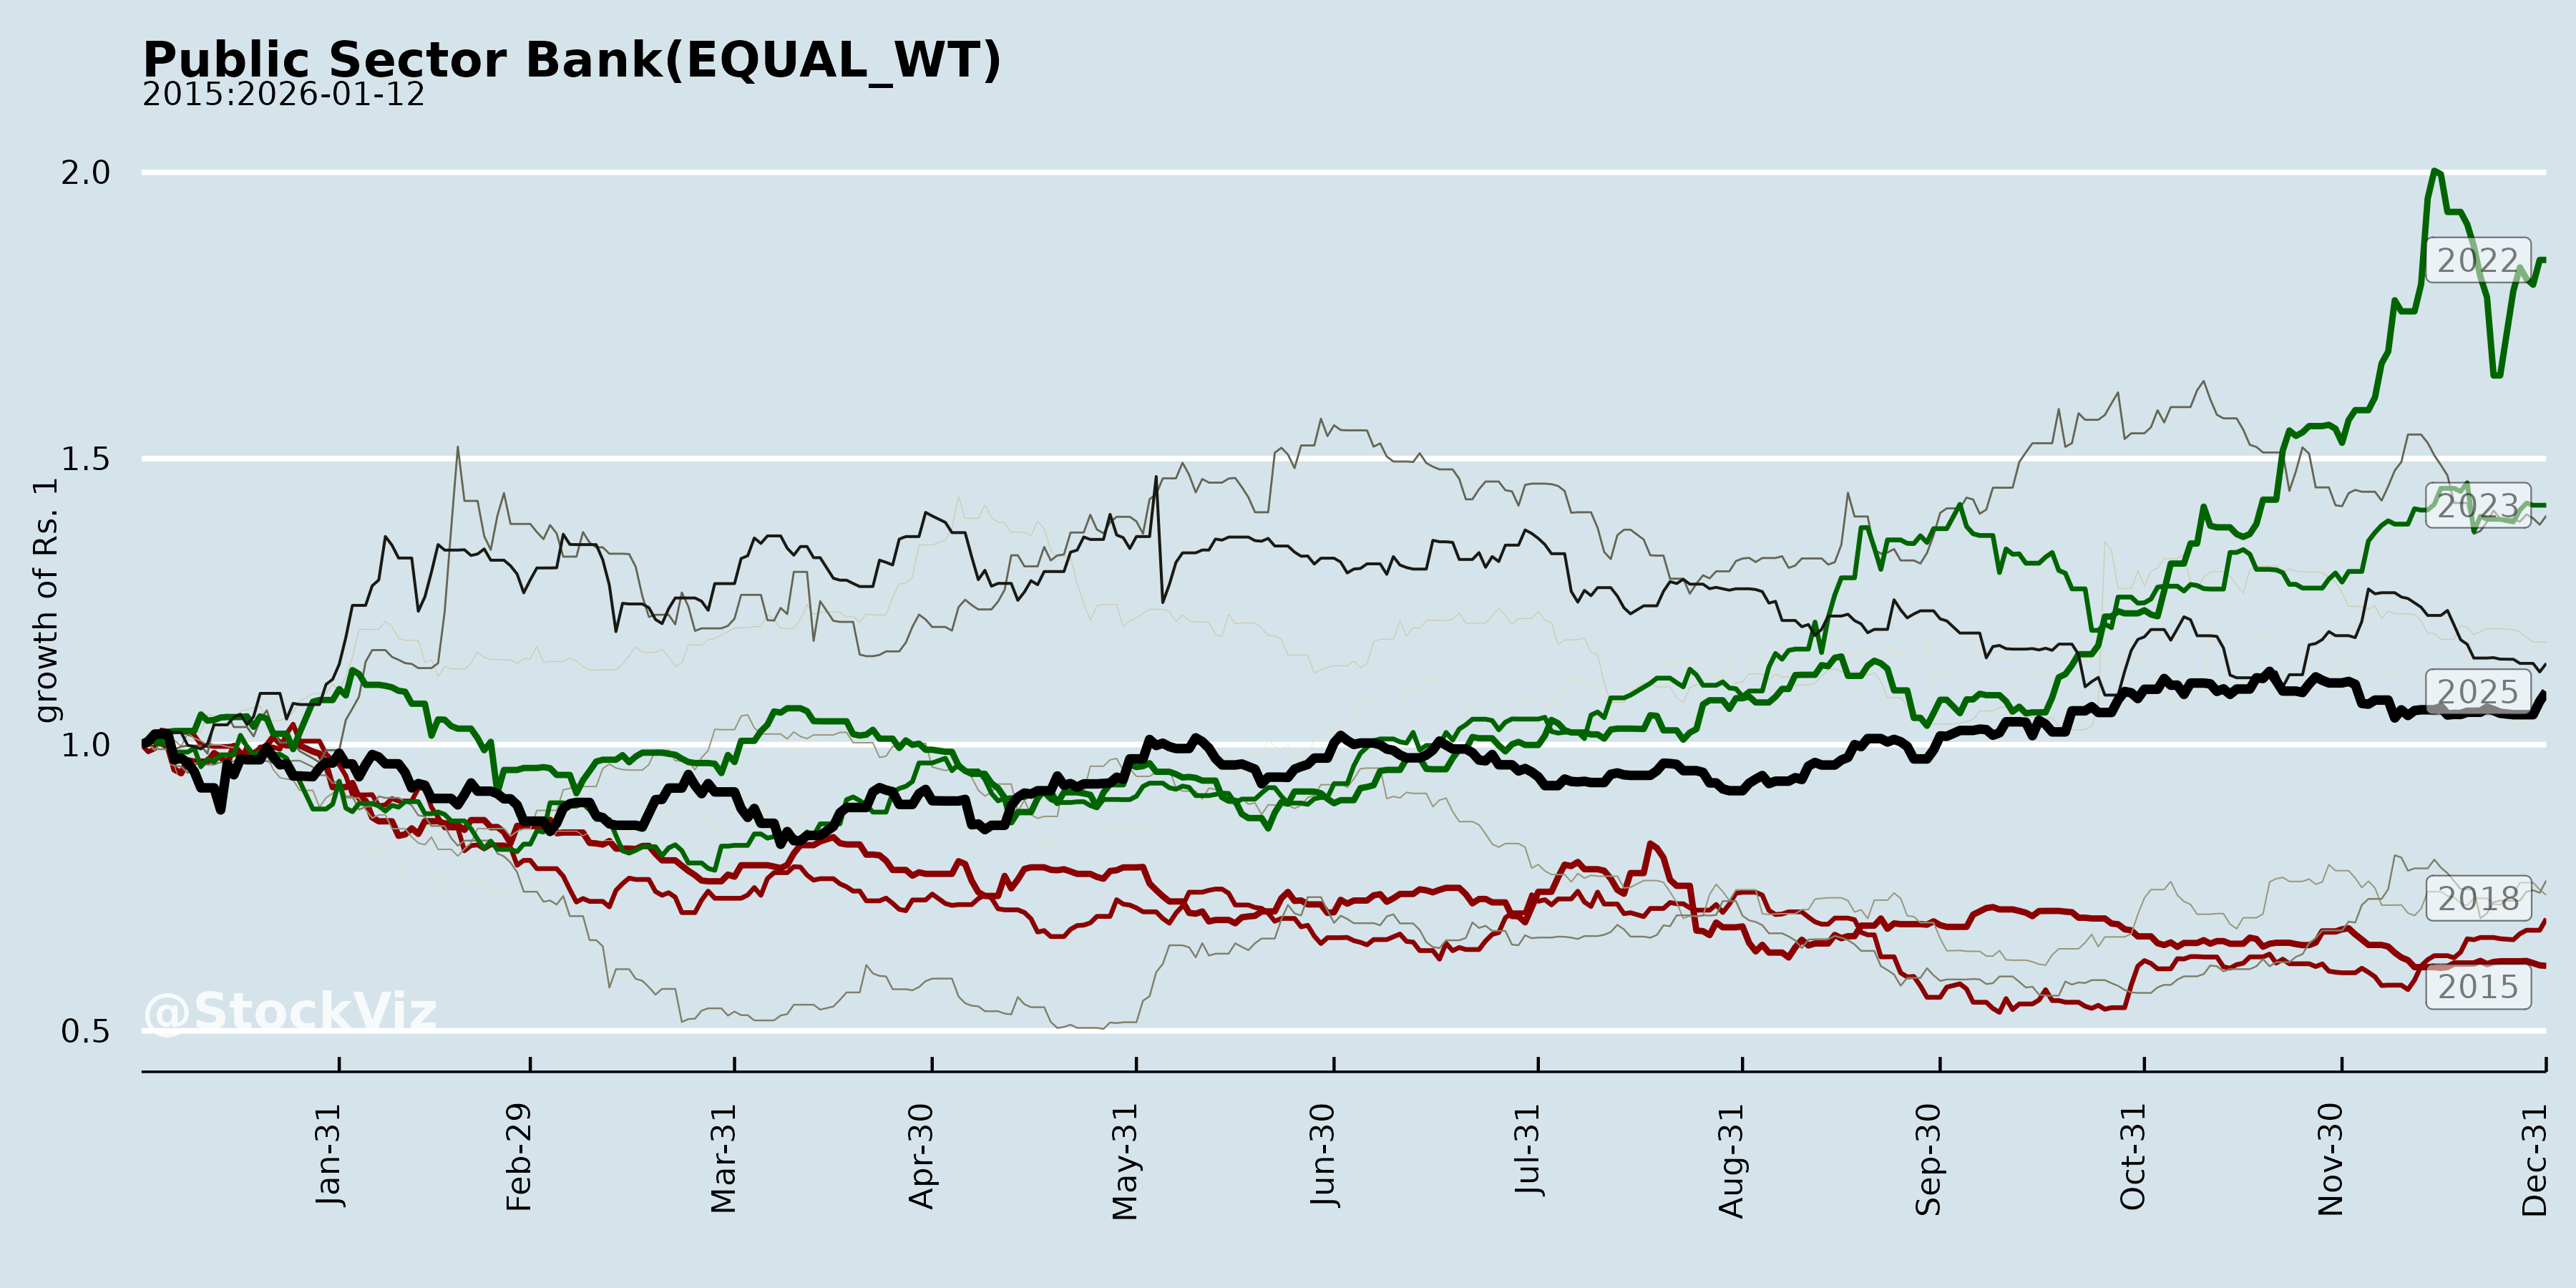
Public Sector Bank
Industry Metrics
January 13, 2026
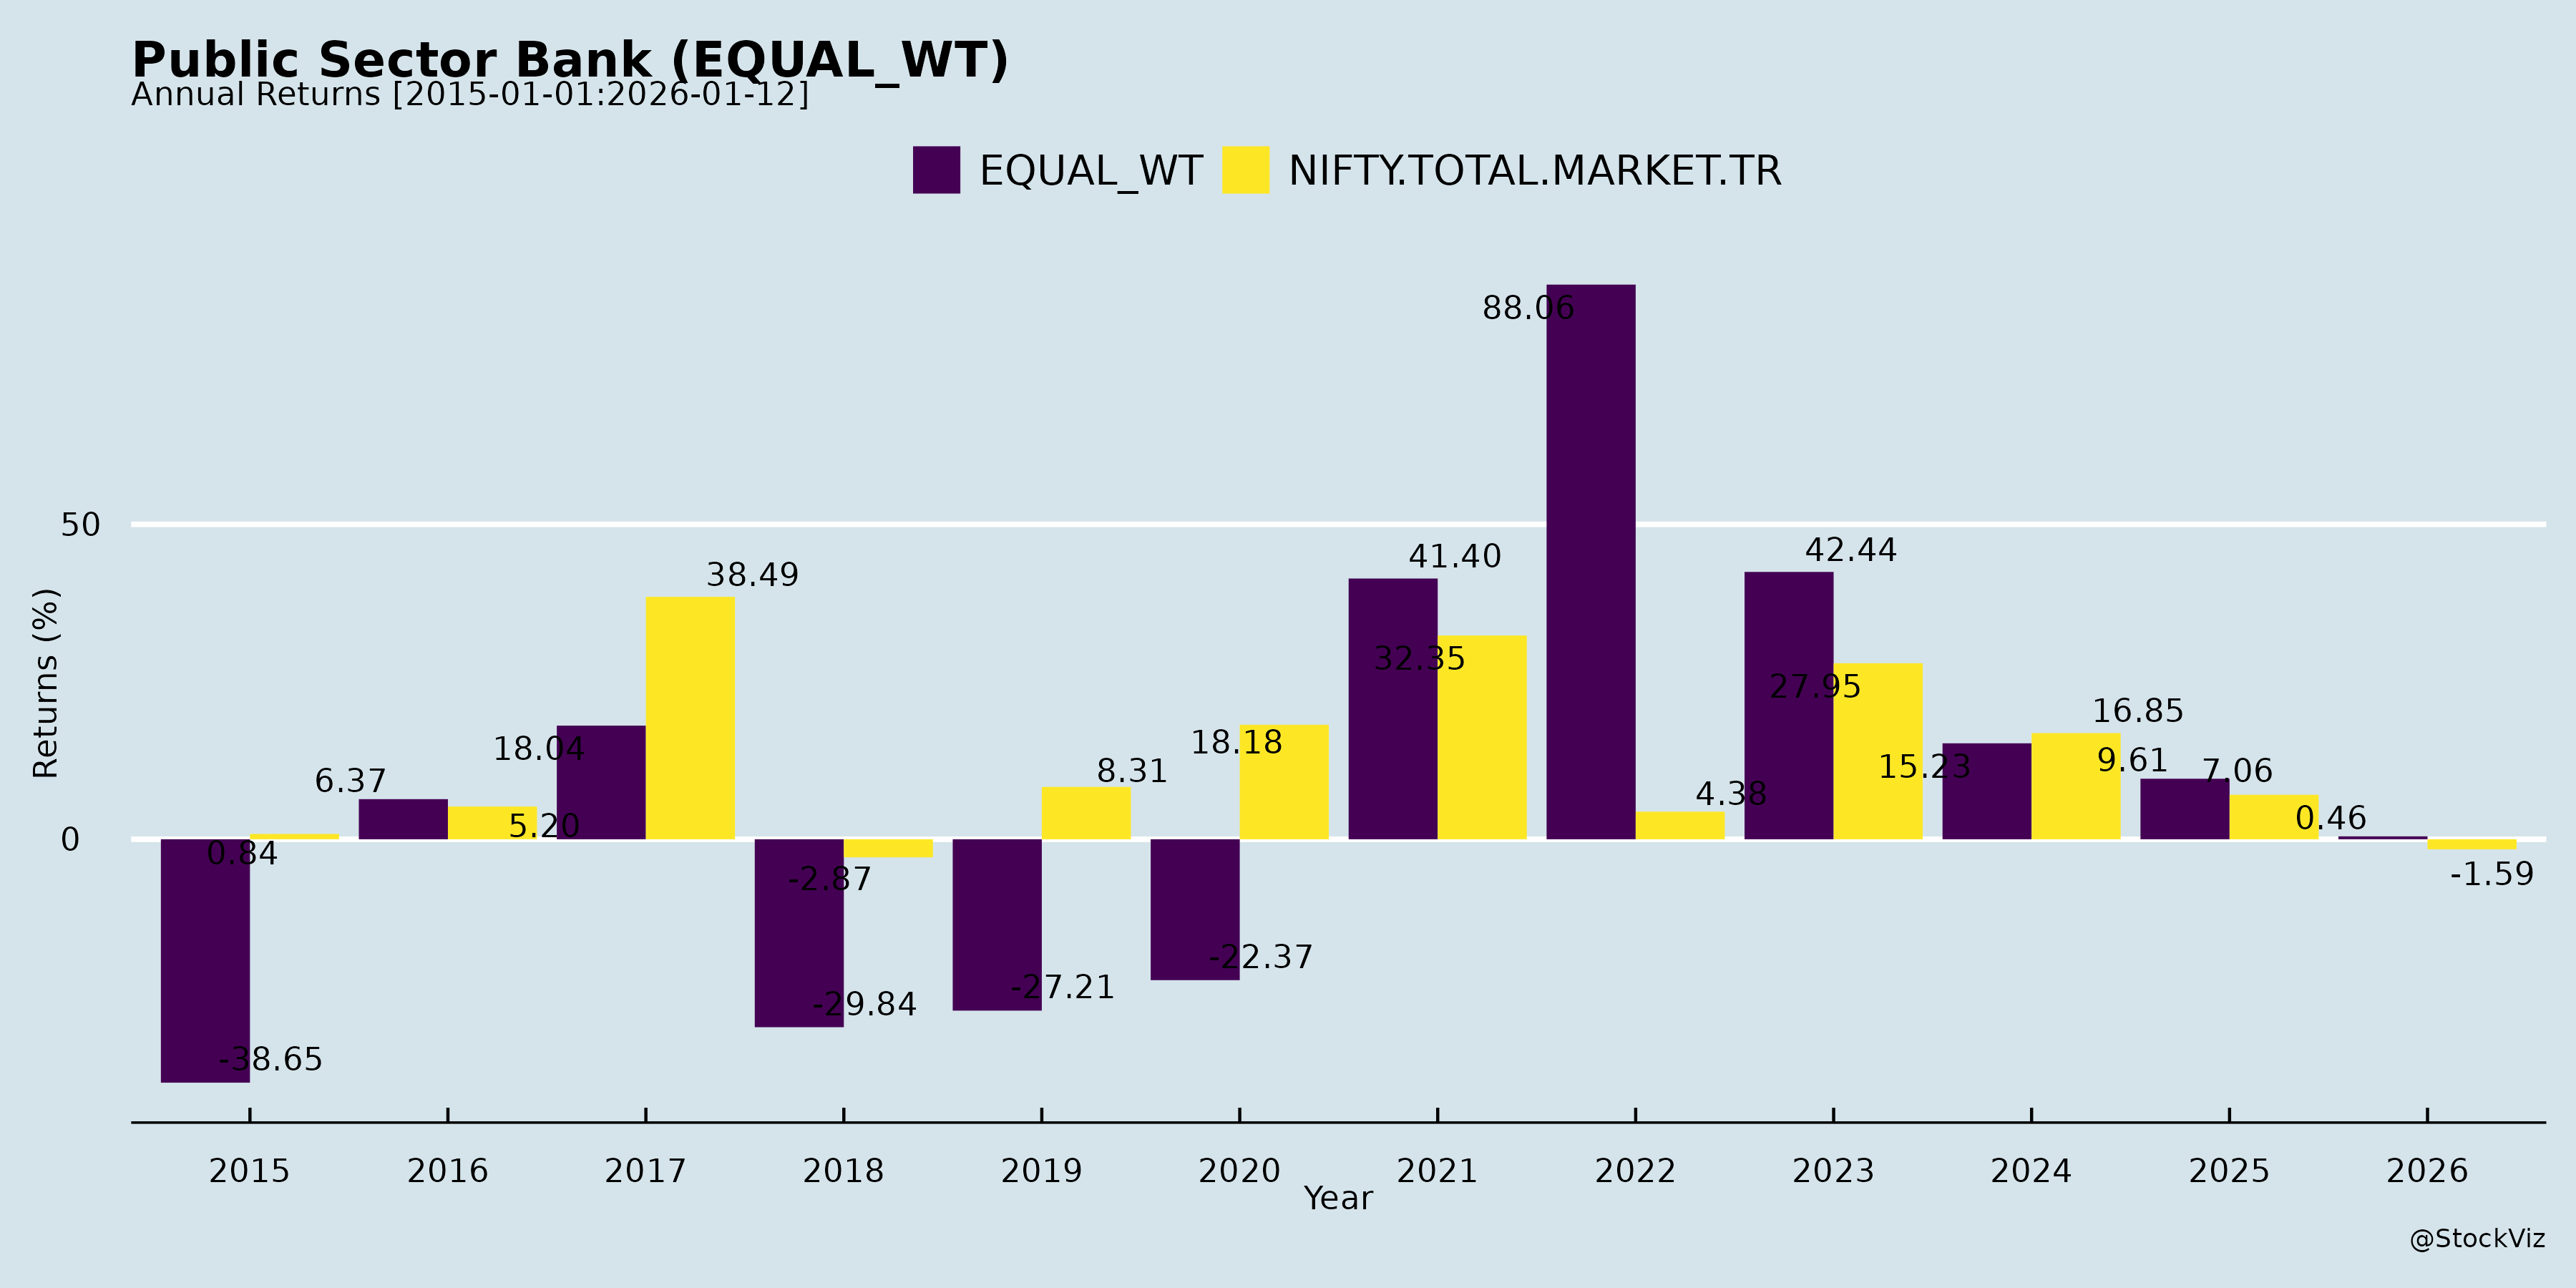
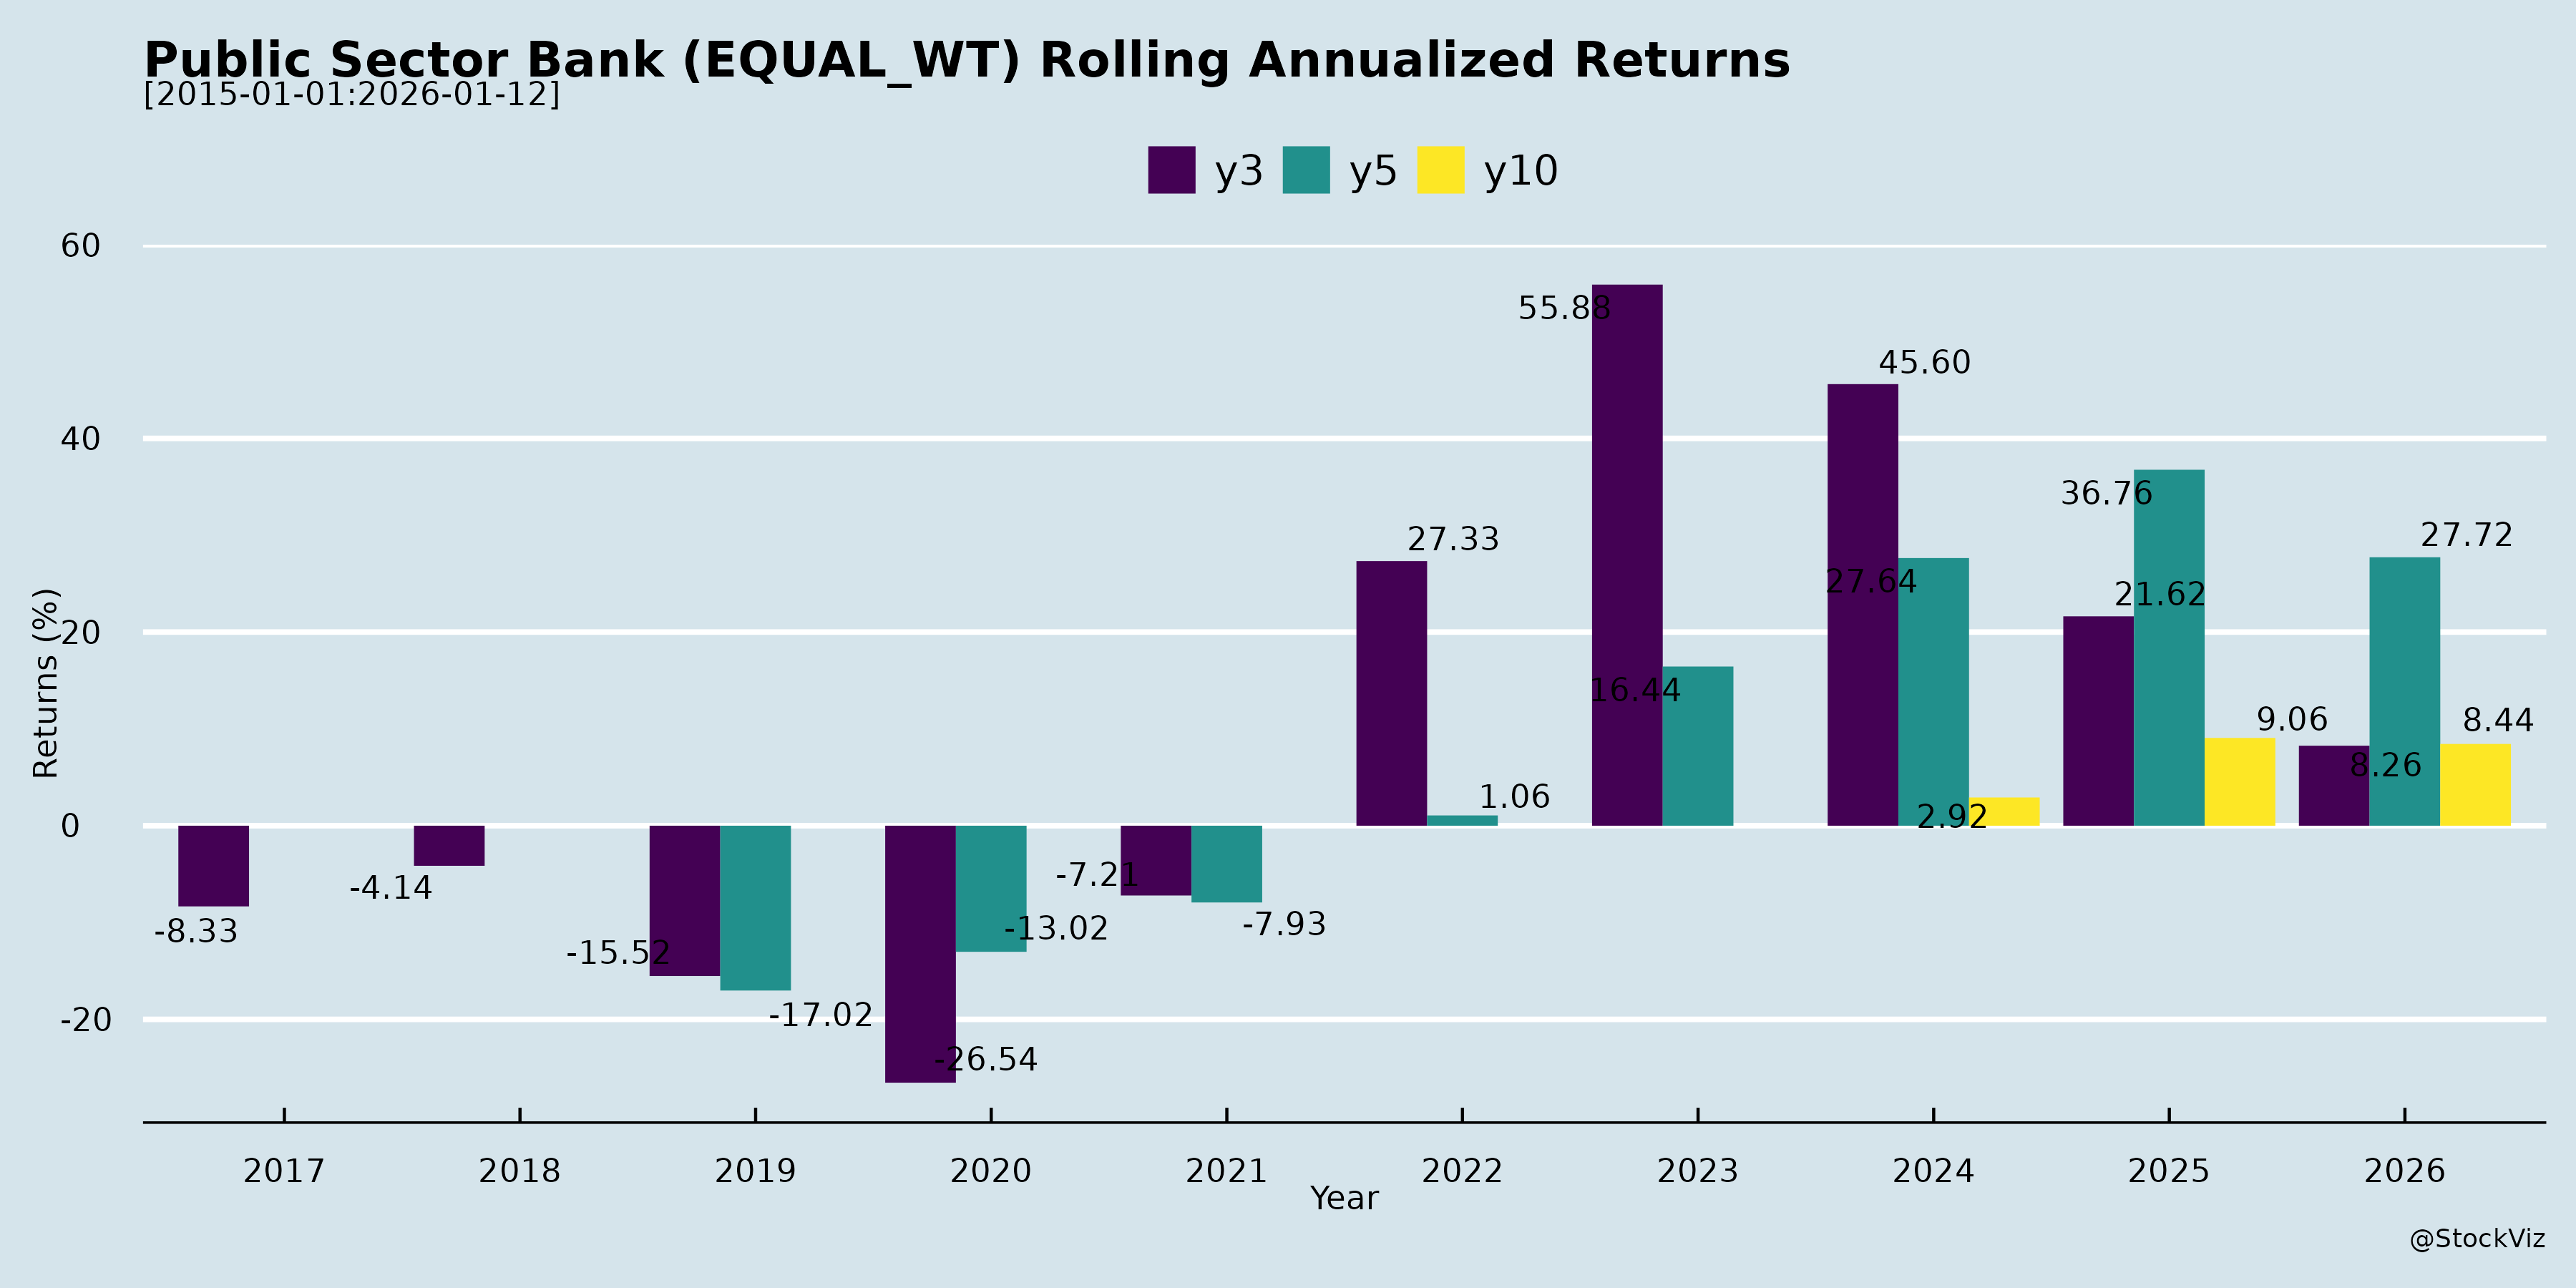
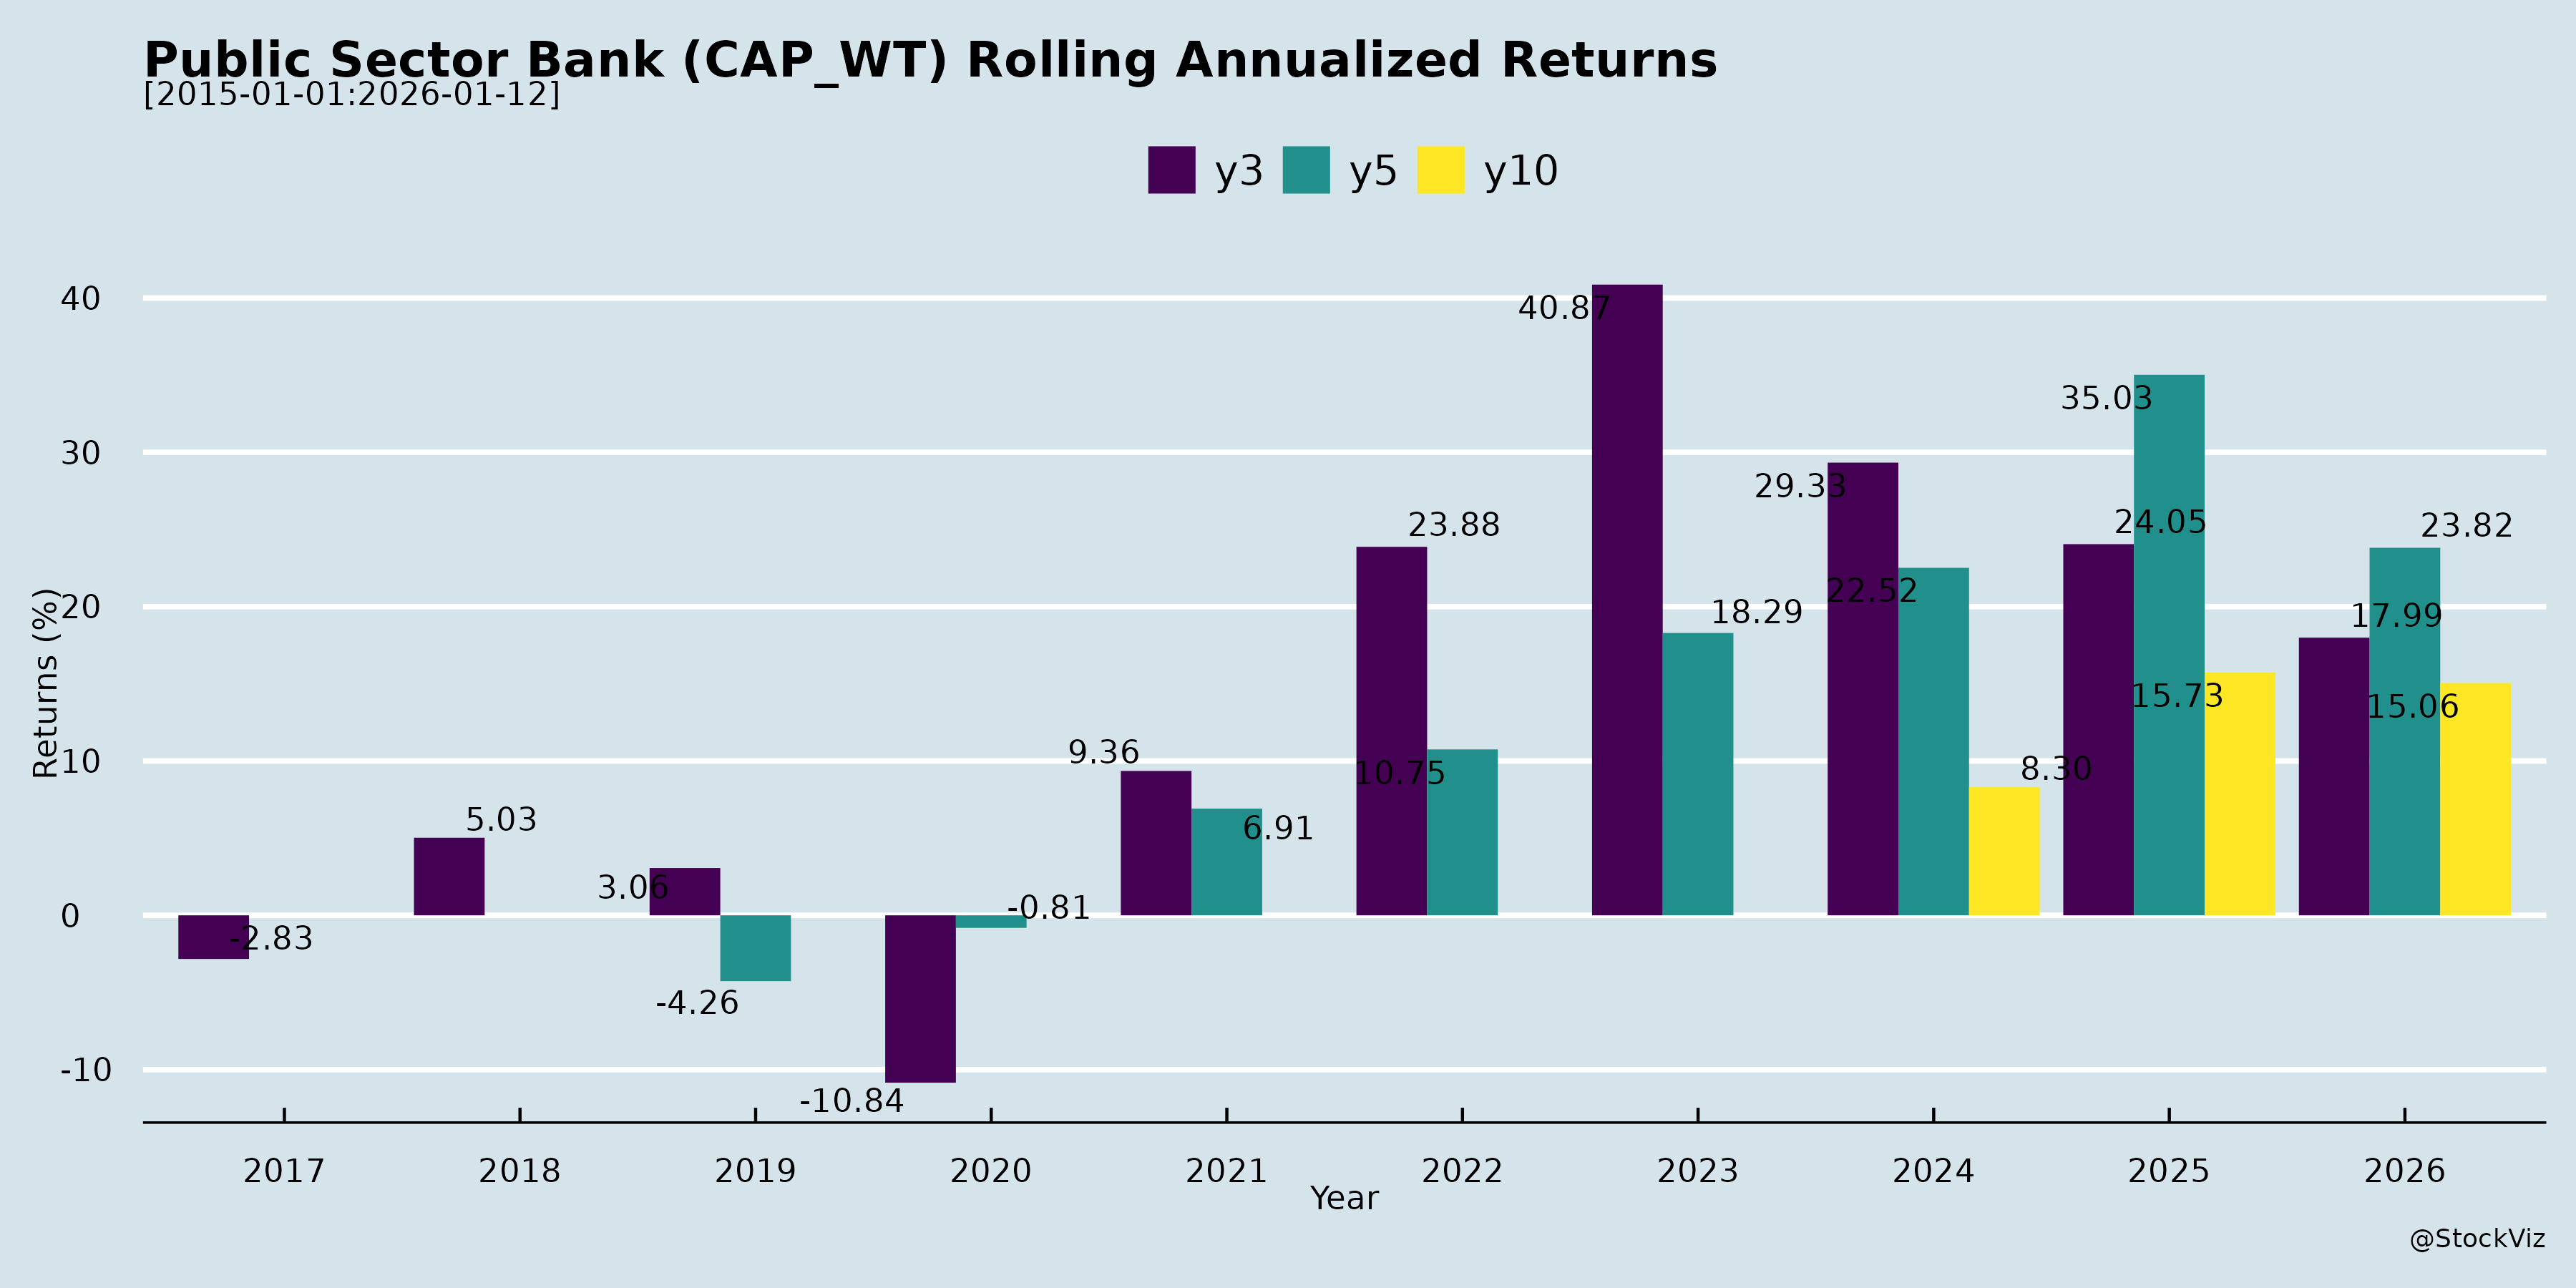
Annual Returns


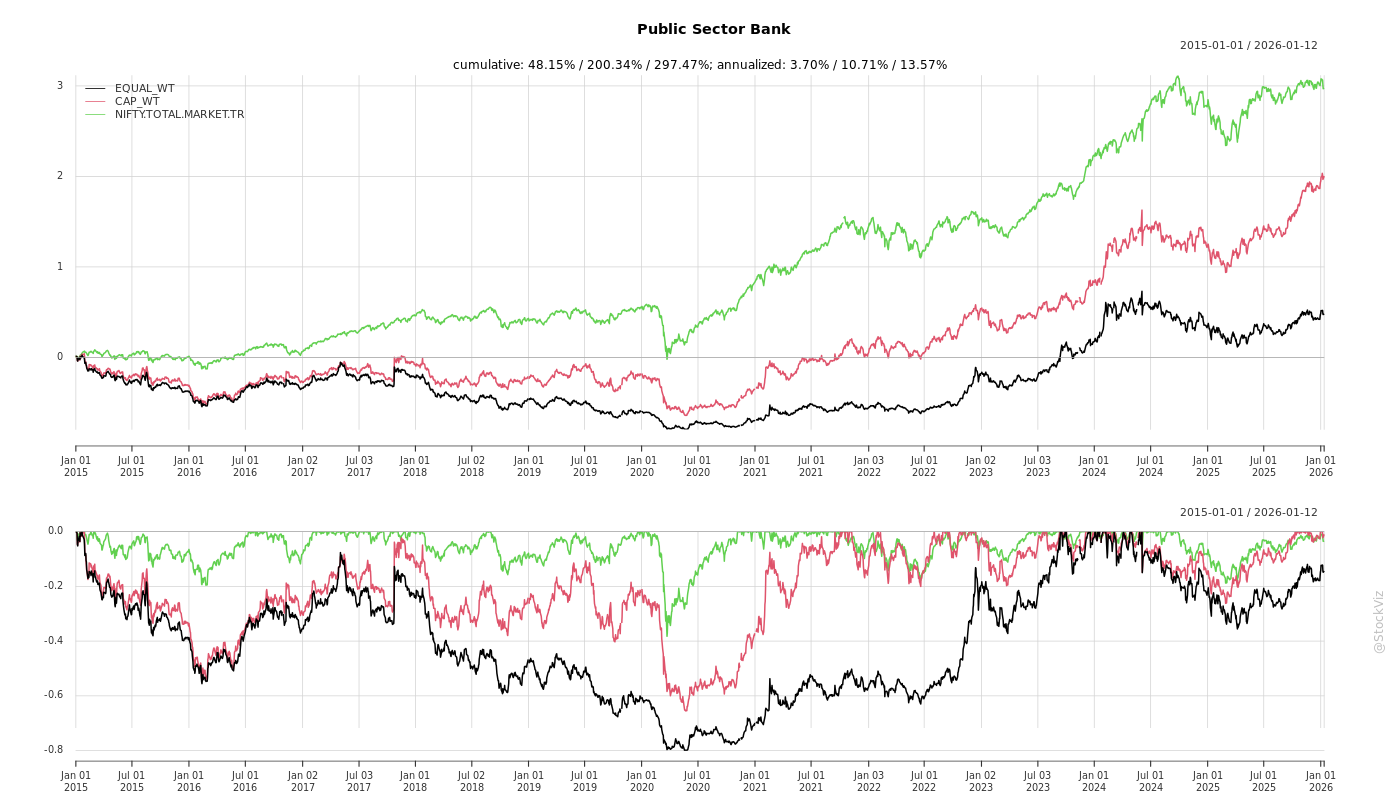
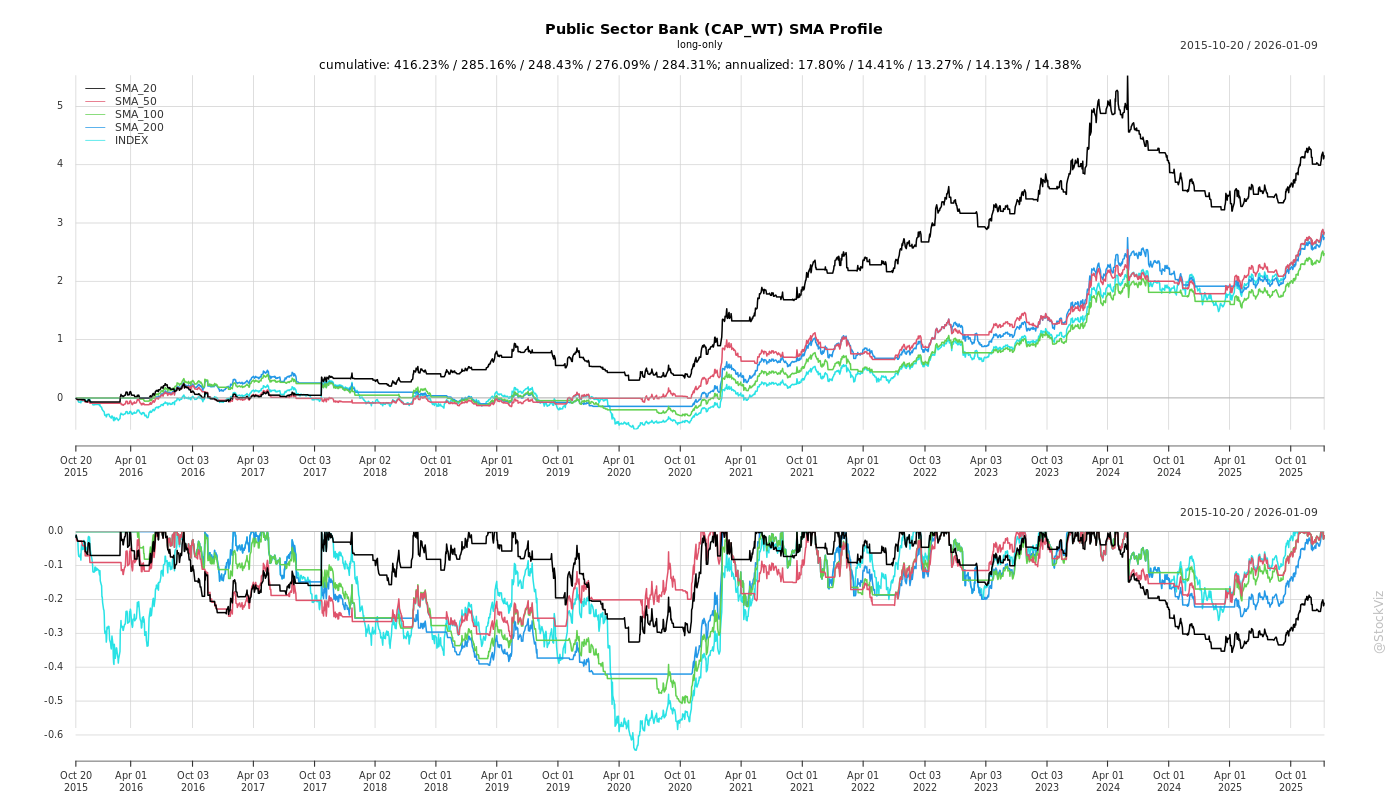
Cumulative Returns and Drawdowns
SMA Scenarios
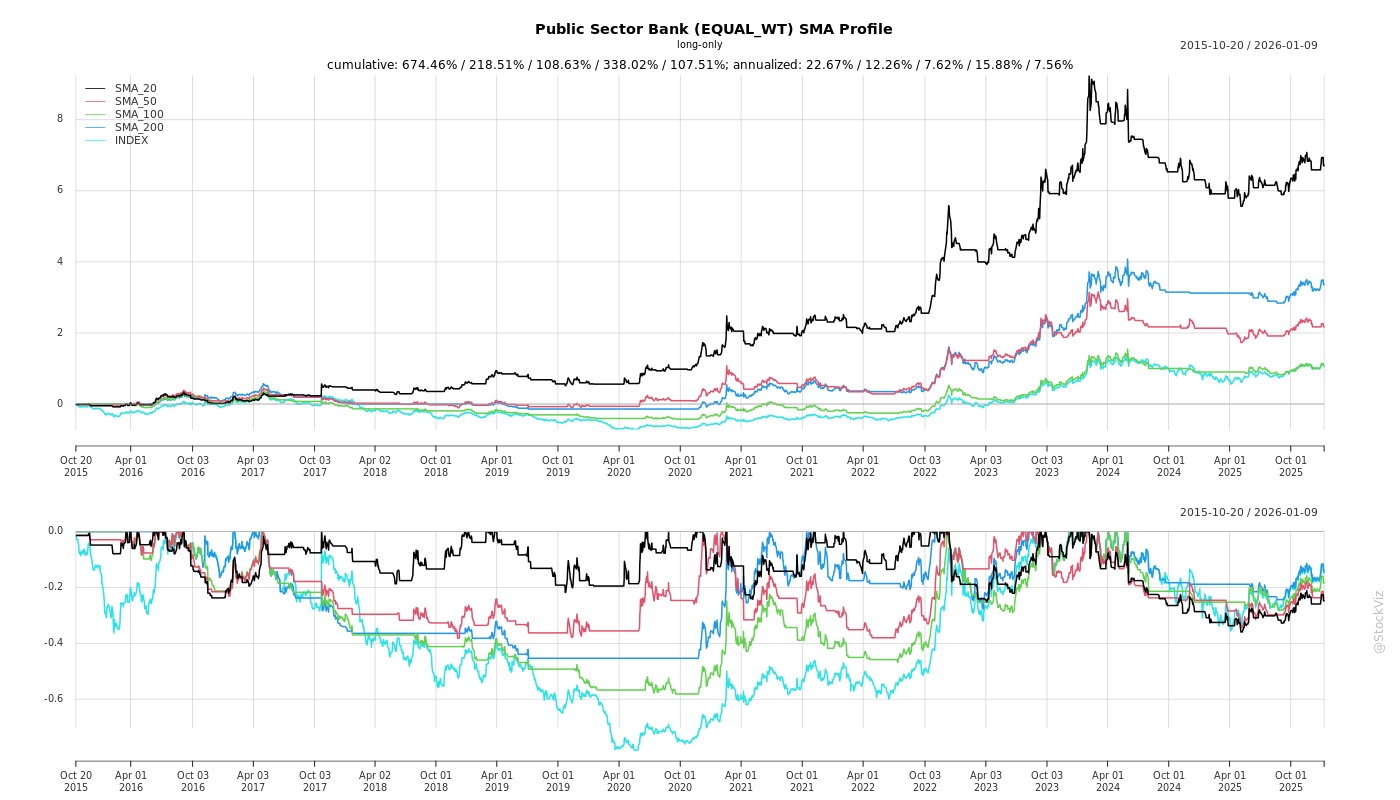
Current Distance from SMA
Rolling Returns
Market Cap
EBIT (% of Industry Total)
Revenue (% of Industry Total)
AI Summaries
Analyst
asof: 2025-12-03
Summary Analysis of Indian Public Sector Banks (PSBs) - Q2 FY26 Insights
Based on the provided documents (earnings call transcripts and disclosures from 11 PSBs including SBI, PNB, Canara Bank, Indian Bank, Union Bank, IOB, Bank of India, Bank of Maharashtra, UCO Bank, Central Bank of India, and Punjab & Sind Bank), here’s a synthesized analysis. PSBs demonstrate consistent improvement in core metrics amid macroeconomic headwinds like repo rate cuts. Overall sector trends show robust RAM-led growth, asset quality gains, and digital acceleration, but with NIM pressures and regulatory transitions as key challenges.
Tailwinds (Positive Factors)
- Asset Quality Strength: GNPA declined to 2.5-3.5% (e.g., PNB 3.45%, SBI implied low via disclosures), NNPA <0.5-1% (e.g., IOB 0.28%, BoM 0.18%), PCR >96% across most (e.g., PNB 96.91%, CBI 97.48%). Slippages contained <1% annualized (e.g., PNB 0.71%, PSB 0.17%).
- Profitability Momentum: Net profits up 15-58% YoY (e.g., PNB ₹4,904 Cr +14%, IOB ₹1,226 Cr +58%), ROA >1% (e.g., PNB 1.05%, CBI 1.01%), ROE 15-20% (e.g., IOB 19.95%). Operating profits grew 5-21% (e.g., PNB +5.46%).
- Digital & Efficiency Gains: 95-98% digital transactions (e.g., PNB, IOB), new journeys (e.g., MSME e-loans, tab banking), AI/ML for performance/HR (e.g., PNB UDAAN). Cost-income ratios improving (e.g., PNB 51.2%, IOB 45.76%).
- Capital Buffer: CRAR 17-18% (well above 11.5% regulatory), enabling growth (e.g., PNB 17.19%, BoM 18.13%).
- RAM Dominance: 55-71% of advances, growing 13-25% YoY (e.g., PNB Retail 18%, IOB 20.78%).
Headwinds (Challenges)
- NIM Compression: Global NIM 2.6-3.85% (down QoQ due to repo cuts/RLLR-linked loans ~49%; e.g., PNB 2.60% -10bps QoQ, CBI 2.89% -52bps YoY). Deposit repricing lag (e.g., PNB 60-70% term deposits to reprice).
- CASA Pressure: Ratios 37-46% (slipping; e.g., PNB 37.29%, PSB ~30-31%), shift to term deposits amid rate environment.
- Opex & Efficiency: High cost-income (e.g., CBI 62.72% +553bps YoY), staff/productivity initiatives ongoing (e.g., PSB Navjyoti project).
- Corporate Growth Mute: De-growth in some (e.g., UCO -₹4,000 Cr QoQ), focus shifting to RAM (target 60-65%).
- Slippage Volatility: Agri/MSME stress (e.g., floods in Punjab/Haryana; PNB Agri slippages ₹238 Cr).
Growth Prospects
- Credit Expansion: 10-21% YoY (RAM-led; pipelines ₹10,000-178,000 Cr, e.g., PNB ₹178,000 Cr sanctioned). Targets 11-18% FY26 (e.g., IOB 17-18%, PSB 15-16%).
- Digital/Branch Scale: 27-100+ digital journeys (e.g., PNB 100+ planned), 200-1,000 branches (e.g., BoM Project 321, CBI 250). GIFT City SBUs (multiple approvals).
- Fee/Non-Interest Income: Treasury rebound expected (e.g., PNB ₹1,500-1,800 Cr/qtr), recoveries ₹2,000-16,000 Cr FY26 (e.g., PNB ₹16,000 Cr), 3rd-party (co-branded cards, bancassurance, M&A finance).
- Sector Focus: Green/ESG (e.g., renewables, Surya Ghar), supply chain, co-lending (e.g., PSB ₹2,100 Cr), IPO/share financing.
- Capital Infusion: ₹3,000-7,500 Cr equity raises planned (e.g., PSB ₹3,000 Cr, BoM ₹5,000 Cr).
Key Risks
- ECL Transition (Apr 2027): 75-100bps CRAR hit (e.g., PNB 75-80bps, IOB ₹2,700-2,800 Cr), Stage 2 provisioning elevated; glide path (5 yrs) mitigates but P&L impact possible.
- NIM/Rates Volatility: Further repo cuts (25-50bps expected), MCLR repricing (27% book linked).
- Slippage/Recovery Uncertainty: Agri/MSME (e.g., floods), TWO recoveries lumpy (₹24,000-35,000 Cr books).
- CASA/Cost Pressures: Systemic decline; opex rise from expansions/digital spends (₹1,000-3,500 Cr FY26).
- Regulatory/External: Co-lending changes, PSB mergers rumors, cyber/mule risks (mitigated via I4C/RBI integrations).
Overall Outlook: PSBs are resilient with strong balance sheets (asset quality/profitability tailwinds) and digital/expansion momentum, poised for 12-18% credit growth FY26. Headwinds (NIM, CASA) are sector-wide but manageable via RAM focus and fee diversification. ECL is the top risk but buffered by high PCR/CRAR. Sector ROA/ROE targets: 1.1%+ / 15-20% FY26-27. Positive trajectory, monitor Q3 treasury/recoveries.
General
asof: 2025-12-03
Summary Analysis of Indian Public Sector Banks (PSBs) Sector
Using the provided announcements from PSBs (e.g., SBI, Bank of Baroda, PNB, Canara Bank, Indian Bank, Union Bank, Indian Overseas Bank (IOB), Bank of India, Bank of Maharashtra, UCO Bank, Central Bank of India, Punjab & Sind Bank), the analysis covers headwinds, tailwinds, growth prospects, and key risks. The sector shows resilience amid regulatory scrutiny, with improving fundamentals highlighted in detailed disclosures like IOB’s corporate presentation and UCO Bank’s business update. Overall, PSBs are navigating a stable macro environment with steady credit growth but face operational and compliance challenges.
Tailwinds (Positive Factors)
- Improving Asset Quality and Financial Performance: IOB reports GNPA at 1.83% (down from 7.4% in FY23), NNPA at 0.28%, PCR at 97.48%, ROA at 1.20%, and ROE at 19.95% (Sep’25). UCO Bank shows Q-o-Q advance growth of 2.27% and YoY 16.58%, with total business at ₹5.24 lakh crore.
- Stable Lending Rates: PNB and Indian Bank maintain/ slightly revise MCLR/TBLR (e.g., Indian Bank cuts 1-year MCLR to 8.80%), supporting margins amid steady repo rates.
- Digital and Operational Momentum: IOB emphasizes digital initiatives (e.g., WhatsApp Banking, UPI growth, 115 lakh mobile users), awards for tech excellence, and customer acquisition (e.g., new SB accounts surging). CASA ratios stable (UCO at 36.90%).
- Strategic Expansions: Central Bank wins bid for ~2% stakes in Generali insurance entities, boosting non-banking revenue. IOB partners in non-life insurance (18% stake).
- Capital Strength: IOB’s CRAR robust; bond redemptions (Bank of India, PSB) managed without stress.
Headwinds (Challenges)
- Regulatory Penalties and Compliance Burden: RBI fines Canara Bank (₹4.36 lakh for note shortages/mutilated notes) and Union Bank (₹8.43 lakh for soiled notes/ATM issues), signaling operational lapses in currency management.
- Legacy Physical Shares Issue: Bank of Baroda’s multi-language newspaper ads highlight SEBI-mandated re-lodgement window (Jul’25-Jan’26), reflecting ongoing demat transition challenges and KYC updates.
- Modest Rate Revisions: Minor tweaks (e.g., Indian Bank’s TBLR cut) indicate pressure on NIMs from competitive lending.
- Branch/Employee Productivity: IOB notes need for efficiency amid 3,373 branches; staff costs remain a drag.
Growth Prospects
- Retail/MSME/Agri Focus: IOB’s advances at ₹2.78 lakh crore (CAGR 12%), with retail (28%), agri (30%), MSME (17%) driving mix; CD ratio ~75-80% (UCO at 75.48%).
- Digital/Non-Interest Income: Explosive digital adoption (IOB: UPI users CAGR 31%, mobile banking 27%); fee income up (IOB ₹2,418 Cr in FY25, +26% YoY).
- Deposit Mobilization: UCO deposits +11.57% YoY; IOB global business ₹6.17 lakh crore (CAGR 9.45%).
- Network Expansion: Bank of Maharashtra plans investor meets; PSBs targeting underserved segments via 11,000+ BCs (IOB).
- Diversification: Insurance tie-ups (IOB, Central Bank) and ESG initiatives (IOB’s green deposits, low-carbon banking) position for fee-based growth.
Key Risks
- Asset Quality Deterioration: Potential slippages (IOB slippage ratio low at 0.15% but monitored); NCLT/NARCL accounts (₹15,847 Cr for IOB) vulnerable to resolution delays.
- Regulatory/Operational Risks: Frequent RBI penalties; compliance costs from SEBI LODR (e.g., KMP changes at SBI, bond disclosures).
- Interest Rate/ Liquidity Risks: Stable MCLR but dependent on RBI policy; CD ratios rising (UCO 75.48%) could strain liquidity.
- Cyber/Digital Risks: Heavy digital push (e.g., IOB’s API banking) exposes to breaches; competition from fintechs.
- Macro Risks: Slowing economy could hit retail/MSME; overseas NPAs high (IOB 7.89%).
Overall Outlook: PSBs exhibit strong tailwinds from asset quality cleanup and digital transformation, supporting 10-15% business growth. Headwinds are operational/regulatory, but manageable. Growth hinges on sustained retail credit and fee income; risks center on execution in a high-compliance environment. Sector ROE/ROA trajectory (IOB-like) suggests undervaluation potential. Investors should monitor Q3FY26 results for sustained momentum.
Investor
asof: 2025-12-03
Summary Analysis of Indian Public Sector Banks (PSBs) - Q2 FY26 Insights
Based on the provided documents (earnings call transcripts and disclosures from 11 PSBs: SBI, PNB, Canara Bank, Indian Bank, Union Bank, IOB, Bank of India, Bank of Maharashtra, UCO Bank, Central Bank of India, Punjab & Sind Bank), here’s a synthesized analysis of headwinds, tailwinds, growth prospects, and key risks. PSBs show consistent improvement in asset quality and profitability amid macro headwinds like rate cuts, but face execution challenges in margins and deposits. Overall, the sector is resilient with RAM-led growth, though ECL norms loom large.
Tailwinds (Positive Drivers)
- Robust Asset Quality & Profitability: GNPA 2.5-4.5% (down 50-150 bps YoY), NNPA <0.5-1% (PCR 91-98%). Recoveries (₹3k-4k Cr/Q) > slippages (0.7-1% ann.), negative credit cost in several (e.g., PNB). ROA 1-1.2%, ROE 15-20%, OP growth 5-15% YoY.
- RAM-Led Credit Growth: 15-25% YoY (Retail 17-30%, MSME 18-24%, Agri 13-17%); RAM share 56-71%. Organic focus with digital journeys (e.g., 60-70% vehicle loans digital in PSB).
- Strong Capital & Efficiency: CRAR 15-18% (CET1 12-15%). Cost-income 45-62% (improving via digital/opex control). NII growth 8-20%.
- Digital Momentum: 95-98% digital txns; new apps, tab banking, WhatsApp (15-83L users), CBDC. EASE topper (PSB #1 improver).
- Treasury Support: ₹150-180 Cr/Q gains; AFS reserves low (₹39-800 Cr).
Headwinds (Challenges)
- NIM Pressure: 2.6-3.85% (down 10-50 bps QoQ) from repo cuts (49-60% RLLR loans repricing fast; deposits lag). CoF up 5-20 bps.
- CASA Slip: 37-47% (down QoQ; growth 4-15% but volumes shifting to term deposits).
- Opex & Fee Volatility: Cost-income high (51-63%); non-interest income down (treasury/recovery dependent; TWO recovery muted).
- Slippage Containment: Agri/MSME stress (0.7-1% ann.; floods in Punjab/Haryana). SMA 5-6% (0: 3-4%, 1+2: 2-3%).
- ECL Prep: 75-100 bps CRAR hit; ₹2.5-2.8k Cr extra provisions (Stage 2 key; glide path 4-5 yrs).
Growth Prospects
- Credit Expansion: 11-18% FY26 (RAM 60-65% mix; corporate revival via infra/renewables/data centers). Pipeline ₹10k-18k Cr/bank; co-lending (₹2-10k Cr), M&A finance, IPO/share financing.
- Fee & Non-Fund Income: Partnerships (SBI Cards, mutual funds, bancassurance); supply chain, CC/CMS. Target ₹16k Cr recoveries FY26.
- Network/Digital Scale: 200-321 branches/Q (non-home states); GIFT City SBUs (5 banks); digital journeys (27-100+; 5-10 new).
- NIM Recovery: +5-15 bps/Q from deposit repricing/CRR cuts; treasury upside (₹1.5k Cr/Q min.).
- ROA/ROE Upside: 1.1-1.2% FY26 (from 1%); cost-income <50-55%.
Key Risks
- ECL Transition (Apr 2027): ₹2.5-3k Cr provisions (75-100 bps CRAR); P&L hit if not buffered (₹250-1k Cr excess held).
- Margin Squeeze: Further repo cuts (25-50 bps expected); CASA <37%; high RLLR (49-60%).
- Sectoral Stress: Agri/MSME slippages (floods, GST lag); unsecured retail.
- Execution/Regulatory: Digital adoption, cyber/mule risks; branch expansion costs; PSB merger rumors.
- Macro: Slow corporate capex; deposit competition; TWO recovery volatility (₹24-35k Cr book).
Overall Outlook: PSBs are on a strong recovery trajectory (asset quality/profitability peaks), with RAM/digital as growth engines (15%+ advances). FY26 ROA >1.1%, NIM stabilization key. ECL is the biggest wildcard (manageable via buffers/glide path). Sector tailwinds from govt. schemes/infra outweigh headwinds; sustained execution could drive 15-20% earnings CAGR. Risks tilted toward macros/regulations, but capital buffers provide cushion. Recommendation: Positive; monitor Q3 NIM/ECL updates.
Press Release
asof: 2025-11-29
Summary Analysis of Indian Public Sector Banks (PSBs) Sector
Based on the provided press releases from 12 major PSBs (SBI, PNB, Canara Bank, Indian Bank, Union Bank, IOB, Bank of India, Bank of Maharashtra, UCO Bank, Central Bank of India, Punjab & Sind Bank, and others) for Q1/Q2 FY26 (as of Sep 2025), the sector demonstrates robust recovery and resilience. Key metrics show YoY business growth of 10-15%, deposit/advance expansion, sharp asset quality improvements (GNPA down 100-200 bps), and profit growth of 10-60%. However, QoQ variations and macro pressures persist. Below is a structured analysis of headwinds, tailwinds, growth prospects, and key risks.
Tailwinds (Positive Drivers)
- Strong Business Momentum: Global business grew 11-14% YoY across banks (e.g., PNB: ₹27.2L Cr, Canara: ₹26.8L Cr). Deposits up 9-13% (e.g., Indian Bank: 12%), advances 10-21% (e.g., IOB: 21%). RAM (Retail, Agri, MSME) advances surged 15-30% (e.g., BoM: Retail +37%, PSB: MSME +25%), driven by housing/vehicle loans.
- Asset Quality Turnaround: GNPA ratios improved 100-200 bps YoY (e.g., Central Bank: 4.59%→3.01%, PSB: 4.21%→2.92%). NNPA down 20-100 bps (e.g., IOB: 0.47%→0.28%). PCR >93-98% (e.g., BoM: 98.34%). Lower slippages/credit costs (0.1-0.5%).
- Profitability Surge: Net profit up 10-58% YoY (e.g., IOB: +58% to ₹1,226 Cr, BoM: +23% to ₹1,633 Cr). Operating profit +12-25%, NII +5-20%. ROA 1-1.8%, ROE 15-23%. NIM stable/improving (2.7-3.85%).
- Capital Strength & Efficiency: CRAR 16-18% (Tier-1 >14%). Cost-income ratios improving (37-62%). Digital growth (e.g., PNB: 32% txn rise, UPI users +24% at Indian Bank).
- Policy Support: Financial inclusion (PMJDY/APY enrollments up), awards (EASE 7.0, digital payments), and SBI’s SBIFML IPO signal value unlocking.
Headwinds (Challenges)
- Margin/NII Pressure: QoQ NII dips in some (e.g., Union Bank: -3%, BoI: -2.6%). NIM compression (e.g., Union: 2.97%→2.71%). Deposit costs up (5-5.5%), CASA shares volatile (32-50%, some down QoQ).
- Operational Costs: Cost-income ratios high (50-62% in Union/Central/PSB). Operating profit QoQ flat/declining in places (e.g., Central: down due to NII drop).
- Liquidity & Growth Imbalance: CD ratios rising (71-82%), indicating advance-led growth straining deposits (e.g., BoM: 82%).
- Uneven Performance: Smaller banks (UCO/PSB) lag in scale/profitability vs. leaders (SBI/BoM/IOB). Global advances slower in overseas ops.
Growth Prospects
- Credit Demand in RAM/Green Segments: 15-30% YoY RAM growth positions PSBs for retail/MSME boom. Green loans (e.g., Union: ₹32k Cr renewable), women schemes (Union Nari Shakti), and housing (+15-25%) offer 15-20% CAGR potential.
- Subsidiary Monetization & Listings: SBI’s SBIFML IPO (10% stake, ₹12L Cr AUM) unlocks value; others may follow (e.g., SBI Cards/Life precedent).
- Digital & Inclusion Expansion: 20-100% YoY digital txn/user growth (e.g., PNB WhatsApp +105%). Network growth (10k+ branches, BCs/ATMs). Priority sector targets exceeded (40-44%).
- Macro Tailwinds: India’s FY26 growth (projected 7%+ GDP), capex cycle, and govt. schemes (PMJDY +5-10%) support 12-15% business CAGR. ROA/ROE could hit 1.5-2%/20%+.
- M&A/Consolidation: PSB mergers (history like PNB-OBC) could boost scale/efficiency.
Key Risks
- Asset Quality Reversal: Slippages (0.1-0.8%) could rise with slowdowns; credit costs (0.2-0.5%) sensitive to corporate/MSME stress. PCR buffers exist but untested.
- Interest Rate/Yield Curve: Rising deposit costs eroding NIM (already compressed 10-50 bps QoQ). RBI policy shifts (repo cuts?) critical.
- Liquidity & Funding: High CD ratios + CASA erosion risk MCLR hikes, squeezing margins.
- Competition & Execution: Private banks gaining retail share; PSBs’ high CIR/digital lag could erode market (15% share in mutual funds via SBIFML).
- Macro/Regulatory: Inflation, global slowdown, elections, or Basel III tweaks. Geopolitical risks (e.g., oil prices) hit trade finance.
- Operational: Cyber/fraud risks (despite awards); staff productivity varies (business/employee ₹24-27 Cr).
Overall Outlook: PSBs are in a strong upcycle (asset quality + profitability peak), with tailwinds outweighing headwinds. Growth prospects are high (12-15% business CAGR) if macro holds, but risks center on margins and NPAs. Sector PE could rerate to 8-10x on sustained ROA>1.2%. Leaders (SBI, BoM, IOB) outperform; laggards need efficiency push. Investors should monitor Q3 NIM/CD ratios.
Copyright © 2023 SAS Data Analytics Pvt. Ltd. All rights reserved.