INFY
Equity Metrics
September 24, 2026
Infosys Limited
Computers - Software & Consulting
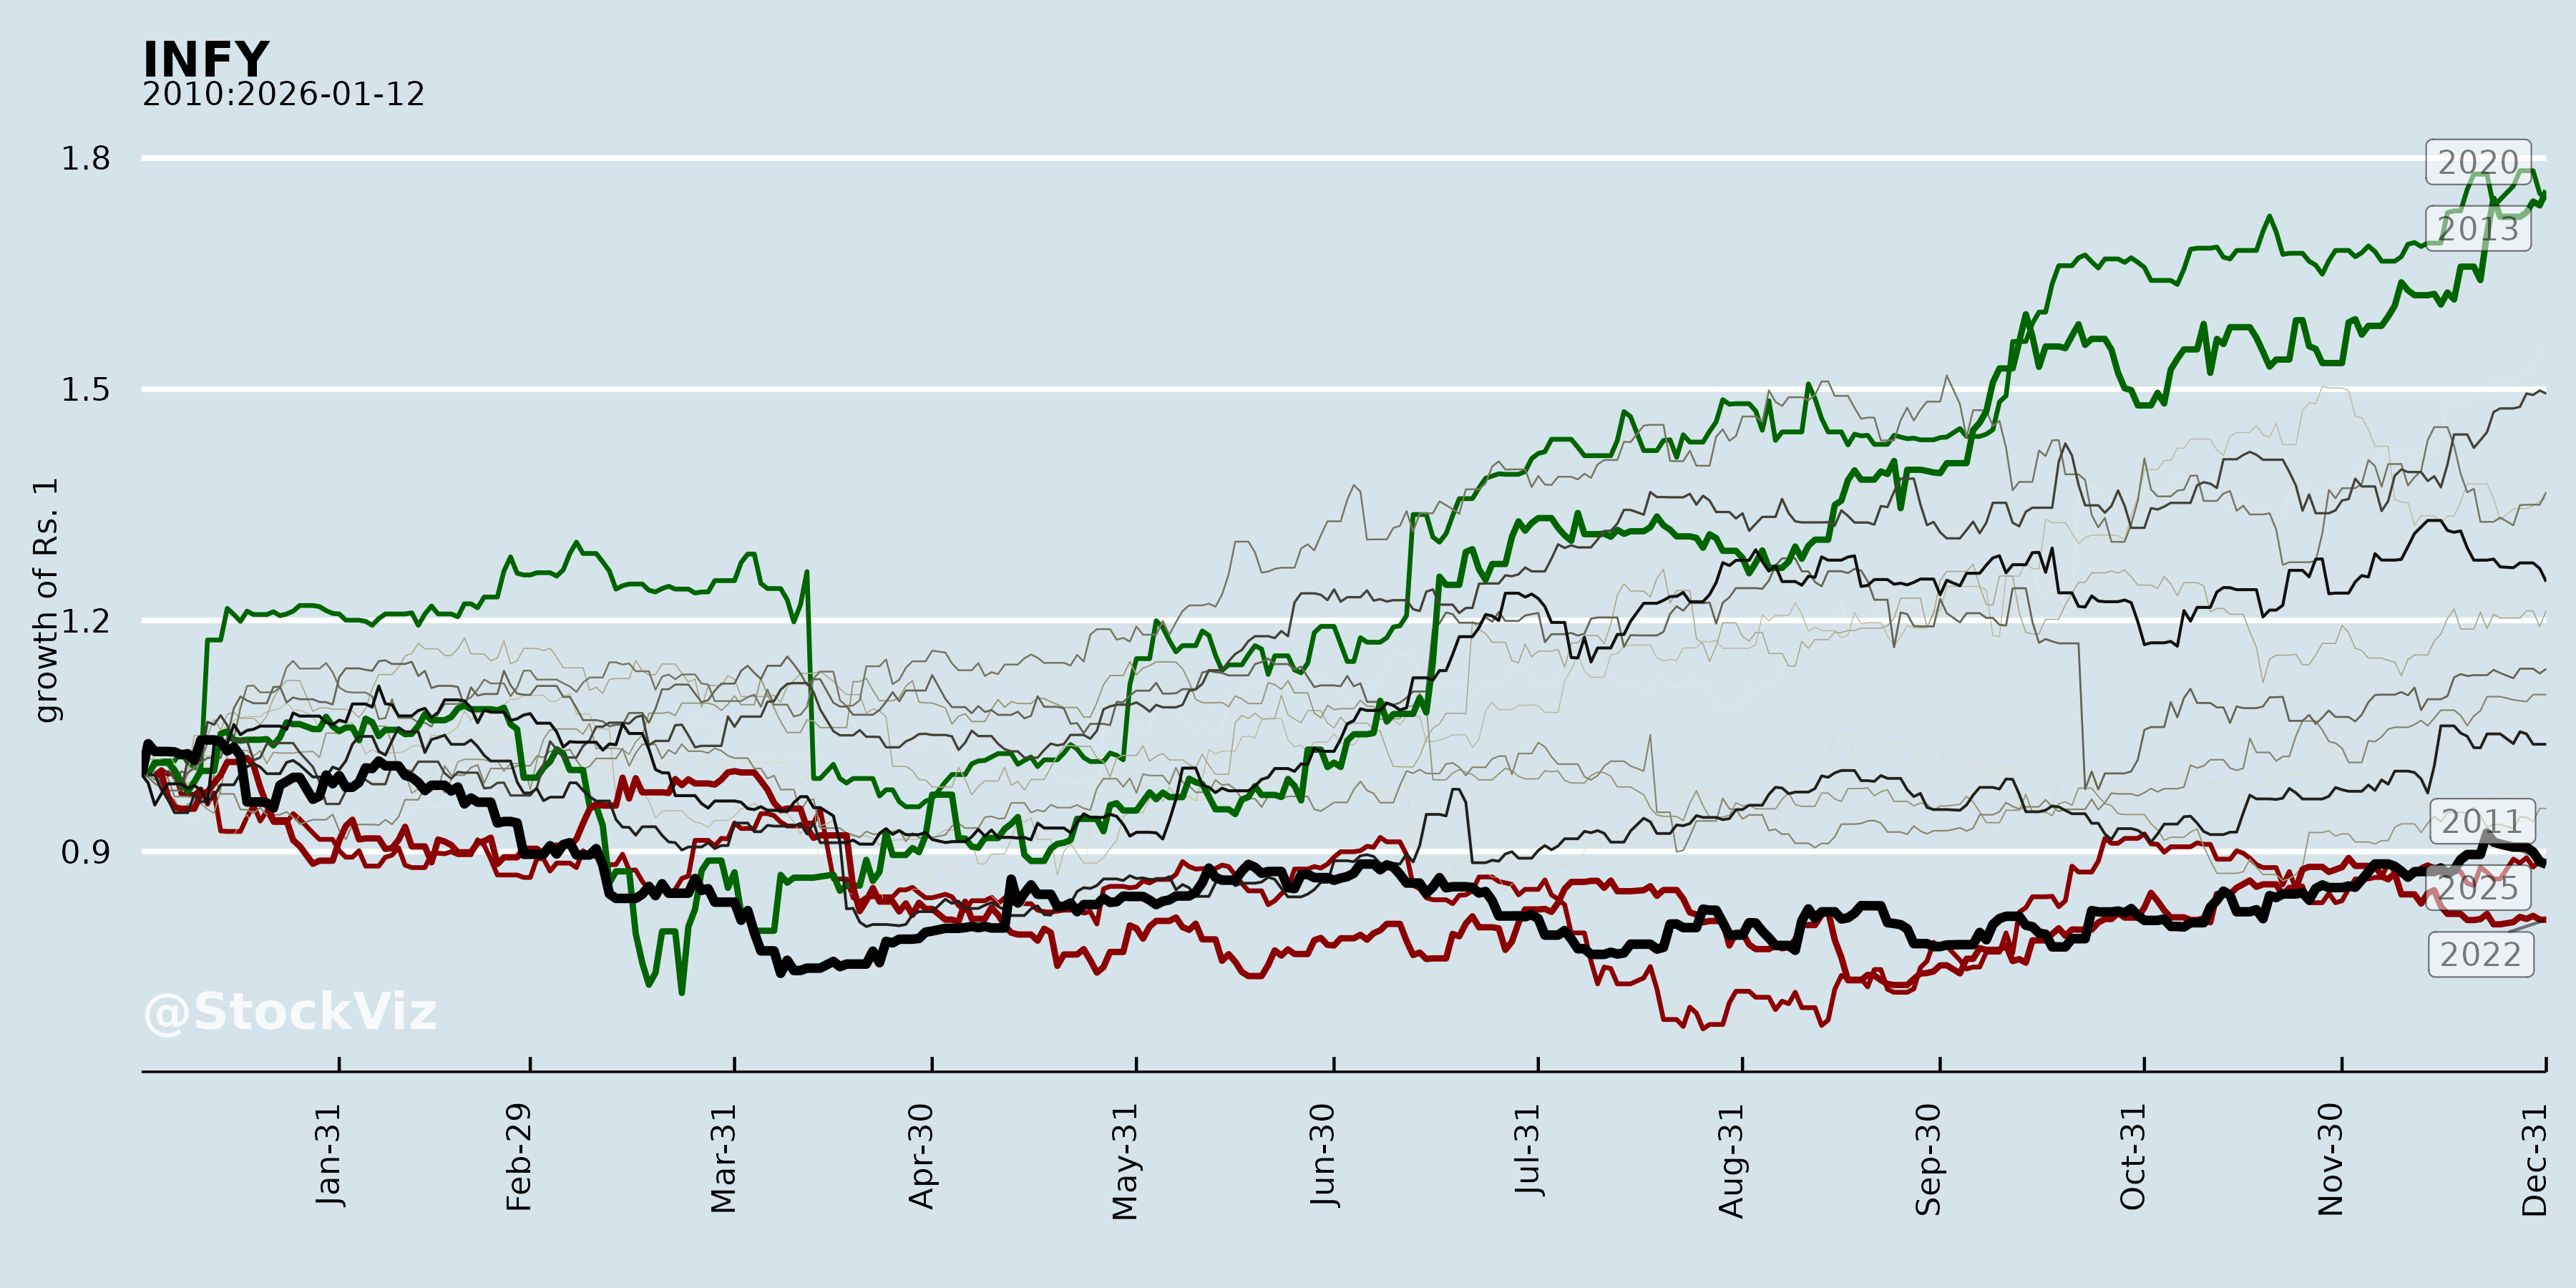
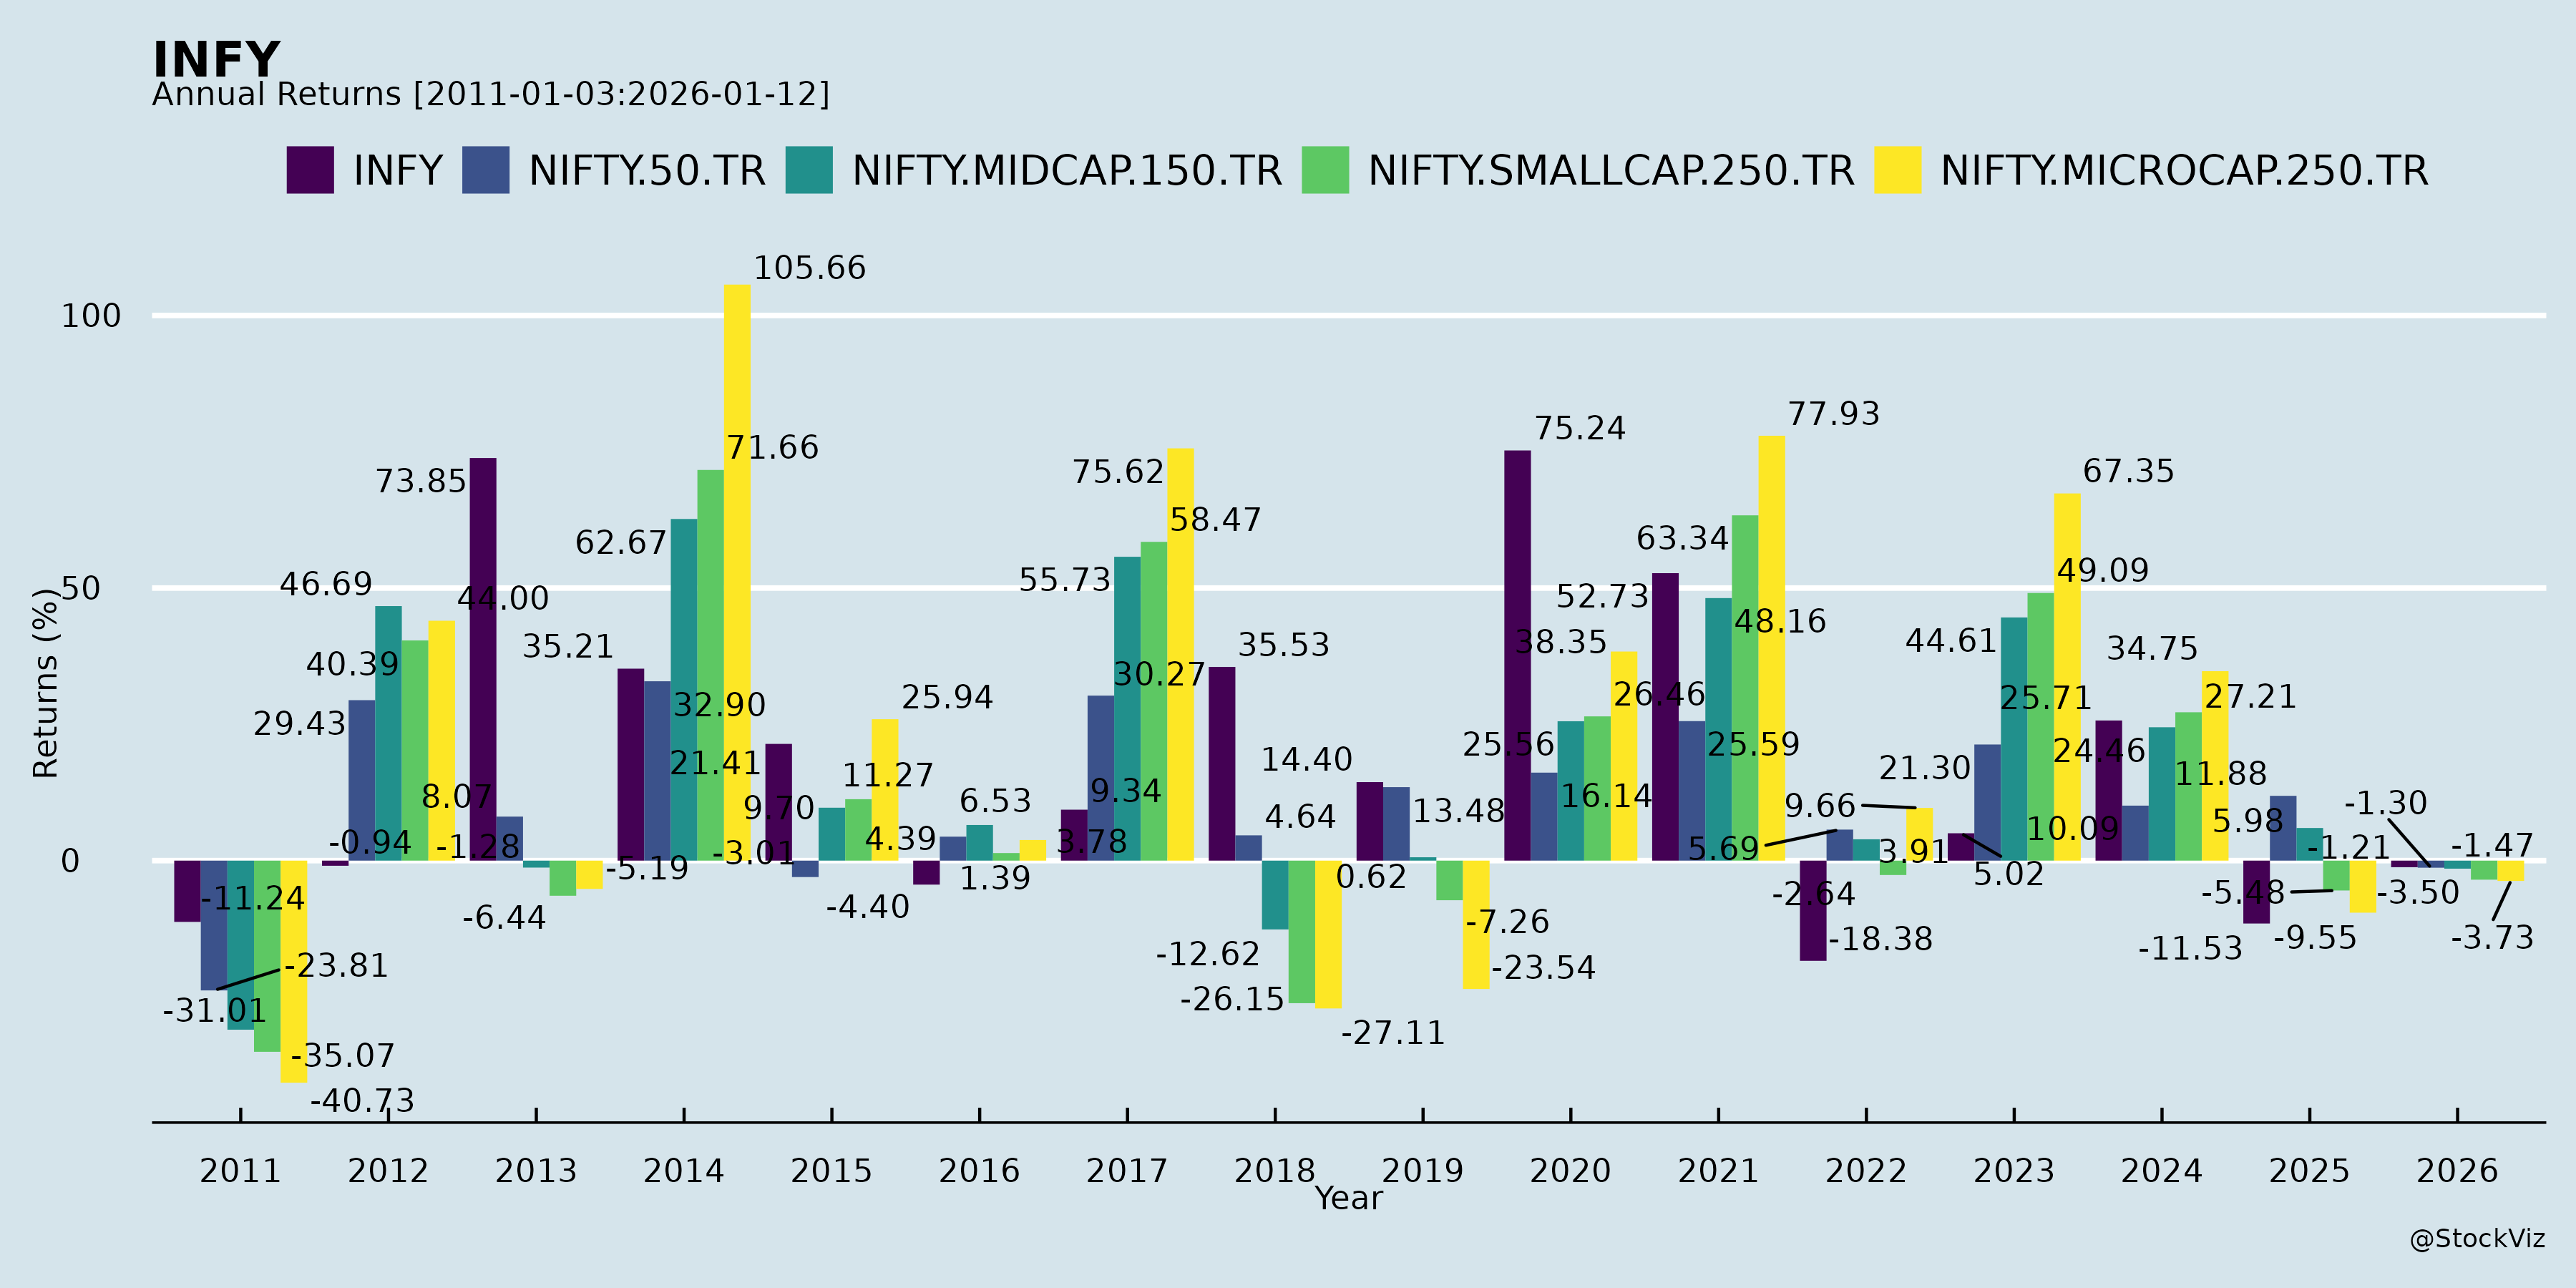
Annual Returns
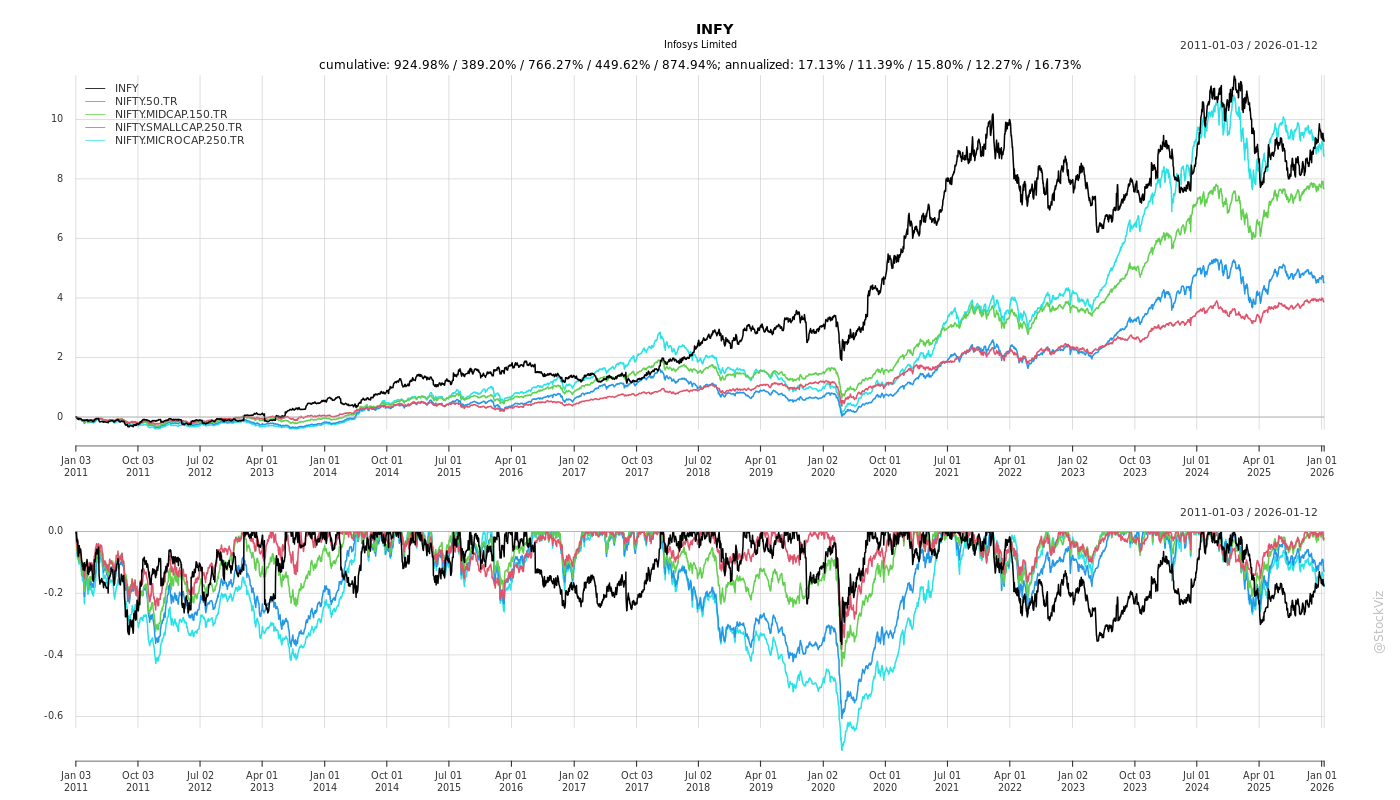
Cumulative Returns and Drawdowns
Fundamentals
Ownership
Margined
AI Summary
asof: 2026-09-14
Infosys Q1 FY27: Headwinds, Tailwinds, Risks, and Guidance Versus Performance
1. Headwinds and Challenges
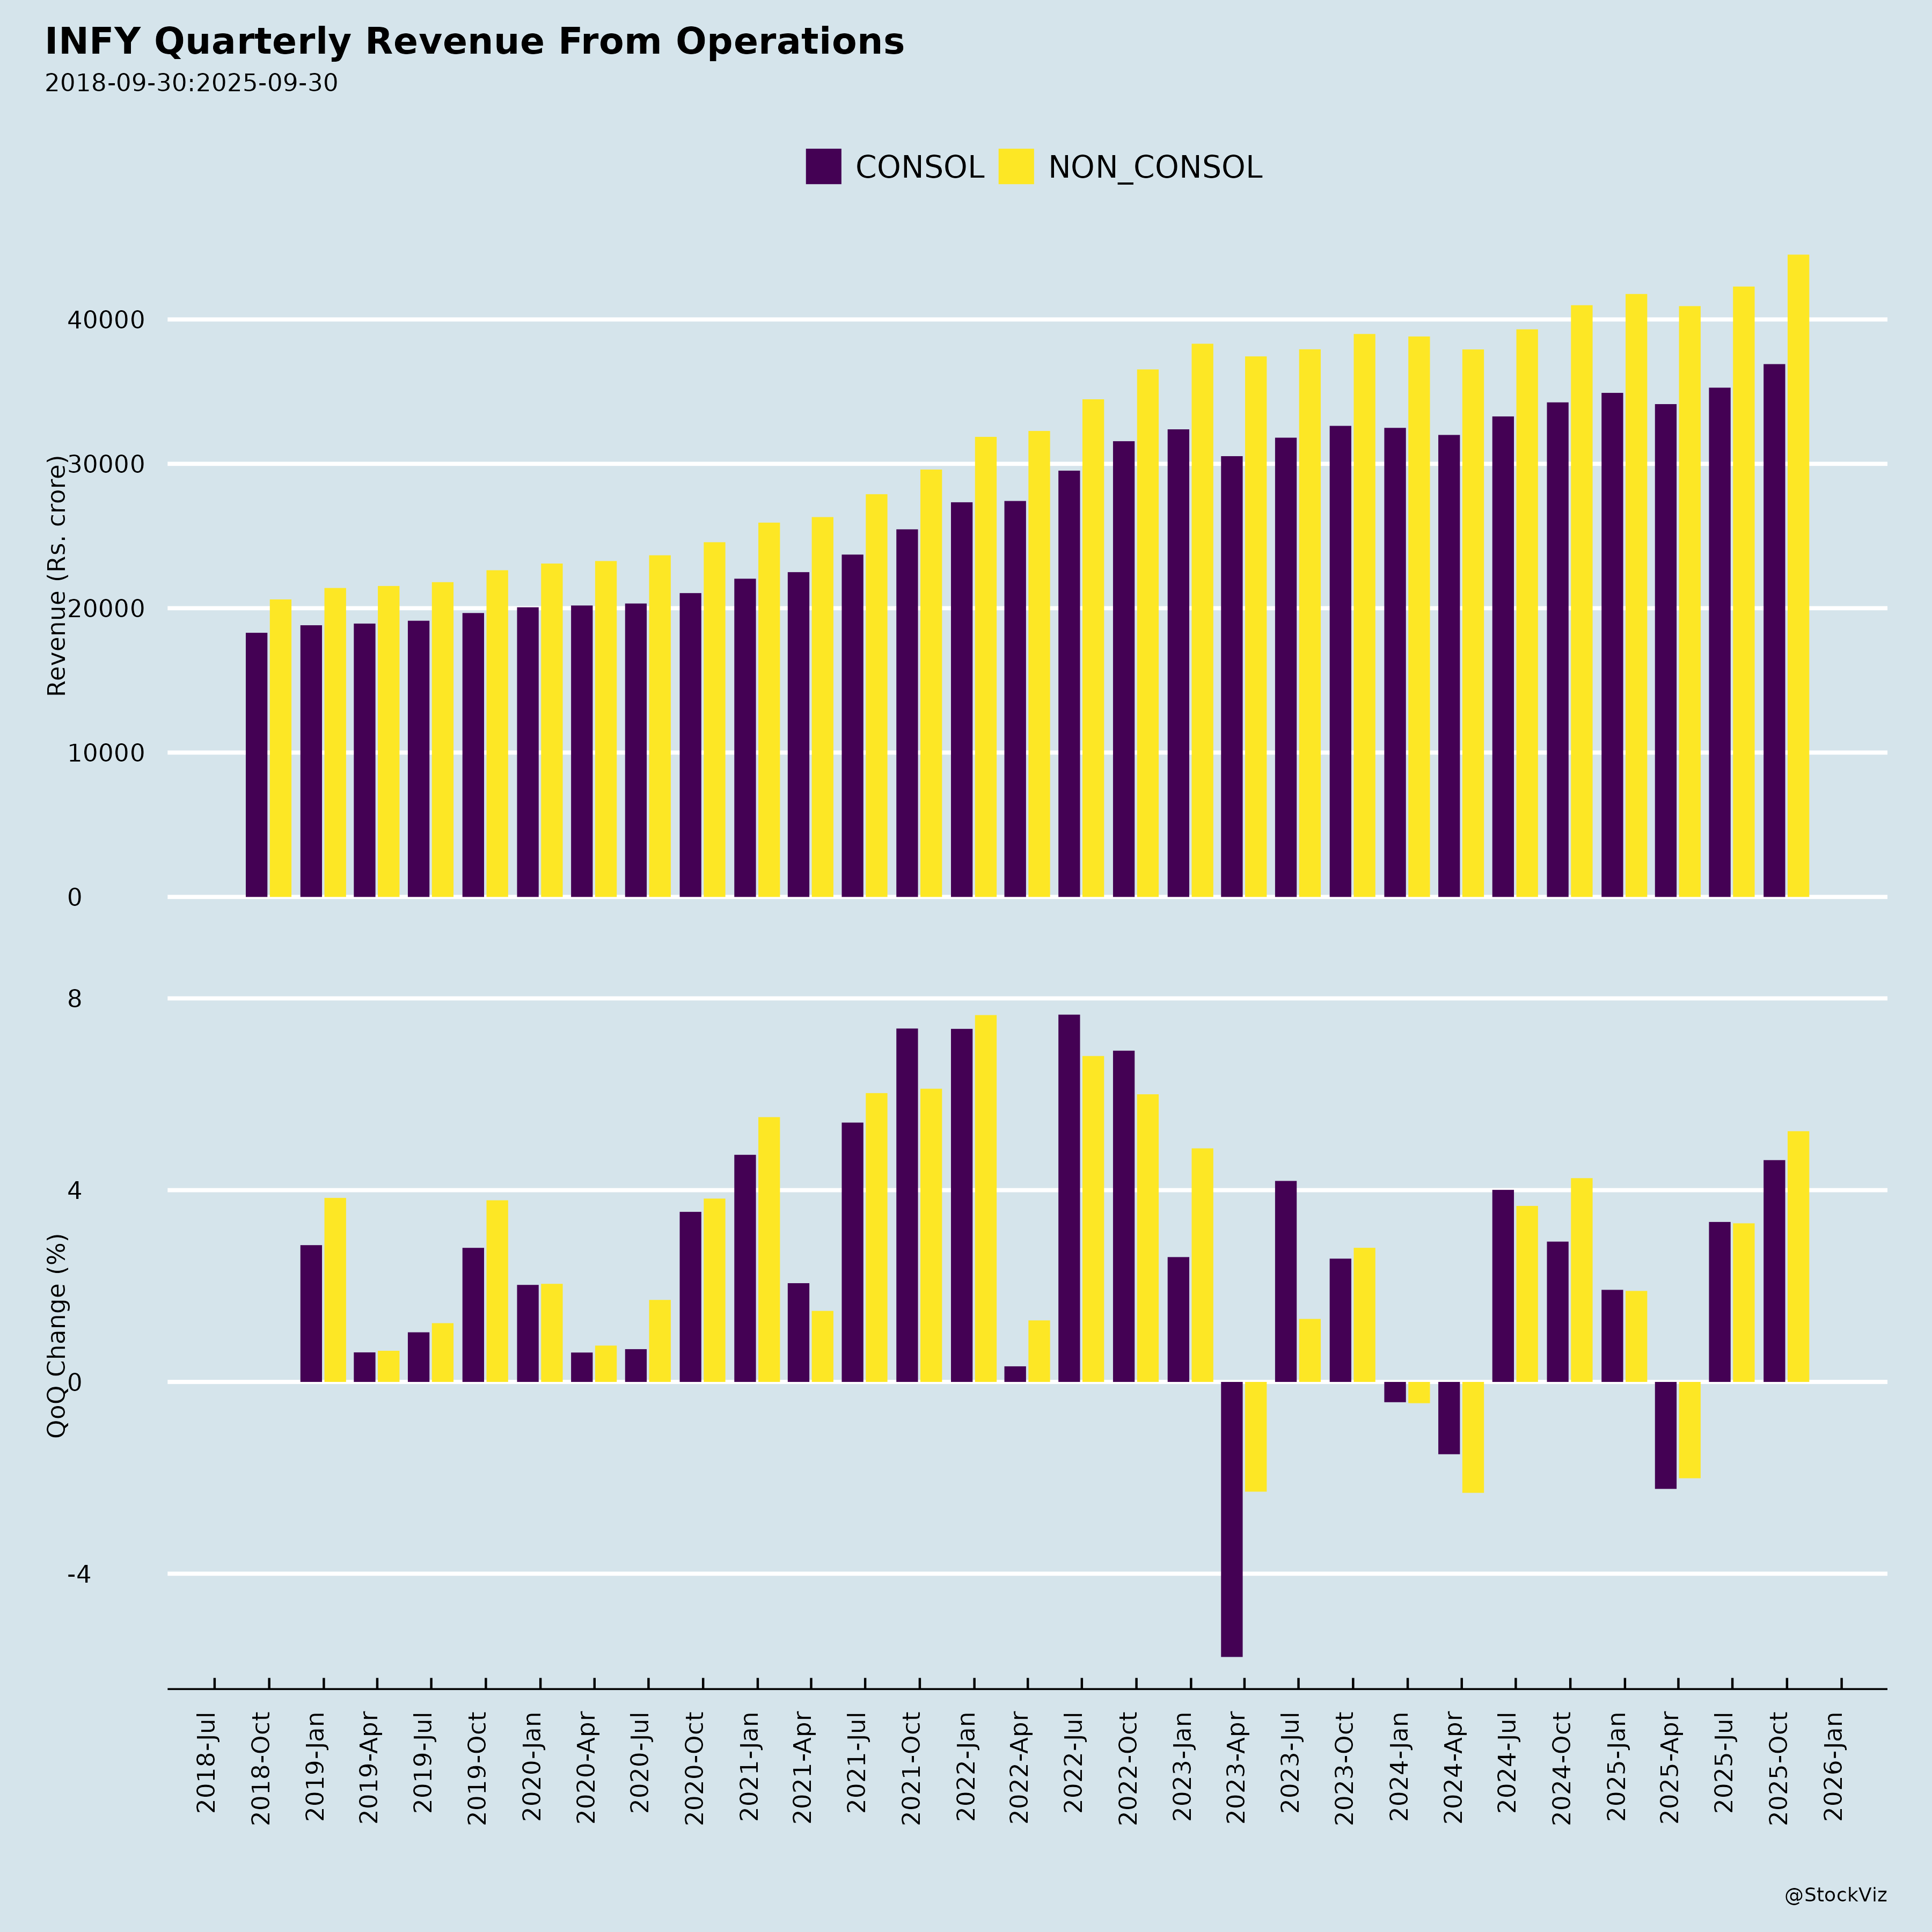
- Soft overall growth. Q1 FY27 revenue growth was modest: 2.8% year on year in reported terms and 2.4% in constant currency, with sequential growth of 0.8% reported and 1.0% in constant currency. The company described the operating environment as “challenging.”
- Segment softness. Retail declined 1.5% year on year reported and 1.8% in constant currency, and the “Others” segment fell 12.6% reported and 9.9% in constant currency. Manufacturing grew only 1.7% reported and 1.0% in constant currency, and Energy, Utilities, Resources & Services grew 1.4% reported and 1.3% in constant currency.
- Geography softness. India revenue declined 12.0% reported and 4.2% in constant currency, and Rest of the World declined 1.6% in constant currency.
- Profitability pressure below the operating line. Other income, net of finance cost, fell 17.3% year on year in US dollar terms and 7.7% in rupee terms. Income tax expense rose 4.3% year on year in US dollar terms and 15.5% in rupee terms, with current tax rising sharply.
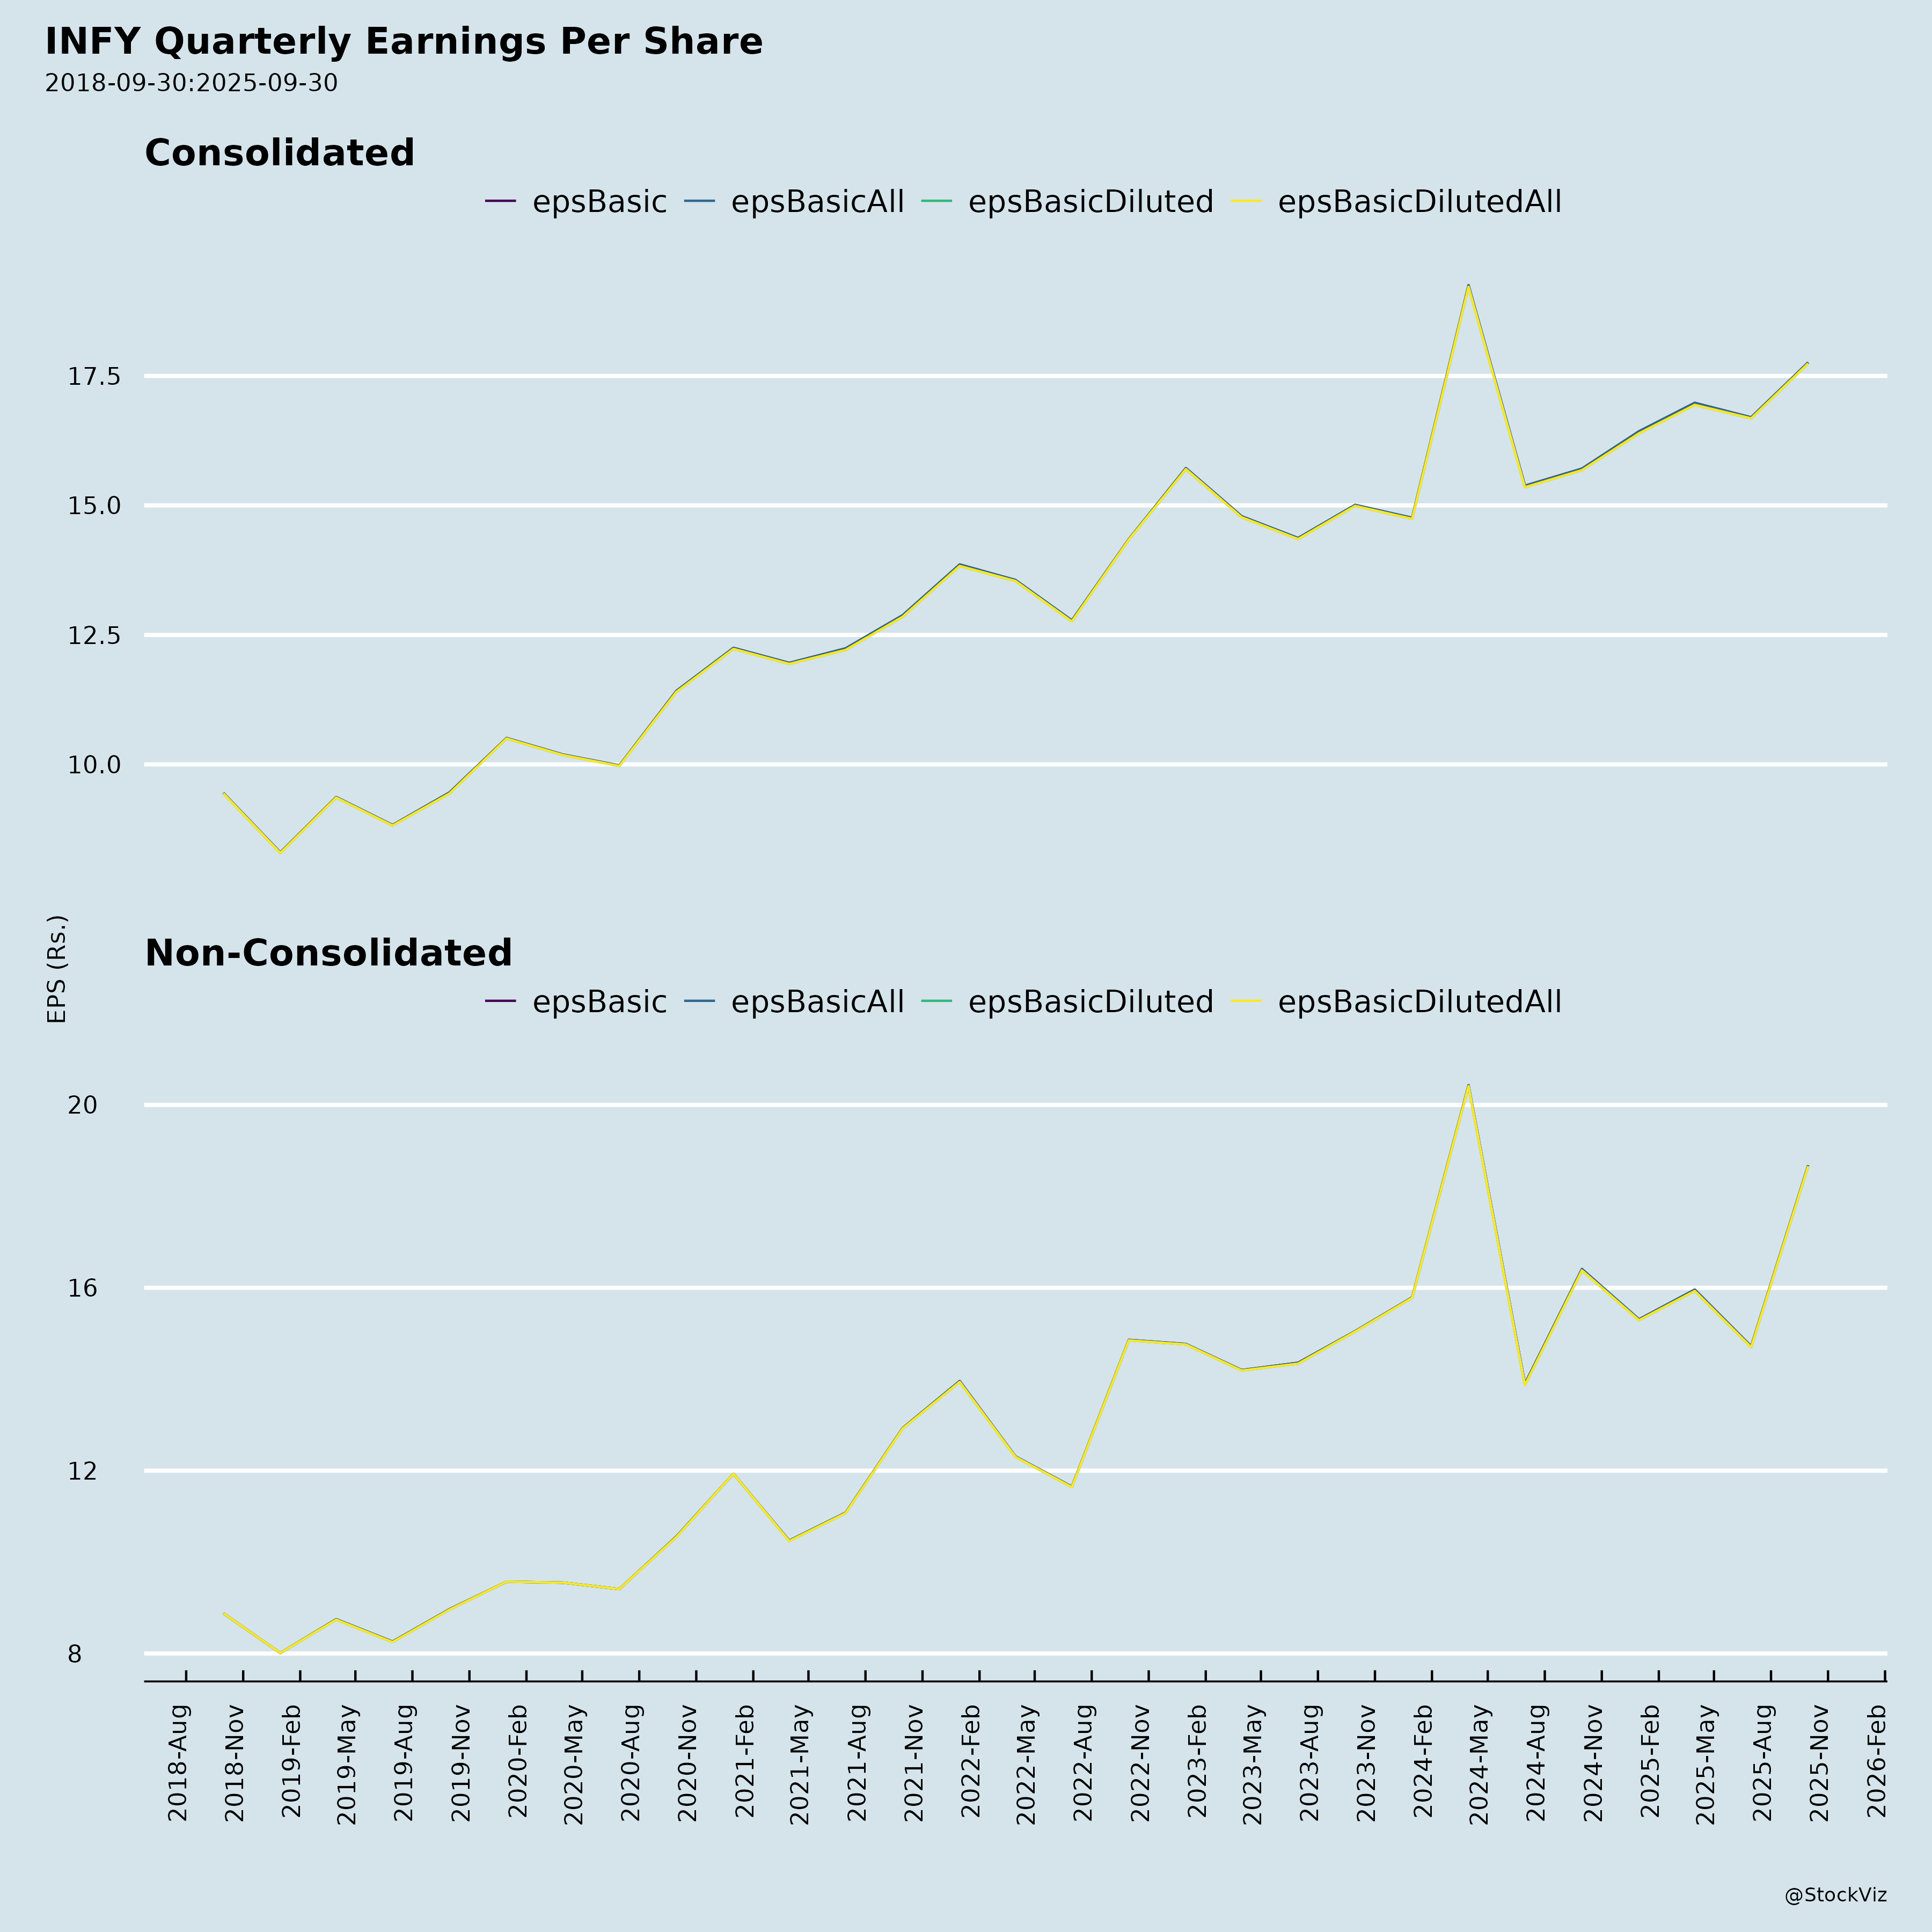
- Sequential profit decline. Net profit after non-controlling interests fell 10.9% quarter on quarter in US dollar terms and 8.6% in rupee terms. Basic EPS declined 10.9% quarter on quarter in US dollar terms and 8.7% in rupee terms.
- Rising operating costs. Total operating expenses grew 6.2% year on year in US dollar terms, with administrative expenses up 7.9% and selling and marketing up 4.7%. In rupee terms, total operating expenses rose 17.9%, administrative expenses rose 19.7%, and selling and marketing rose 16.3%.
- Attrition edged up. Voluntary attrition (LTM, IT Services) rose to 13.0% from 12.6% in the prior quarter, though it remained below the 14.4% of the year-ago quarter.
- Lower cash and investments. Consolidated cash and investments declined to $3,916 million from $4,542 million at March 31, 2026 and $5,271 million a year earlier. In rupee terms, they fell to ₹37,065 crore from ₹43,075 crore and ₹45,204 crore respectively.
- Client concentration declined. Contribution from the top 5 clients fell to 12.1% from 12.6% sequentially and 13.2% a year earlier; top 10 fell to 19.9% from 20.2% and 20.8%; top 25 fell to 33.9% from 34.5% and 35.2%.
- Guidance trimmed. FY27 revenue guidance was revised to 1.5%–3.0% in constant currency.
2. Tailwinds and Growth Prospects
- AI revenue traction. AI accounted for 8.2% of revenue in Q1. Management stated that AI momentum is “rapidly converting into revenue” and translating into market share gains.
- Large deal wins. Large deal TCV was $3.6 billion, with 61% net new.
- Life Sciences strength. Life Sciences grew 26.3% year on year reported and 24.0% in constant currency, the fastest-growing segment, with segment profit rising to ₹619 crore from ₹554 crore a year earlier.
- Financial Services scale and growth. Financial Services remained the largest segment at 27.9% of revenue, growing 2.9% reported and 2.4% in constant currency, with segment profit of ₹3,662 crore versus ₹2,973 crore a year earlier.
- Europe growth. Europe grew 4.8% reported and 2.8% in constant currency, and North America grew 2.7% reported and 3.2% in constant currency.
- Client additions. Active clients rose to 2,027 from 1,965 sequentially and 1,861 a year earlier. Gross client additions were 155, up from 111 and 93 in the comparable periods. Million-dollar-plus clients rose to 1,026 and $10-million-plus clients to 333.
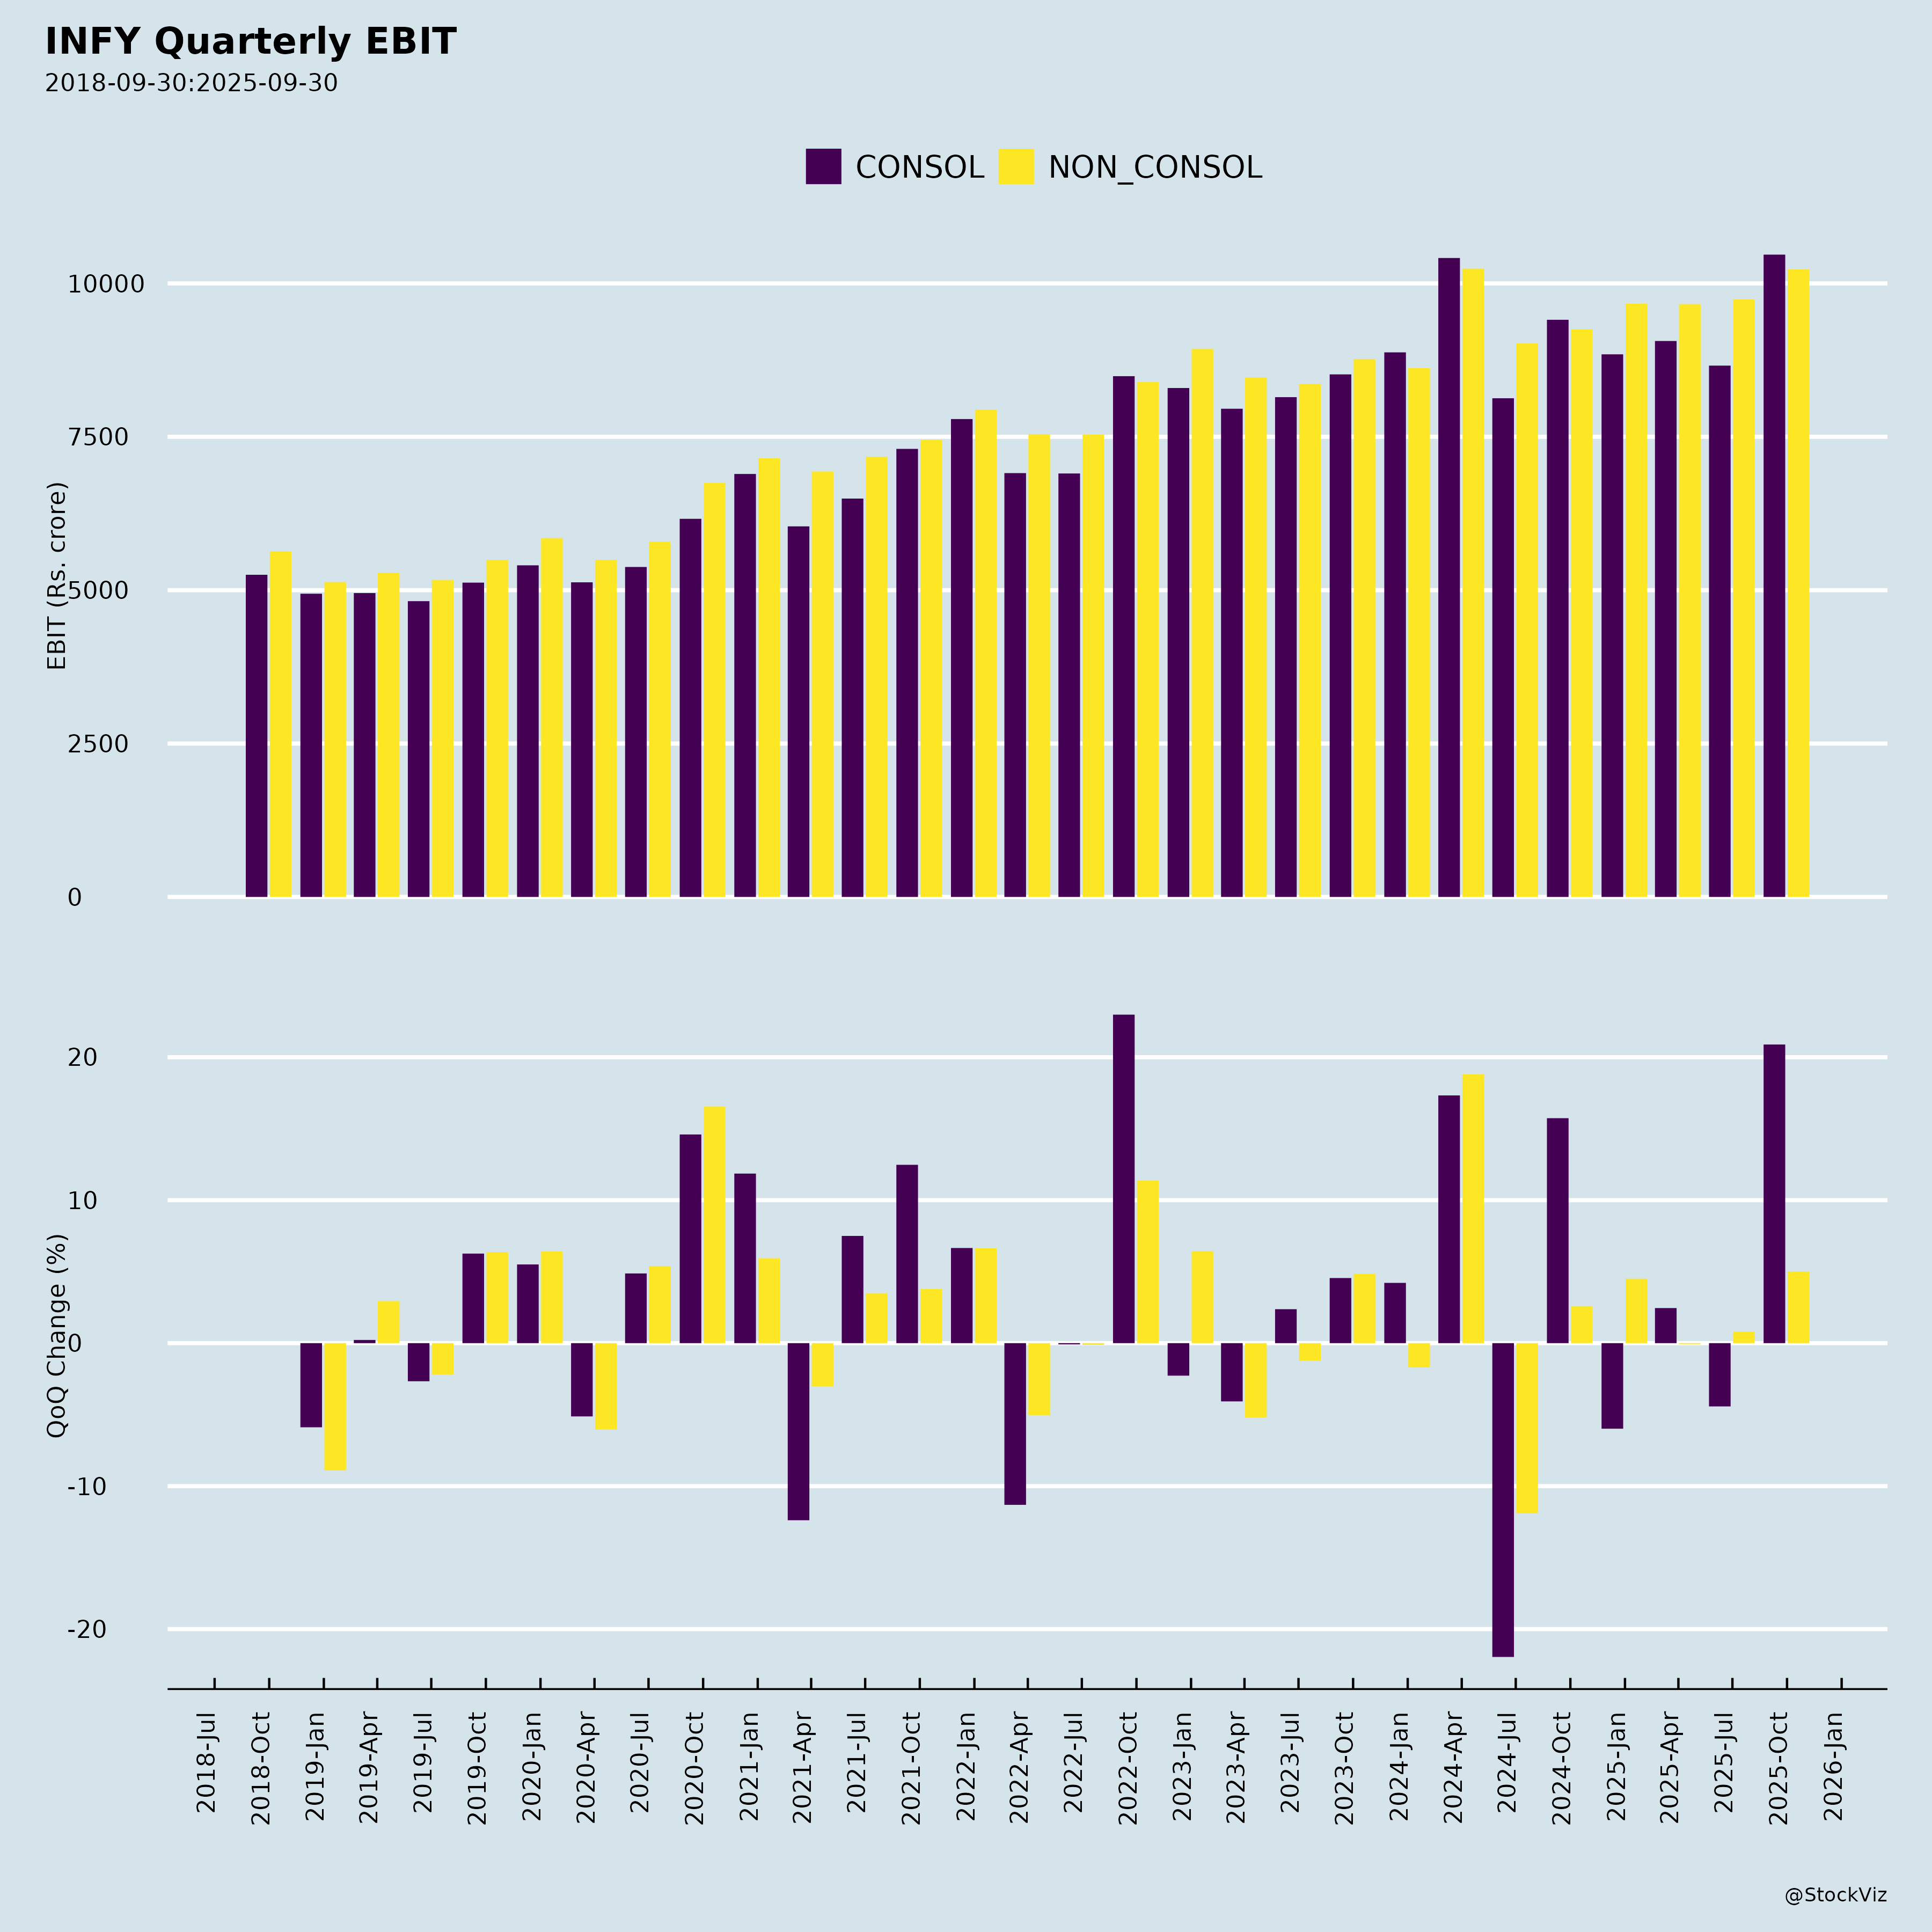
- Margin resilience. Operating margin was 21.1%, up 0.3% year on year and 0.1%–0.2% sequentially, within the retained 20%–22% guidance band.
- Strong cash generation. Free cash flow was $955 million (₹9,051 crore), with FCF conversion at 116.4%–116.5% of net profit.
- Receivables improvement. Days sales outstanding improved to 63 from 67 sequentially and 70 a year earlier.
- Utilization improvement. Utilization including trainees rose to 82.1% from 79.7% sequentially; excluding trainees it rose to 84.9% from 83.0%.
- Offshore mix. Offshore effort rose to 77.2% from 76.4% a year earlier, with onsite falling to 22.8% from 23.6%.
- AI ecosystem partnerships. Collaborations with OpenAI (Codex deployment), Harness, and others, alongside client engagements including Mercedes-Benz, Nokia, Bendigo Bank, DNB Bank ASA, Sentara, GlobalFoundries, Spark New Zealand, Cox Communications, Ventura Foods, Sterling Bank of Asia, and Bank of Sydney.
- Leadership continuity. Ashiss Kumar Dash was appointed CEO Designate effective July 23, 2026, with the intention to appoint him CEO and Managing Director from April 1, 2027 for a five-year term, succeeding Salil Parekh, who will lead until March 31, 2027.
- Acquisitions expanding capability. Stratus Global LLC (insurance technology, acquired April 21, 2026 for up to $74 million) and Optimum Achieve Holdings Inc. (healthcare digital transformation, acquired May 4, 2026 for up to $365 million), plus approval to incorporate a step-down wholly owned subsidiary in Singapore.
- Recognition. Multiple analyst and industry recognitions, including Leader positions in Gartner Magic Quadrant for Cloud ERP Services, Everest Group assessments, HFS Horizons, and Forrester Wave for Digital Banking Engagement Platforms.
3. Key Risks
- Execution of business strategy and the ability to sustain AI-led transformation momentum.
- Talent competition and retention, including increased competition for talent, wage increases, and reskilling investments.
- Hybrid work model implementation.
- Economic uncertainties and geopolitical situations.
- Technological disruption and innovation, particularly artificial intelligence.
- Regulatory landscape, including immigration regulation changes, particularly in the United States.
- ESG vision execution.
- Capital allocation policy and expectations concerning market position, future operations, margins, profitability, liquidity, and capital resources.
- Corporate actions including acquisitions, and integration of recently acquired entities.
- Cybersecurity matters.
- Pending litigation and the US government investigation.
- Current and future tariffs.
- Currency fluctuation impact on reported revenue growth.
- Client concentration remains a structural consideration despite declining top-client contribution.
4. Management Guidance Versus Observed Business Performance
- FY27 revenue guidance: 1.5%–3.0% in constant currency (revised). Q1 FY27 actual constant currency growth was 2.4% year on year, within the guided range.
- FY27 operating margin guidance: 20%–22% (retained). Q1 FY27 actual operating margin was 21.1%, within the guided range and up 0.3% year on year.
- Management commentary on margins and cash: The CFO stated that resilient margins of 21.1% and consistent strong cash generation reflect the strength of the business model, disciplined execution, and focus on operational excellence in a challenging business environment. Observed FCF was $955 million with 116.5% conversion of net profit, consistent with that commentary.
- Management commentary on AI: Management stated AI momentum is rapidly converting into revenue and demonstrating market share gains. Observed AI revenue was 8.2% of revenue, with large deal TCV of $3.6 billion (61% net new), consistent with that commentary.
- Management commentary on growth investments: The CFO stated the company is accelerating investments in AI, talent, and platforms to drive future growth while maintaining financial flexibility. Observed increases in selling and marketing and administrative expenses, and the two acquisitions completed in April and May 2026, are consistent with that stated direction.
- Leadership transition guidance: The Board approved Dash as CEO Designate effective July 23, 2026 until March 31, 2027, with intended appointment as CEO and Managing Director from April 1, 2027 for five years, subject to shareholder approval and statutory requirements. Salil Parekh continues as MD & CEO until March 31, 2027.
Broker Narrative
The earliest reports highlighted near-term macro overhangs on demand and cautious enterprise spending, while the latest report shifted focus to AI-related headwinds like limited pilot-to-production conversion and chip innovation risks. Persistent themes included cautious enterprise spend and tight industry capacity, but the narrative evolved from general macro caution to specific AI infrastructure and monetization challenges. Tailwinds also transitioned from broad demand recovery expectations to accelerating cloud growth, AI buildout capex, and expanding usage-based monetization models.
Fears that came true
- Near-term macro overhang on demand and cautious reprioritization of spends toward cost optimization materialized, as reflected in the prolonged DISAPPOINTMENT streak from mid-2023 through most of 2025 with actual returns deeply negative.
- Delayed approval cycles and tighter scrutiny on enterprise spending persisted, correlating with the sustained string of negative actual returns and DISAPPOINTMENT outcomes across hundreds of broker calls.
- Near-term shortages and supply-chain bottlenecks flagged in the latest report align with the continued underperformance and negative actual returns observed through 2025-2026.
Optimism that failed
- Expected demand recovery through H2FY24E failed to materialize, as actual returns remained deeply negative throughout H2FY24 and beyond with repeated DISAPPOINTMENT outcomes.
- Strong operating cash conversion and robust balance sheets did not translate into positive price performance, with actual returns staying negative despite these fundamentals.
- Attractive payout yields crossing historical marks failed to drive share price appreciation, as the stock delivered negative actual returns across nearly all buy calls.
- Accelerating cloud growth and AI buildout capex optimism was disappointed, as the stock continued to underperform with DISAPPOINTMENT outcomes even after these themes became prominent in the latest report.
Broker Timeline
129 broker calls · 2023-05-10 to 2026-08-02
Copyright © 2023 SAS Data Analytics Pvt. Ltd. All rights reserved.