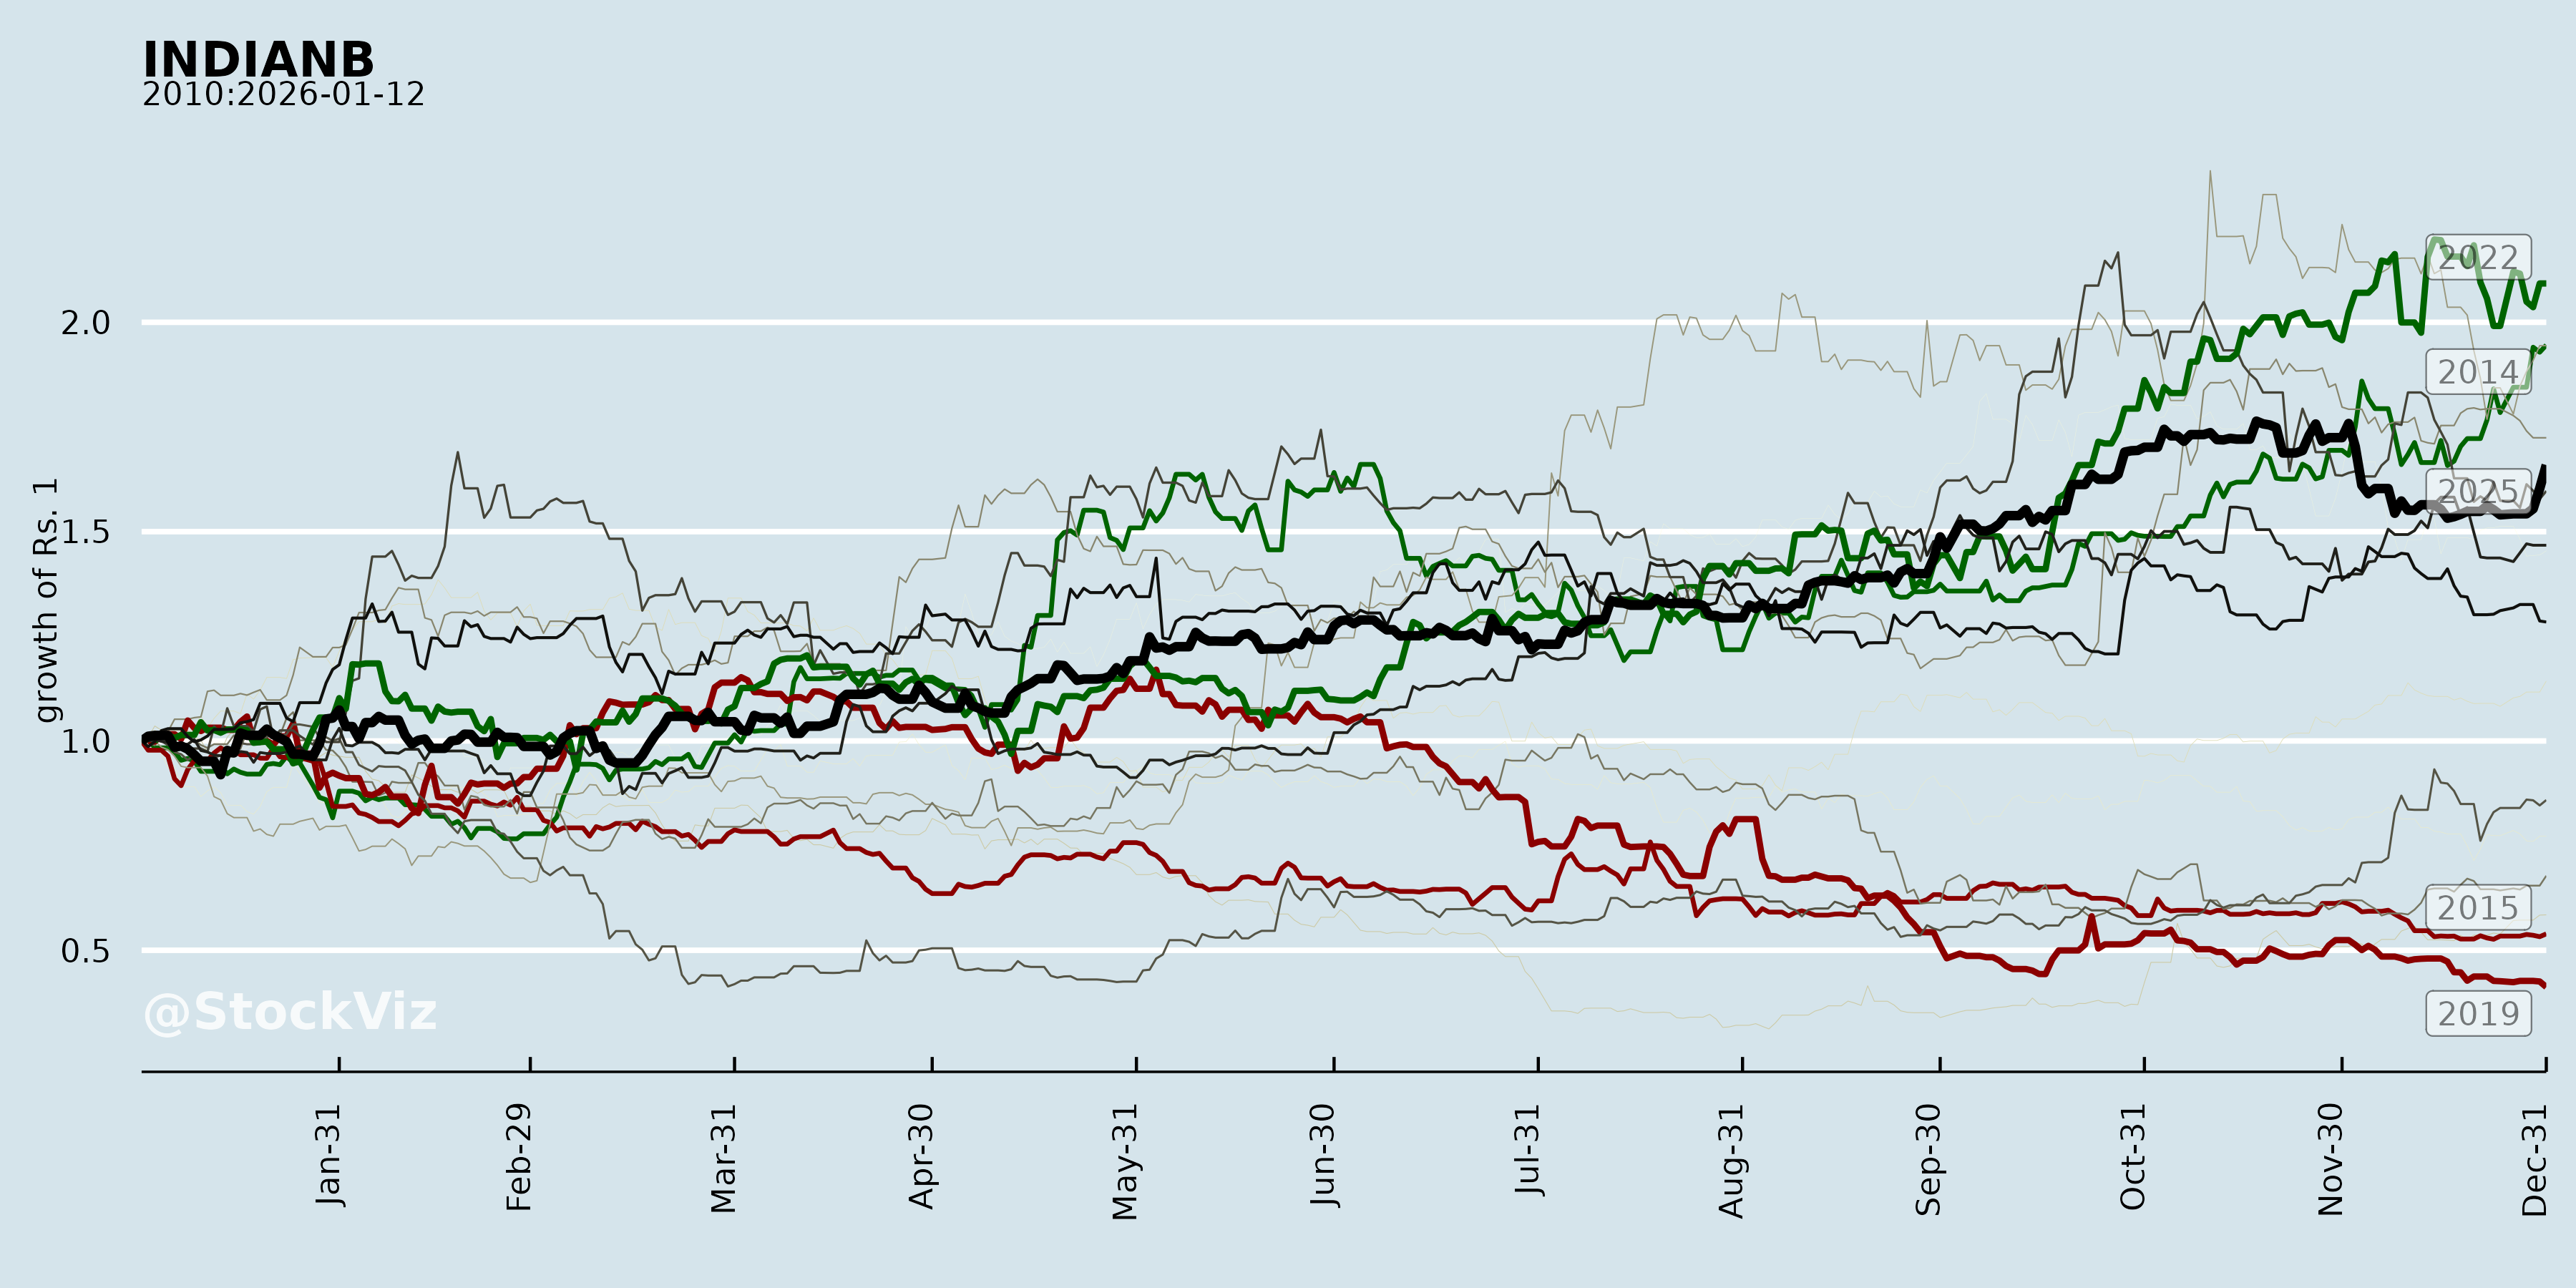
INDIANB
Equity Metrics
January 13, 2026
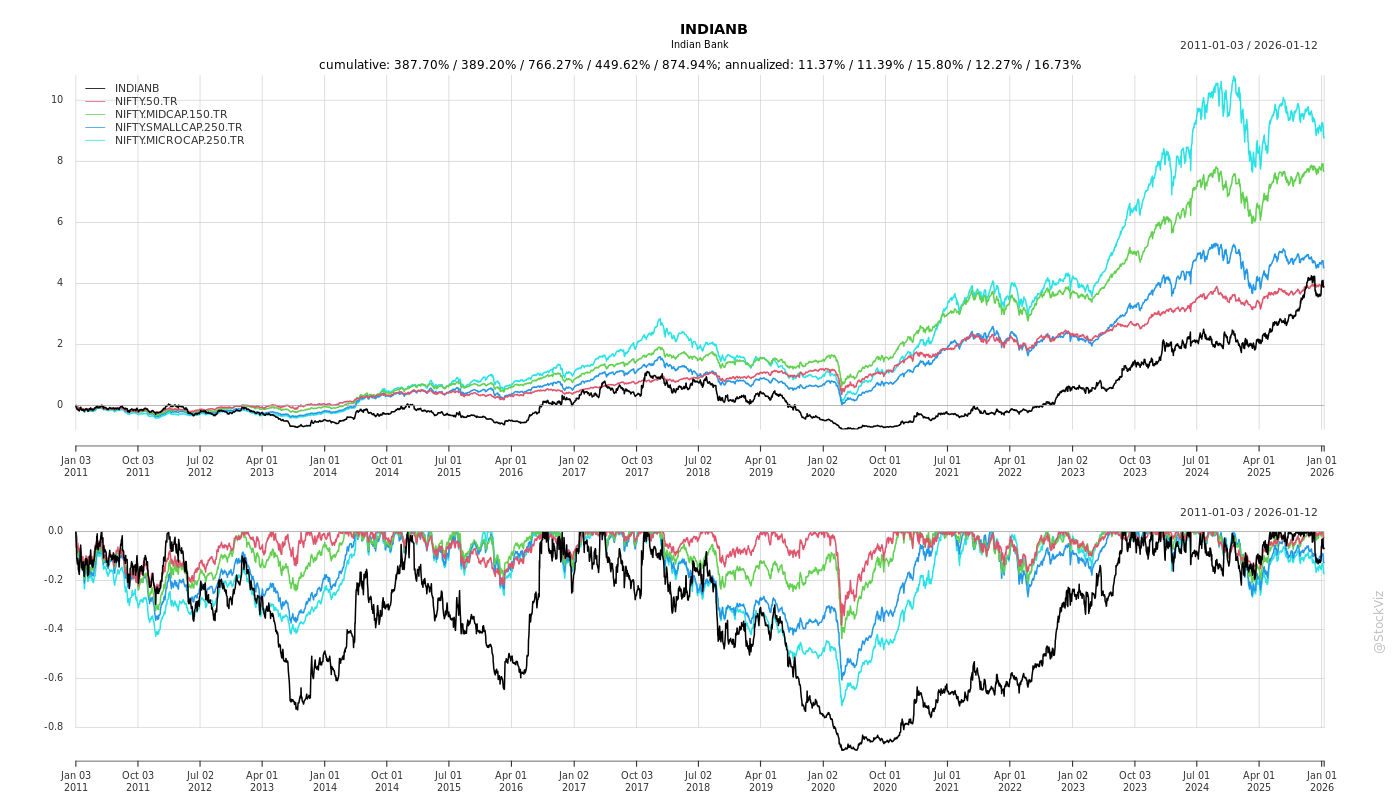
Indian Bank
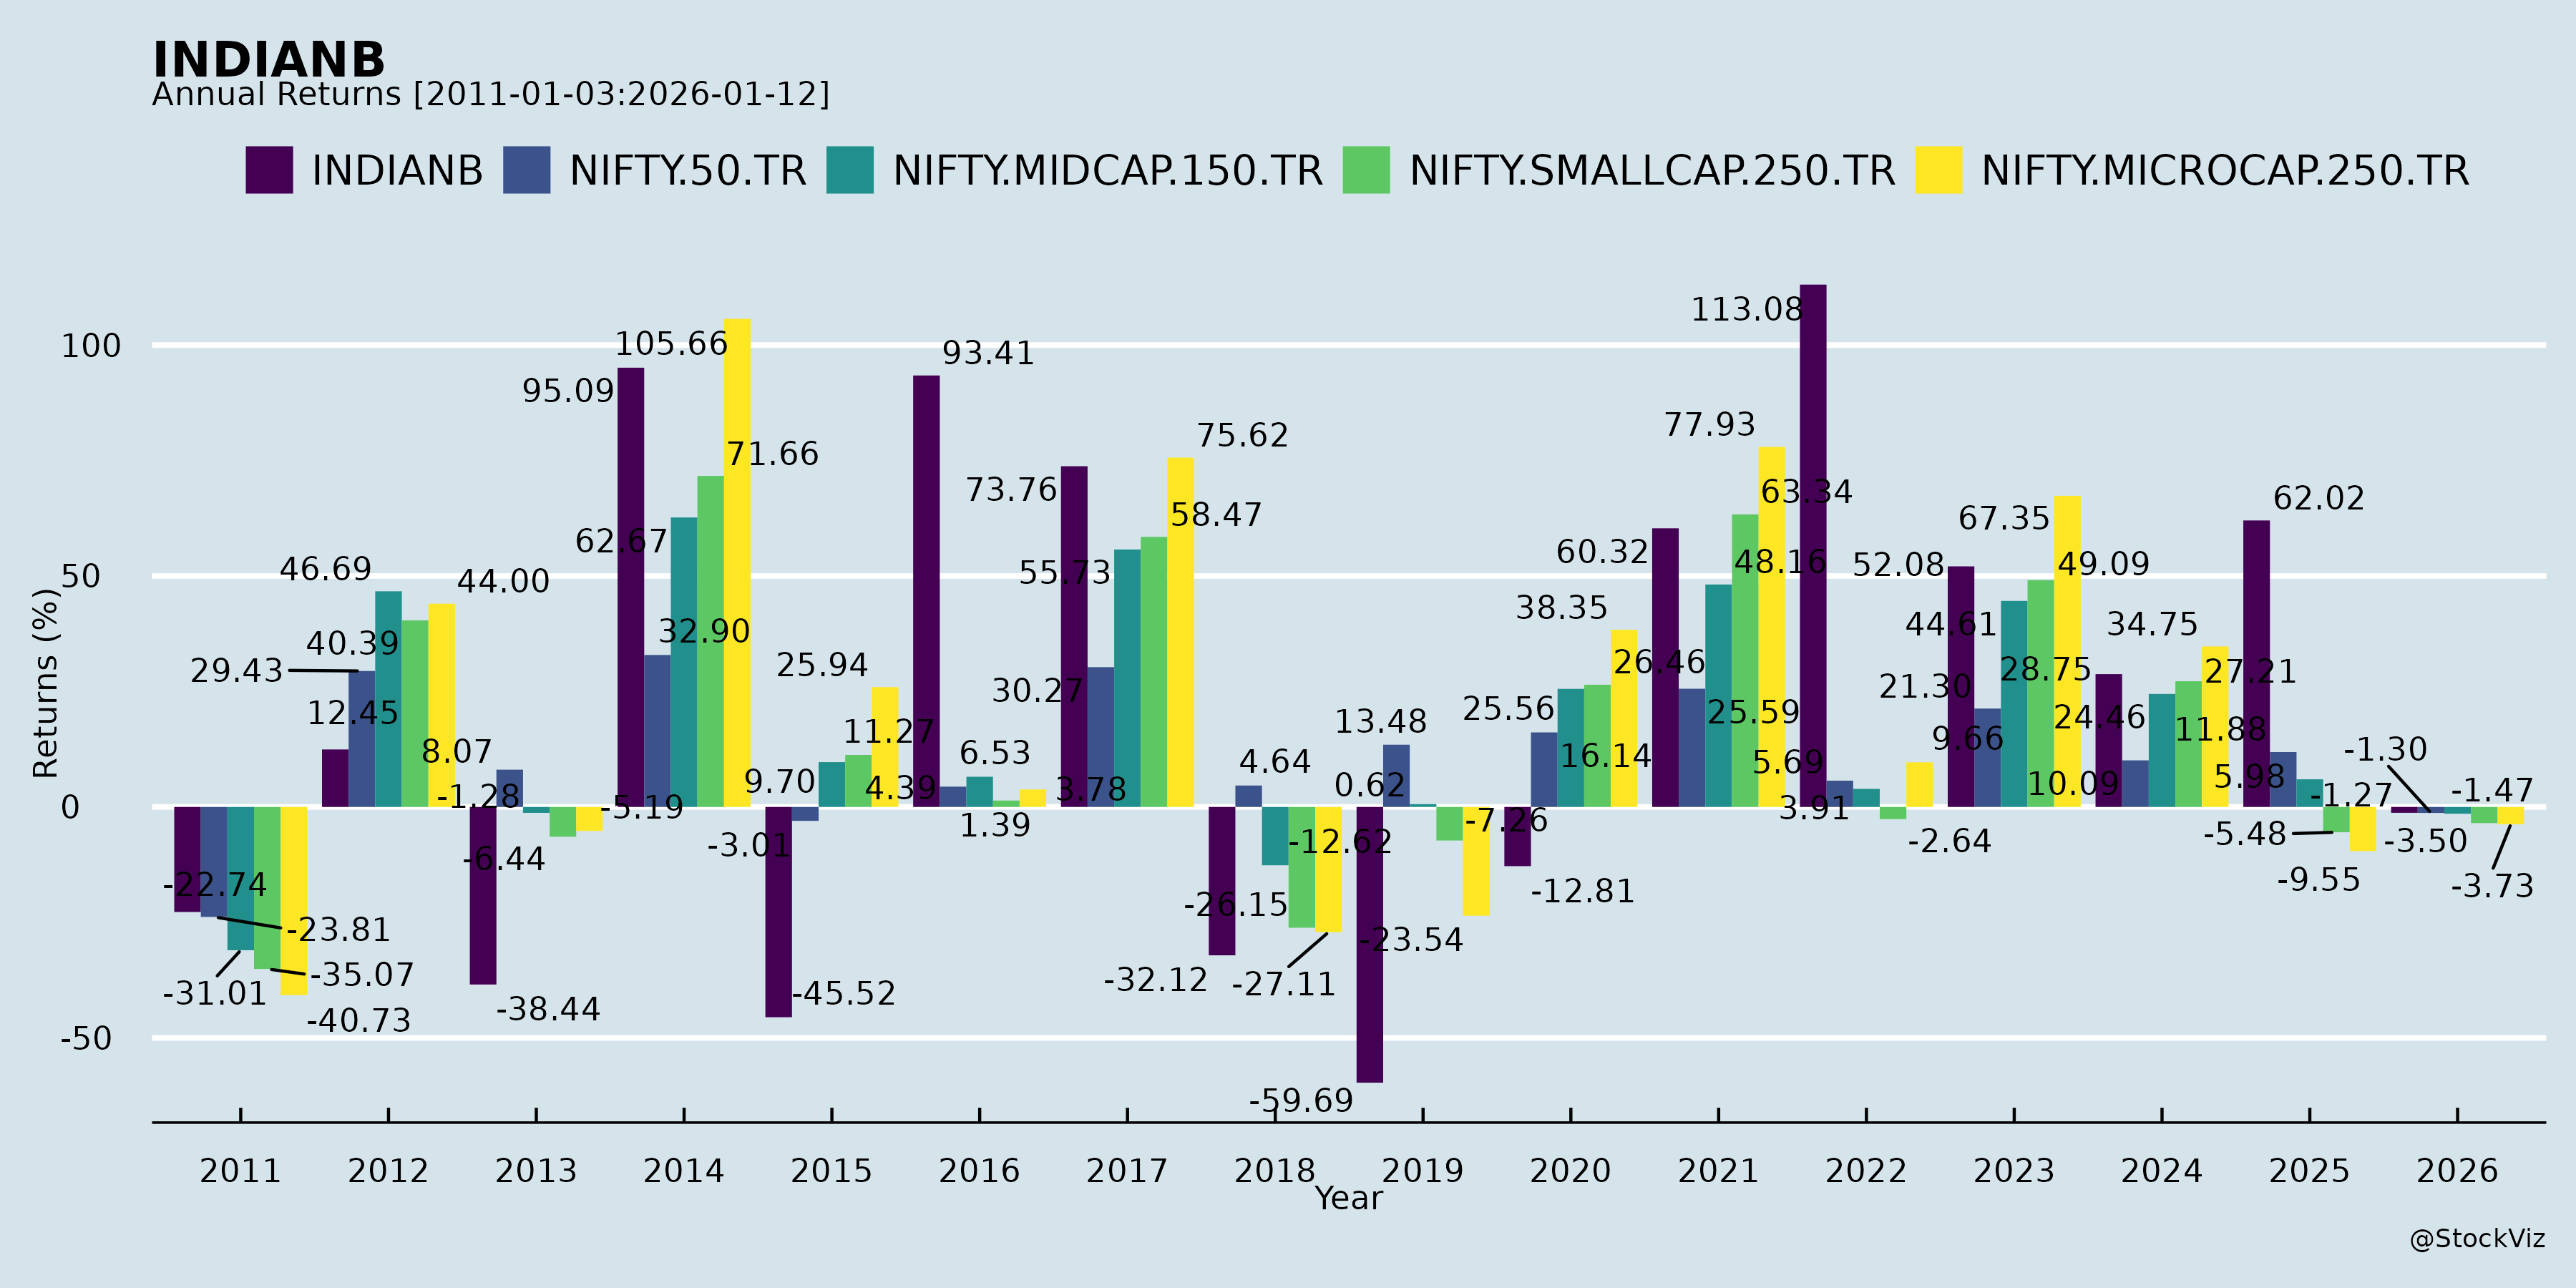
Annual Returns
Cumulative Returns and Drawdowns
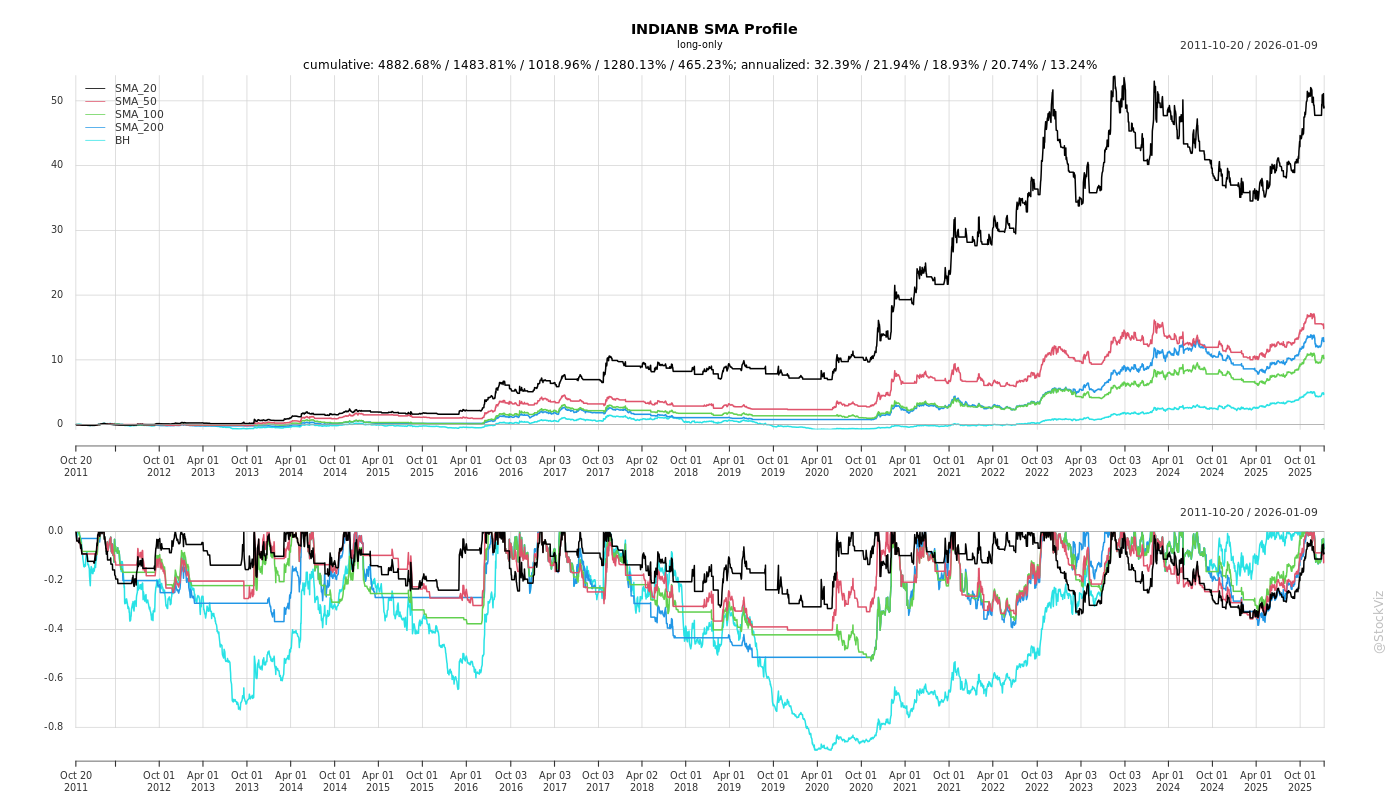
Fundamentals
Ownership
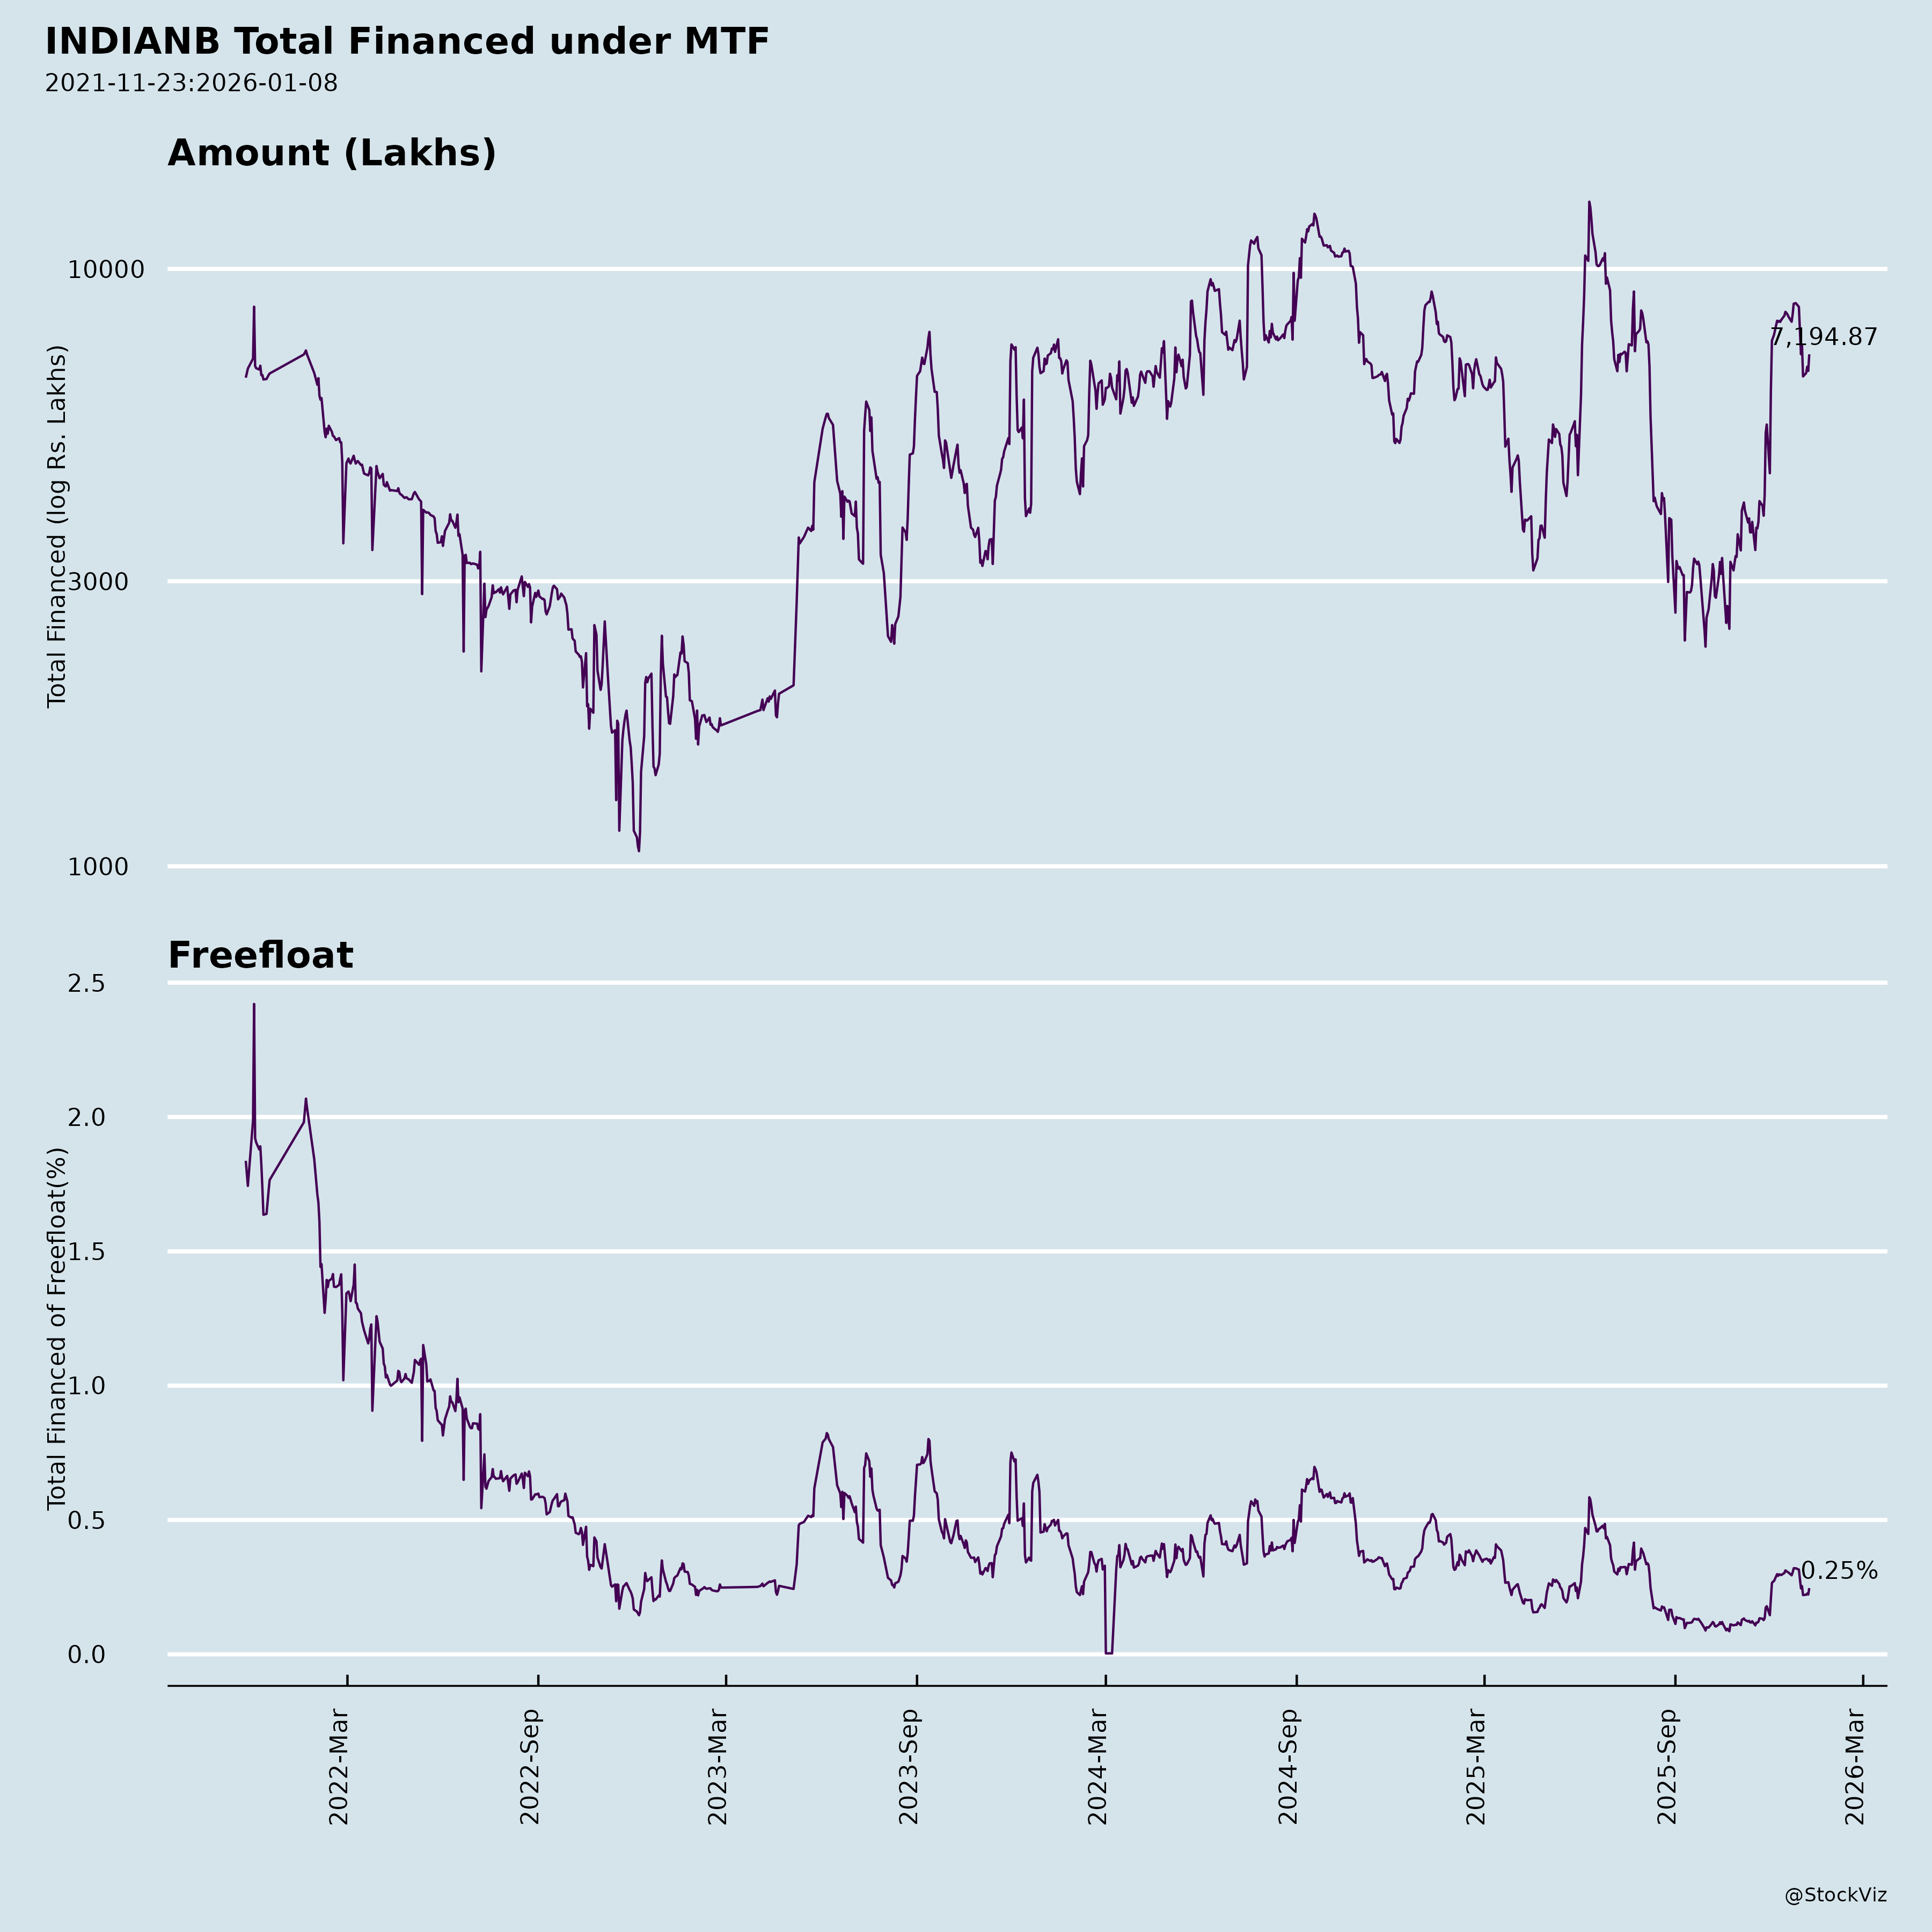
Margined
AI Summary
asof: 2025-12-08
Analysis of Indian Bank (INDIANB) – Q2 & H1 FY2025-26 Results, Business Developments & Market Position
Stock Symbol: INDIANB (NSE) | Scrip Code: 532814 (BSE)
Reporting Period: Quarter & Half-Year Ended September 30, 2025
Source: Investor Services Cell, Indian Bank – Unaudited Financial Results, Presentation, Press Release, and Subsequent Corporate Disclosures (Oct–Dec 2025)
📊 Summary
Indian Bank (INDIANB) has demonstrated strong financial performance in Q2 and H1 of FY2025-26 (Sep’25), supported by robust credit growth, improving asset quality, cost optimization, and digital transformation. The bank is strategically expanding its retail, agriculture, and MSME portfolio (RAM) while benefiting from a favorable interest rate environment and declining credit costs. Despite challenges in fee income and macroeconomic uncertainties, the bank is well-positioned for long-term sustainable growth.
✅ Tailwinds Driving Indian Bank (INDIANB)
1. Strong Business & Credit Growth
- Total Business (Deposits + Advances): ₹13.97 lakh Cr (+12.34% YoY)
- Advances Growth: ₹6.20 lakh Cr (+12.65% YoY)
- RAM (Retail, Agri, MSME) Advances: ₹3.76 lakh Cr (+15.57% YoY), forming 65.5% of domestic advances.
- Priority Sector Lending (PSL): 42.51% of ANBC (vs. regulatory 40%) — surpassing RBI target with strong growth in SHG, MUDRA, and PM Vishwakarma schemes.
🔹 RAM growth is outpacing overall advances, indicating a shift towards higher-risk-adjusted returns and financial inclusion.
2. Asset Quality Improving Rapidly
- GNPA: Improved to 2.60% (from 3.48% YoY and 3.01% QoQ) – a reduction of 88 bps YoY, 41 bps QoQ.
- NNPA: Down to 0.16% (from 0.27% YoY and 0.18% QoQ).
- Provision Coverage Ratio (PCR): Improved to 98.28% (including TWO), up 68 bps YoY.
- Slippage Ratio: Contained to 0.79% (vs. 1.06% YoY) — shows disciplined underwriting.
- Credit Cost: Annualized credit cost 0.26% in Q2 (vs. 0.65% YoY), indicating lower stress and provisioning burden.
🔹 Asset quality is among the best in PSB/peer group — reducing NPA drag on profitability.
3. Healthy Capitalization
- CRAR: 17.31% (well above regulatory requirement).
- CET1: 14.80% | Tier I Capital: 15.27%
- Balance sheet is fully funded to support future growth without immediate capital dilution.
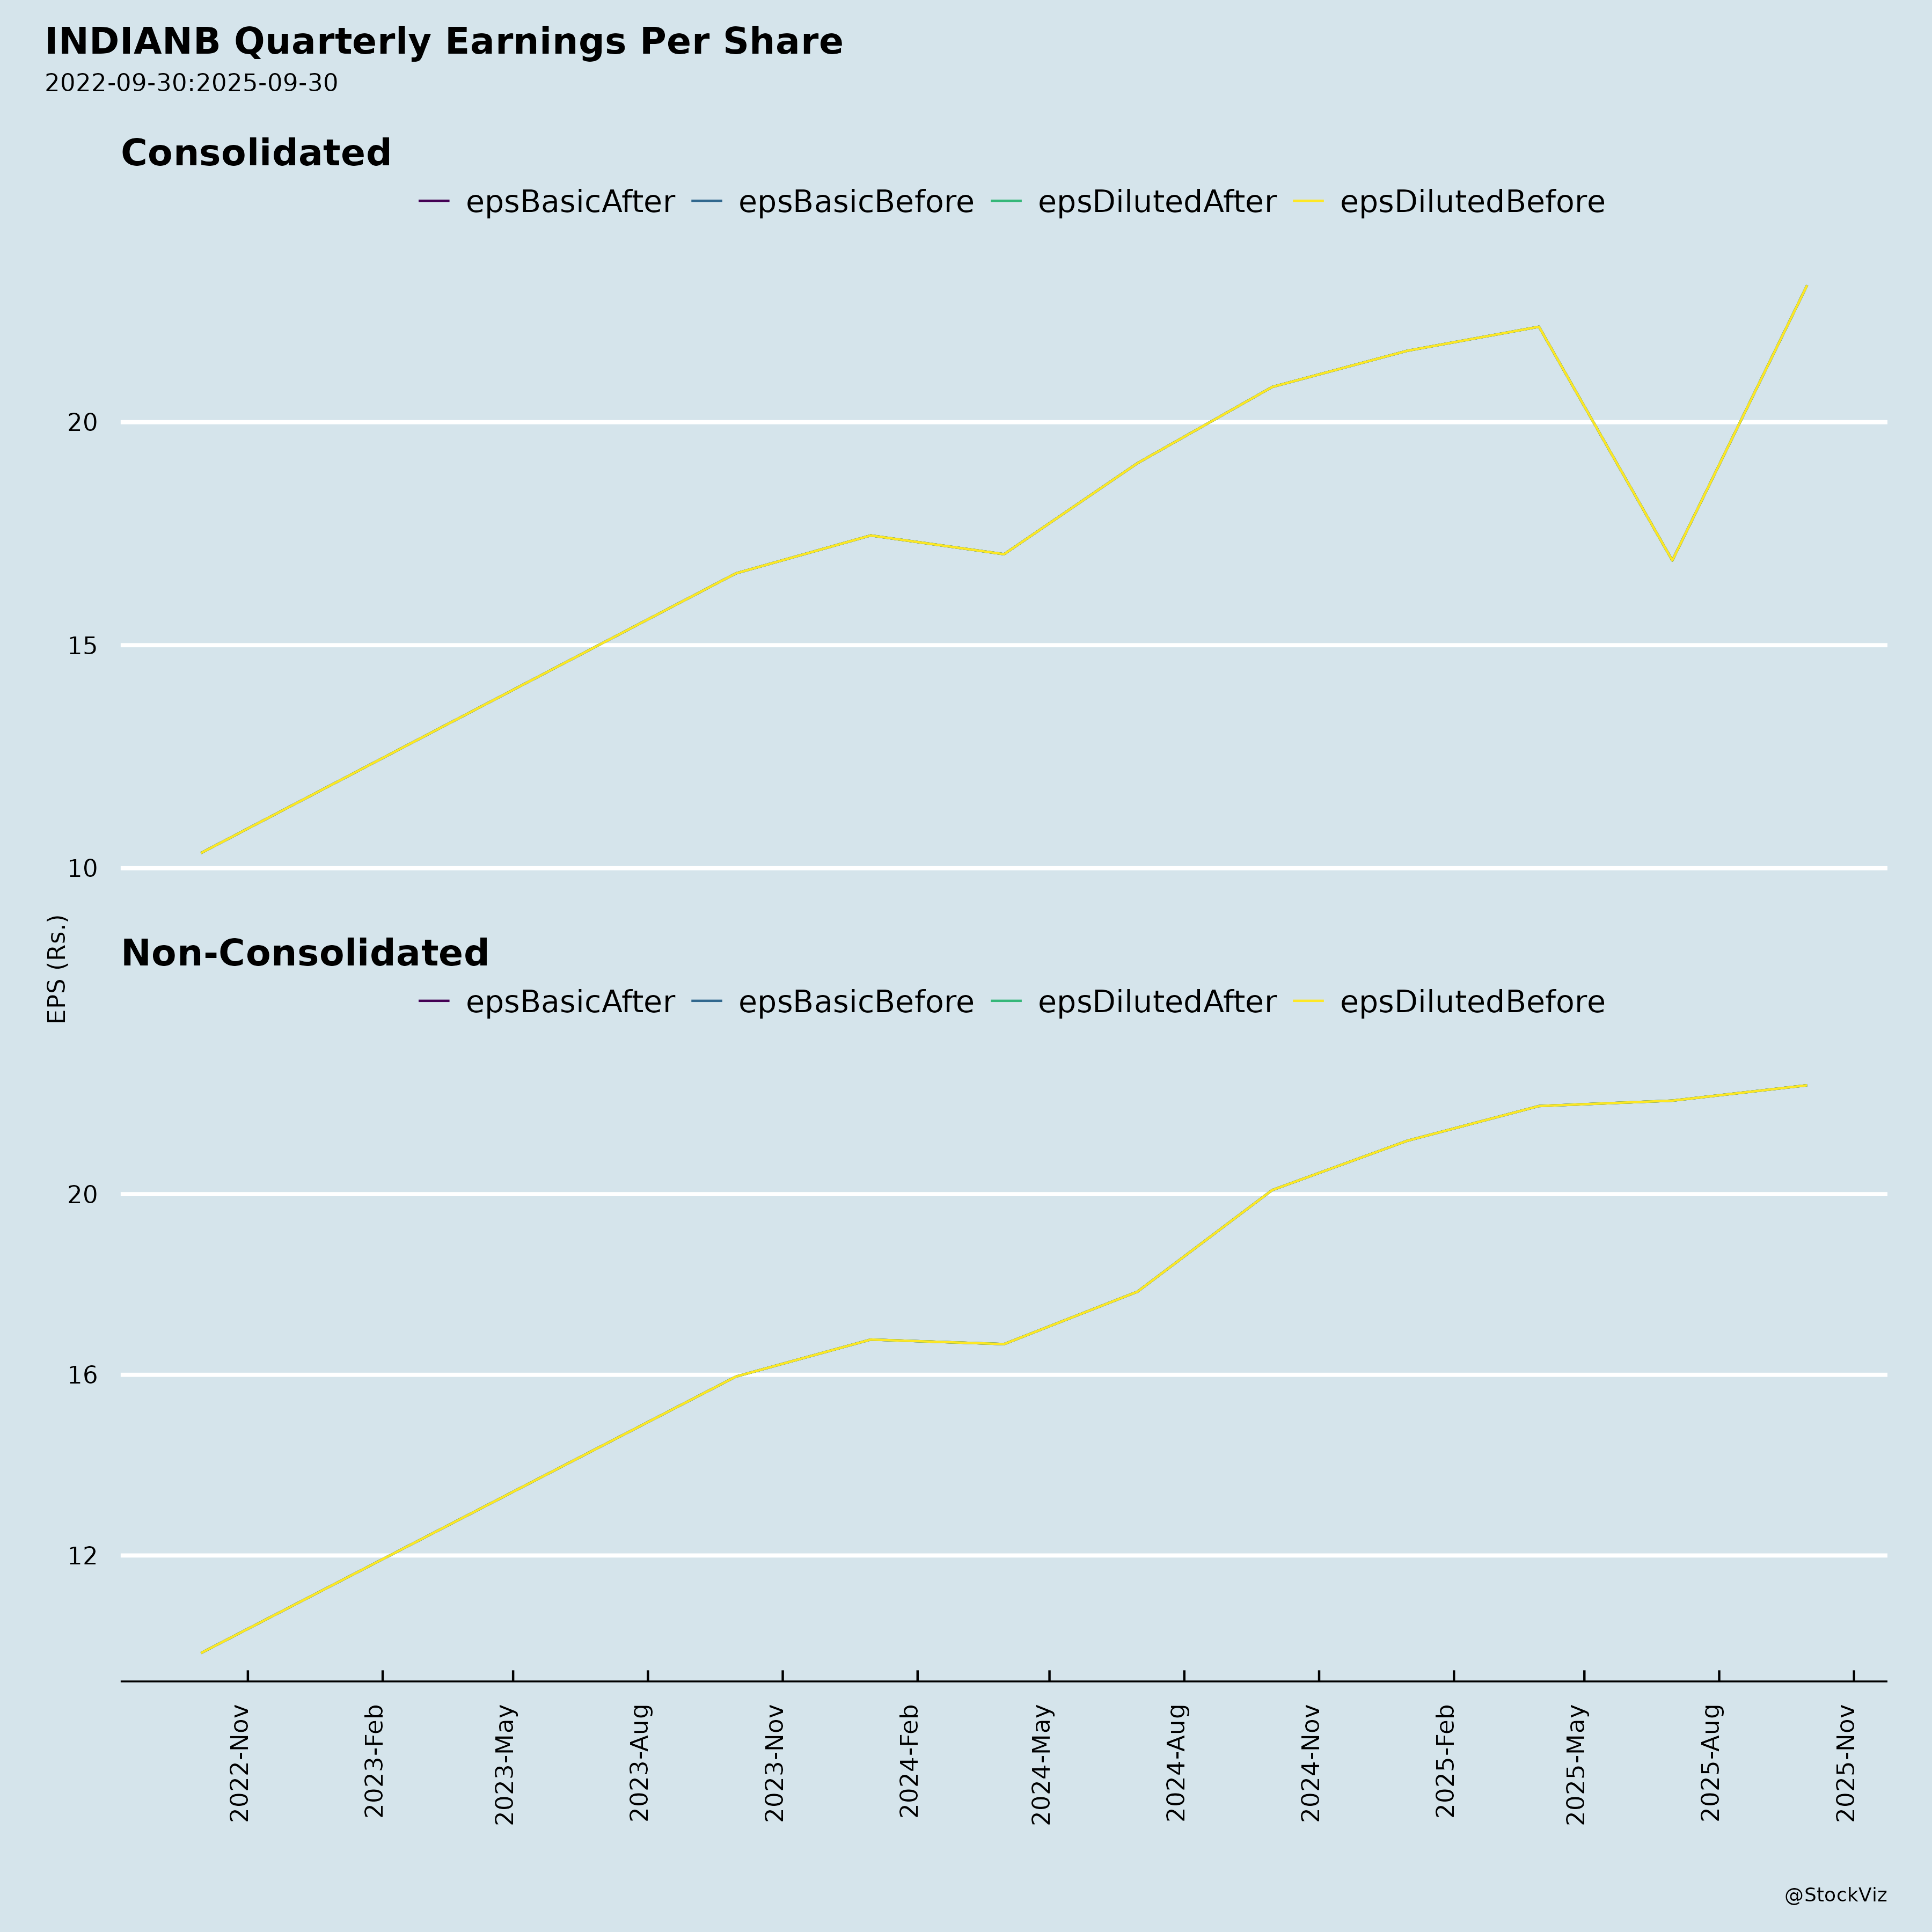
4. Profit Growth and Margin Stability
- Net Profit (Q2): ₹3,018 Cr (+11.49% YoY)
- H1 Net Profit: ₹5,991 Cr (+17.24% YoY)
- NIM (Domestic): Stable at 3.34% (QoQ) / 3.35% (H1) — though down slightly from YoY (3.51% H1 FY25).
- Return on Assets (RoA): 1.32% (Q2) | 1.33% (H1)
- Return on Equity (RoE): 19.58% (Q2), 19.93% (H1) — remains industry-leading among PSBs.
🔹 Strong RoE and RoA reflect efficient capital usage and disciplined cost management.
5. Digital Banking Momentum
- Digital Business (H1): ₹1.23 lakh Cr (+59% YoY)
- Digital Asset Growth:
- Digital vehicle loans: ~2.1x YoY
- Digital home loans: ~2.2x YoY
- Digital agri loans: ~1.6x YoY
- Digital MSME/jewel loans: 1.4x–1.6x growth
- Digital Adoption:
- Mobile users: 2.11 Cr (+17% YoY)
- UPI users: 2.41 Cr (+24% YoY)
- Net banking users: 1.17 Cr (+6% YoY)
🔹 Digital traction improves efficiency, lowers operating cost, and strengthens future scalability.
6. Financial Inclusion & ESG Focus
- PMJDY Accounts: 242 lakh | Balance ₹12,124 Cr
- SHG Loans: 5.06 lakh accounts | ₹22,901 Cr | 59 lakh women beneficiaries
- BC Network: 15,598 (Pan-India) covering rural/semi-urban areas
- Green Finance Exposure: ₹10,777 Cr
- Rural Development: 38 RSETI centers; Financial Literacy Camps in 42 centers
🔹 Supports PSB social mandates and enhances brand trust; potential for CSR-linked funding and sustainability-linked bonds.
7. Falling Cost of Funds & Improved Yield Management
- Cost of Deposits: Improved to 5.01% (from 5.13% YoY — down 12 bps)
- Yield on Advances: 8.40% (vs. 8.73% YoY — natural compression expected post-rate hike cycle)
- Despite rate cycle moderation, NIM held up well due to lower funding costs.
❗ Headwinds and Challenges
1. Declining Yield Environment
- Yield on Advances (YoA): Down to 8.40% from 8.77% YoY.
- NIM Compression: NIM (Domestic) down to 3.34% in Q2 from 3.51% in H1 FY25.
- With RBI likely to cut rates in CY2026, further margin pressure expected unless offset by:
- Faster loan growth in higher-yielding segments (retail, MSME)
- Continued cost of deposit improvement
📉 Key risk: Sustaining NIM amid falling interest rates and flattening yield curve.
2. Fee Income Under Pressure
- QoQ, Fee Income dropped: From ₹1,790 Cr in Jun’25 to ₹1,679 Cr in H1’26 (H1 level), despite marginal Q2 rebound to ₹830 Cr.
- Transaction fees fell sharply: ₹436 Cr (Jun’25) to ₹309 Cr (H1’26) due to lower volumes and waivers.
- Commission income from Govt business and LC/BG stable, but other streams volatile.
⚠️ Fee income is thin and sensitive to market activity. Limited diversification vs. private banks.
3. Intensifying Competition in Retail & MSME
- Major PSBs and private banks (SBI, HDFC, ICICI) are aggressively targeting RAM segment.
- Digital platforms like VBX and fintech partnerships (168 fintechs listed) help, but scalability and unit economics need to be proven.
4. Public Sector Constraints
- Despite autonomy, PSB status limits agility in hiring, compensation, and decision-making.
- Ongoing focus on HR development and training (IIM-Ahmedabad leadership, AI training) is positive but structural constraints persist.
📈 Growth Prospects
| Segment | Opportunity |
|---|---|
| Retail Lending | Home, auto, personal, jewel loans growing rapidly via digital channels. Home loans up 12.68% YoY, Auto 45.74%, Jewel 114%. |
| Agriculture | Strong momentum in crop loans (16% YoY). Digital tractor loans (₹27 Cr, 409 units). |
| MSME | 14.1% YoY growth. Digital MSME lending expanding. |
| PM & Govt Schemes | Active in MUDRA, PM SVANidhi, Viswakarma — ₹887 Cr disbursements (6.46 lakh beneficiaries). |
| NPA Resolution via NARCL/IDRCL | Invested ₹272.25 Cr in NARCL — helps clean balance sheet. Currently 18 accounts under NARCL process. |
⚠️ Key Risks
| Risk | Impact | Mitigation Observed |
|---|---|---|
| Interest Rate Cuts (2026) | NIM compression | Lower cost of deposits (5.01%), better asset-liability management |
| Macro Slowdown / Rural Stress | Agriculture/MSME slippages | Strong PCR, low slippages, improved monitoring |
| Competition in Digital Banking | Erosion of market share | Dedicated digital platform (VBX), fintech alliances, 132 digital journeys |
| Execution Risk in Digital Expansion | High cost, adoption delays | Pilot-driven scalable initiatives; partnerships with fintechs |
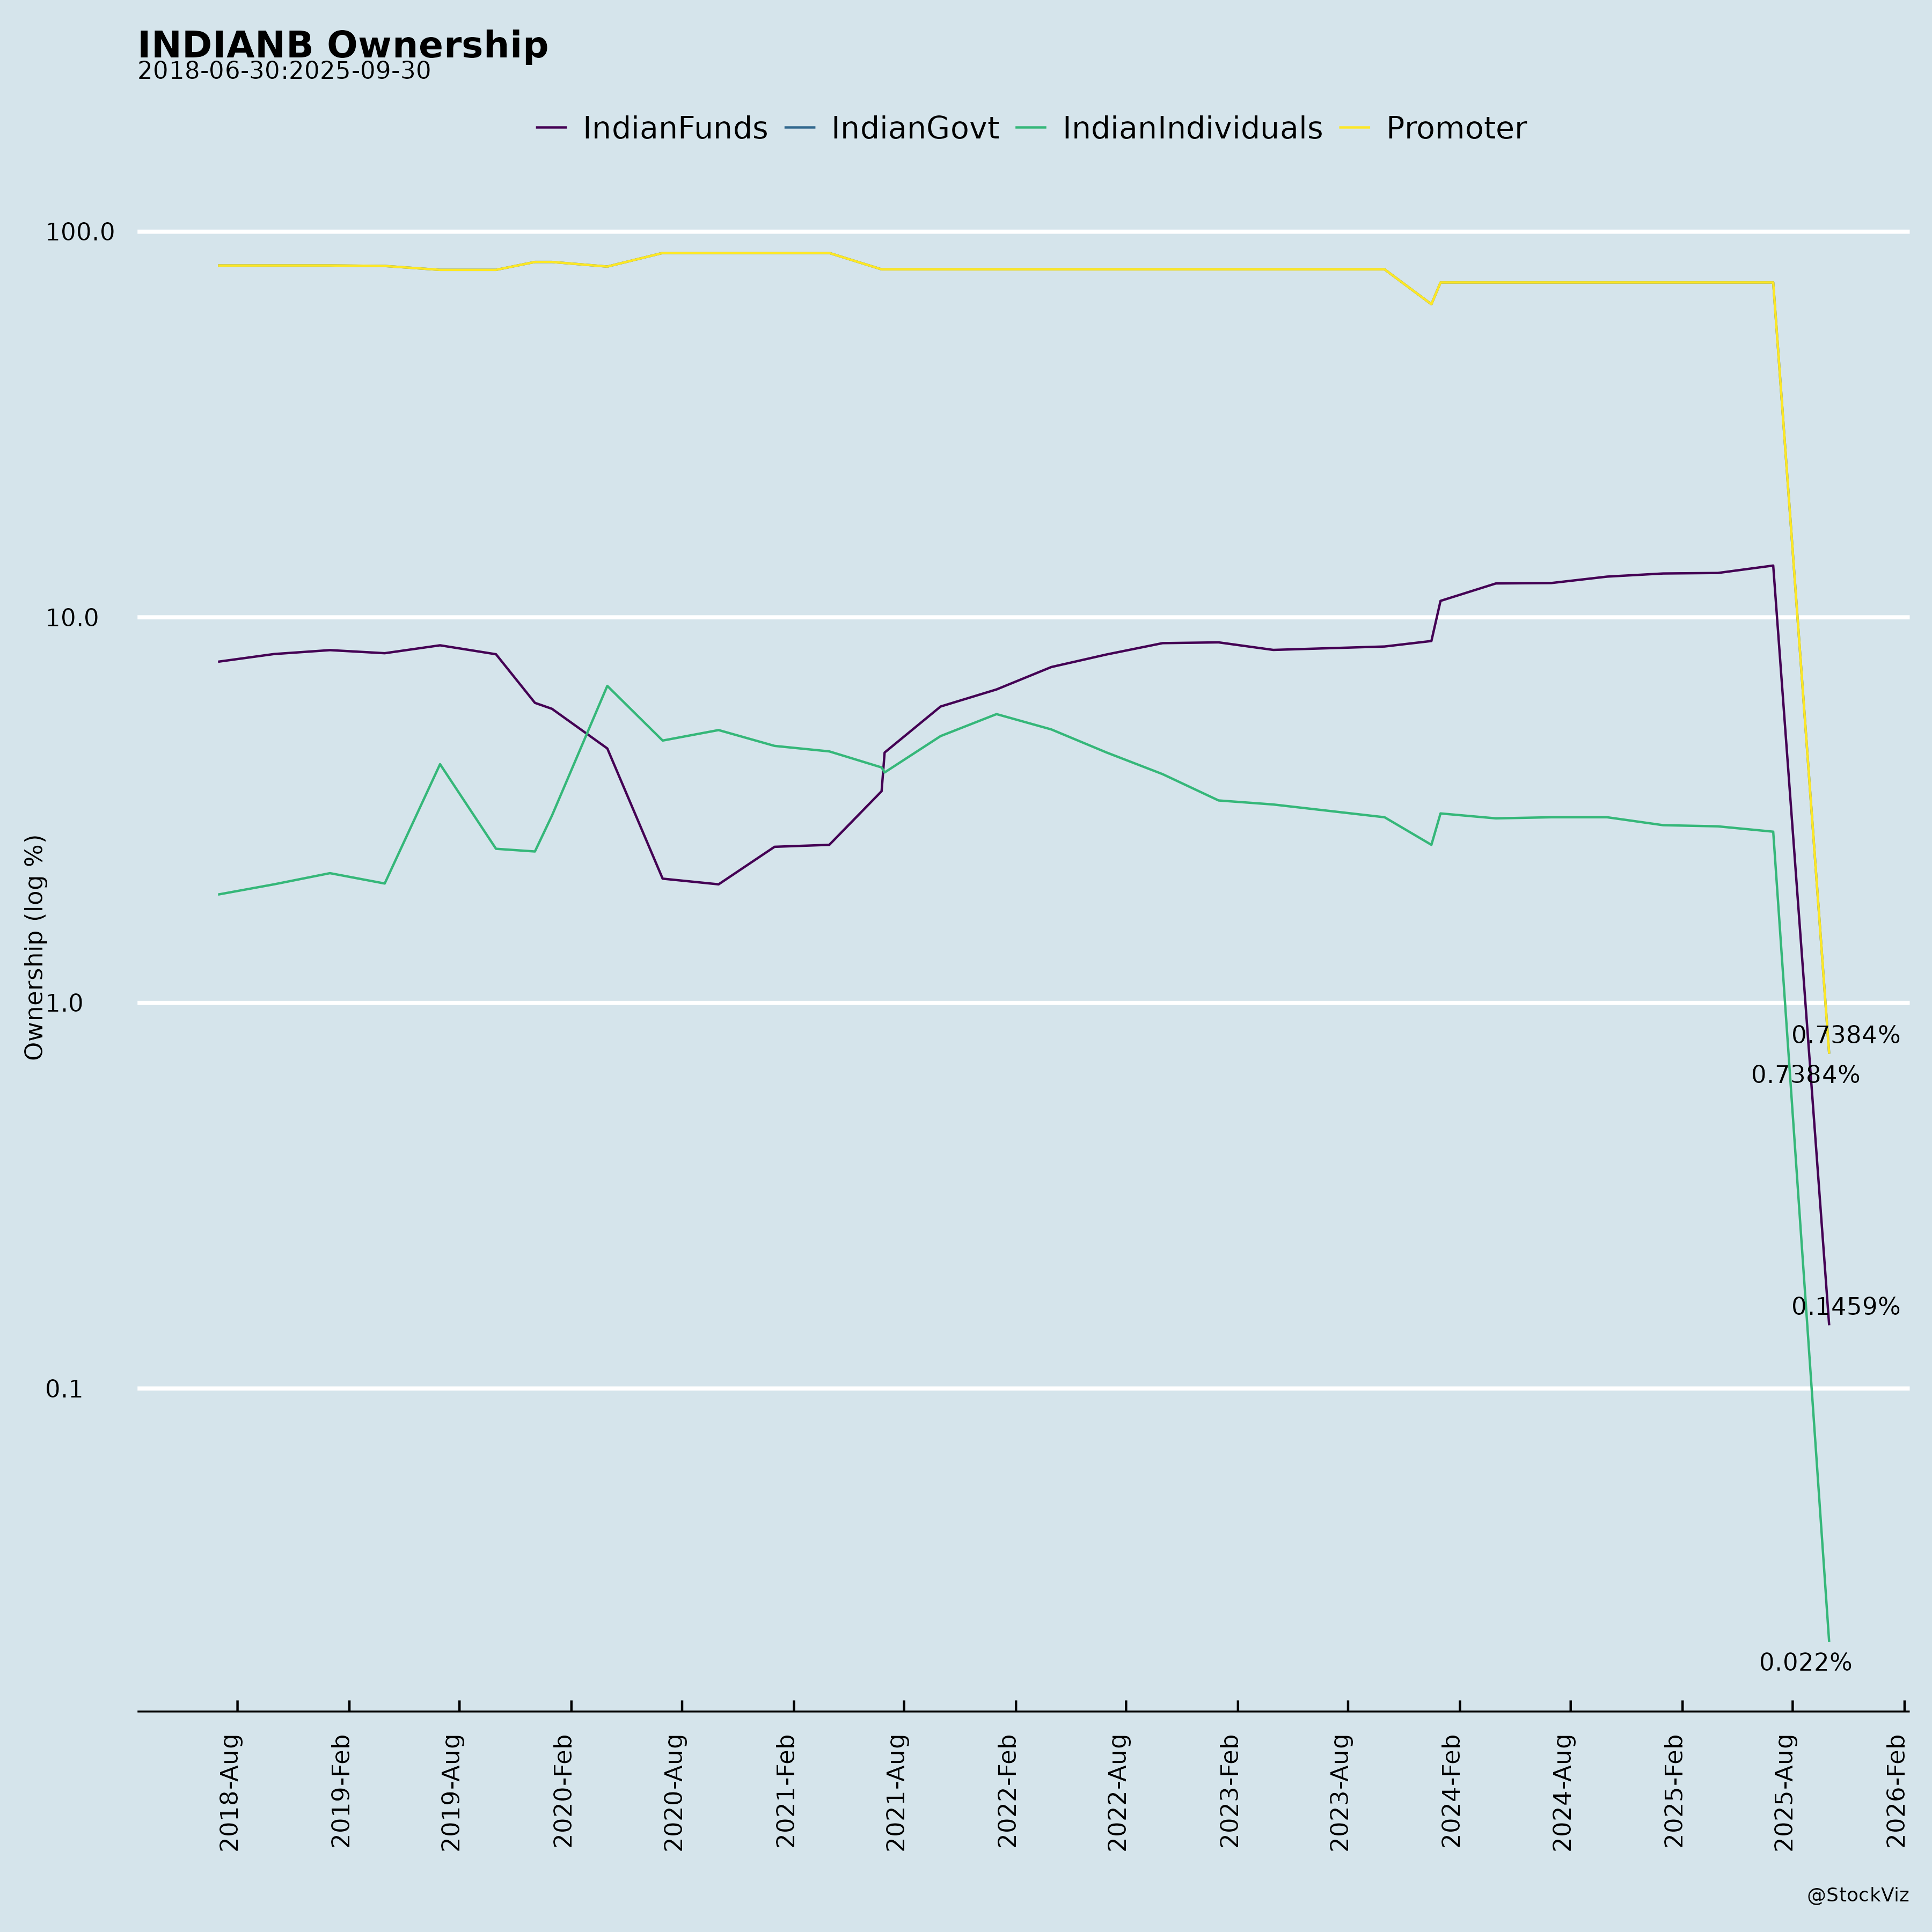
| Regulatory & Policy Risks | PSB capital infusion delays, NPA norms | High CRAR, proactive provisioning, strong government ownership (73.84%) |
🔔 Strategic & Regulatory Updates (Recent)
- Revision in Repo Benchmark Rates (Dec 2025):
- Policy Repo ↓25 bps to 5.25%
- RBLR reduced to 7.95% (from 8.20%) effective 06.12.2025.
- Benefit: Lower lending rates support retail/MSME demand.
- Appointment of Ms. Mini T M as Executive Director (Dec 2025):
- Positive signal on leadership expansion and governance.
- EGM Scheduled (Jan 2026):
- To elect shareholder director — enhances corporate governance transparency.
- Investor Meetings (Nov 2025):
- Engaged with top mutual funds (Quant, Kotak, Mirae) — reflects investor interest.
- Awards & Recognition (45/47):
- Rajbhasha Kirti Award 2025, VMware Cloud Leader India 2025, DSIJ CFO Award.
- Demonstrates excellence in governance, tech, and finance.
💡 Conclusion: Investment Outlook for INDIANB
Position vs. Peers (PSBs):
| Parameter | Indian Bank | Industry Avg (PSB) |
|---|---|---|
| RoE | ~20% | ~16–18% |
| GNPA | 2.60% | ~3.5–4.0% |
| NIM (Domestic) | 3.34% | ~3.0–3.2% |
| RAM Penetration | 65.5% | ~50–55% |
| Digital Business Growth | ~59% YoY | ~40–50% |
✅ Indian Bank is emerging as a top-tier PSB with above-average efficiency, asset quality, and growth.
🔍 Bottom Line: BUY / HOLD with Strong Growth Tailwinds, but Monitor Margins
- Strengths: High RoE, growing RAM, best-in-class asset quality, strong digital pivot, government backing.
- Challenges: NIM pressure in rate-cut cycle, low fee income, PSB operational constraints.
- Catalysts: Sustained retail growth, digital adoption, further NPA recovery, potential re-rating due to governance and performance.
✅ Recommendation Summary
| Factor | Rating | Comment |
|---|---|---|
| Growth Prospects | ⭐⭐⭐⭐☆ | Strong credit growth in key segments |
| Asset Quality | ⭐⭐⭐⭐⭐ | Exceptional GNPA/NNPA/PCR |
| Profitability | ⭐⭐⭐⭐☆ | High RoE, stable RoA, manageable NIM |
| Digital & Innovation | ⭐⭐⭐⭐☆ | Rapid traction, fintech & cloud partners |
| Risks | ⭐⭐⭐☆☆ | Mainly macro & NIM; manageable |
| Overall Outlook | POSITIVE ✅ | Best-in-class PSB with long-term re-rating potential |
📌 Final View:
Indian Bank (INDIANB) is transforming from a traditional PSB into a modern, digitally-driven, and high-performing public sector lender. With strong fundamentals, proactive asset quality management, and digital acceleration, it offers compelling value for investors seeking sustainable growth and yield in the PSB space. However, margin pressure in a falling rate cycle remains a key watch item.
🏁 Recommendation: BUY (Long-Term) | Target: Re-rate towards private bank multiples given performance divergence.
Copyright © 2023 SAS Data Analytics Pvt. Ltd. All rights reserved.