IDFCFIRSTB
Equity Metrics
September 24, 2026
IDFC First Bank Limited
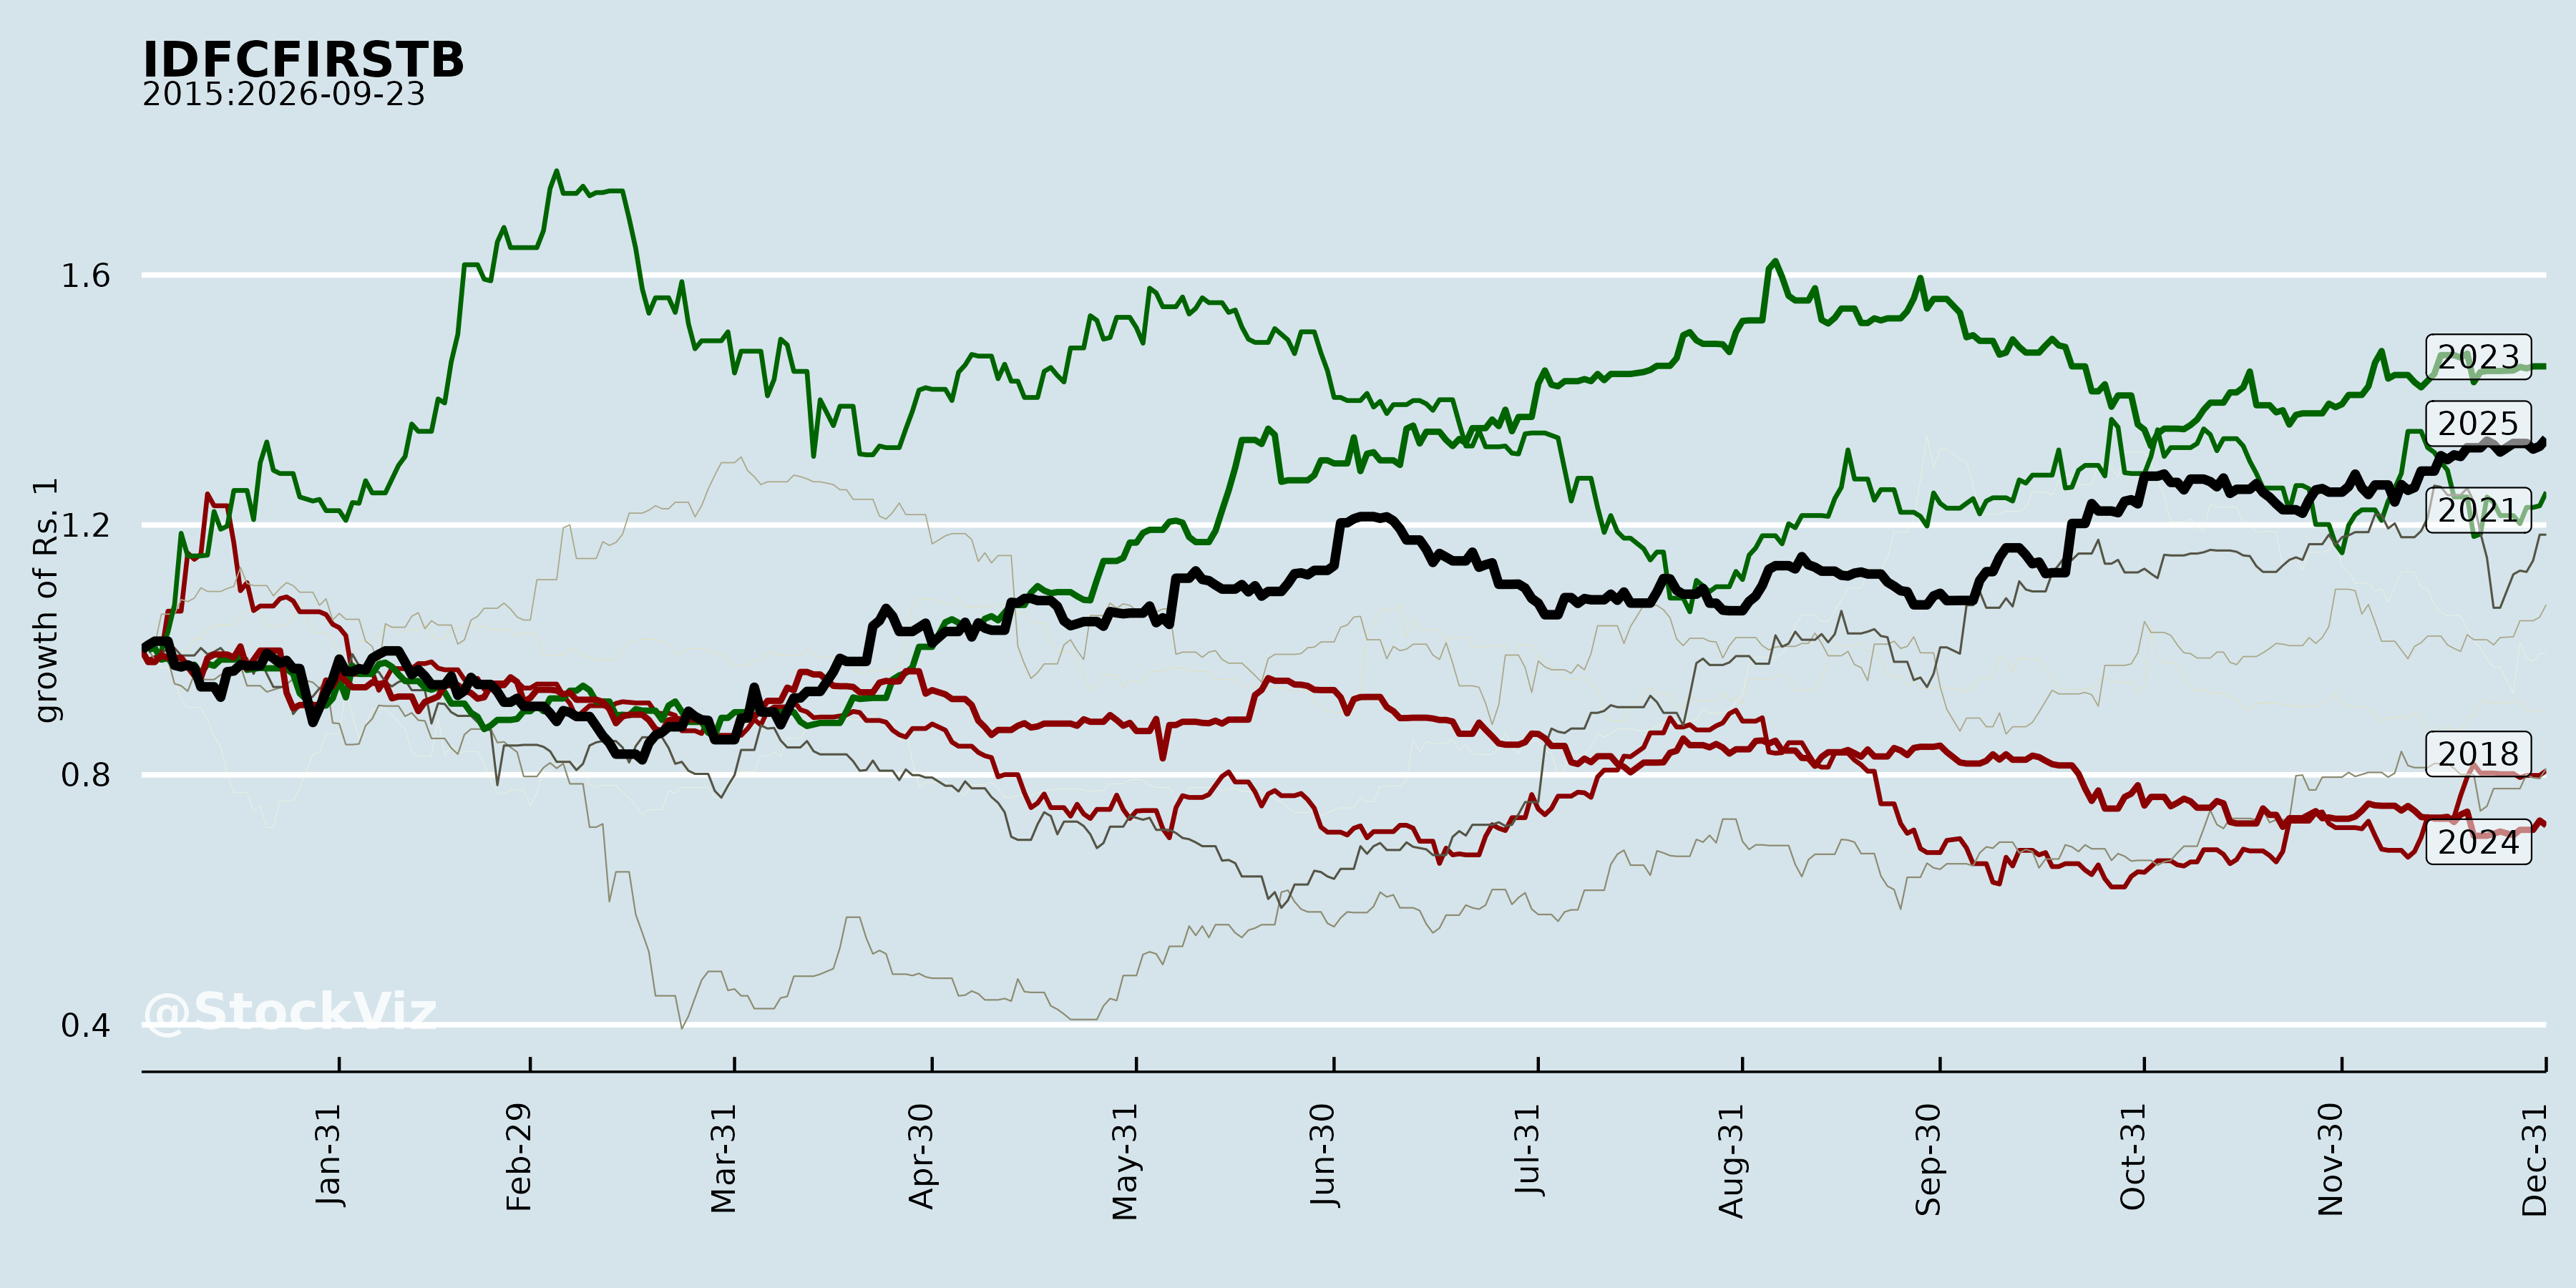
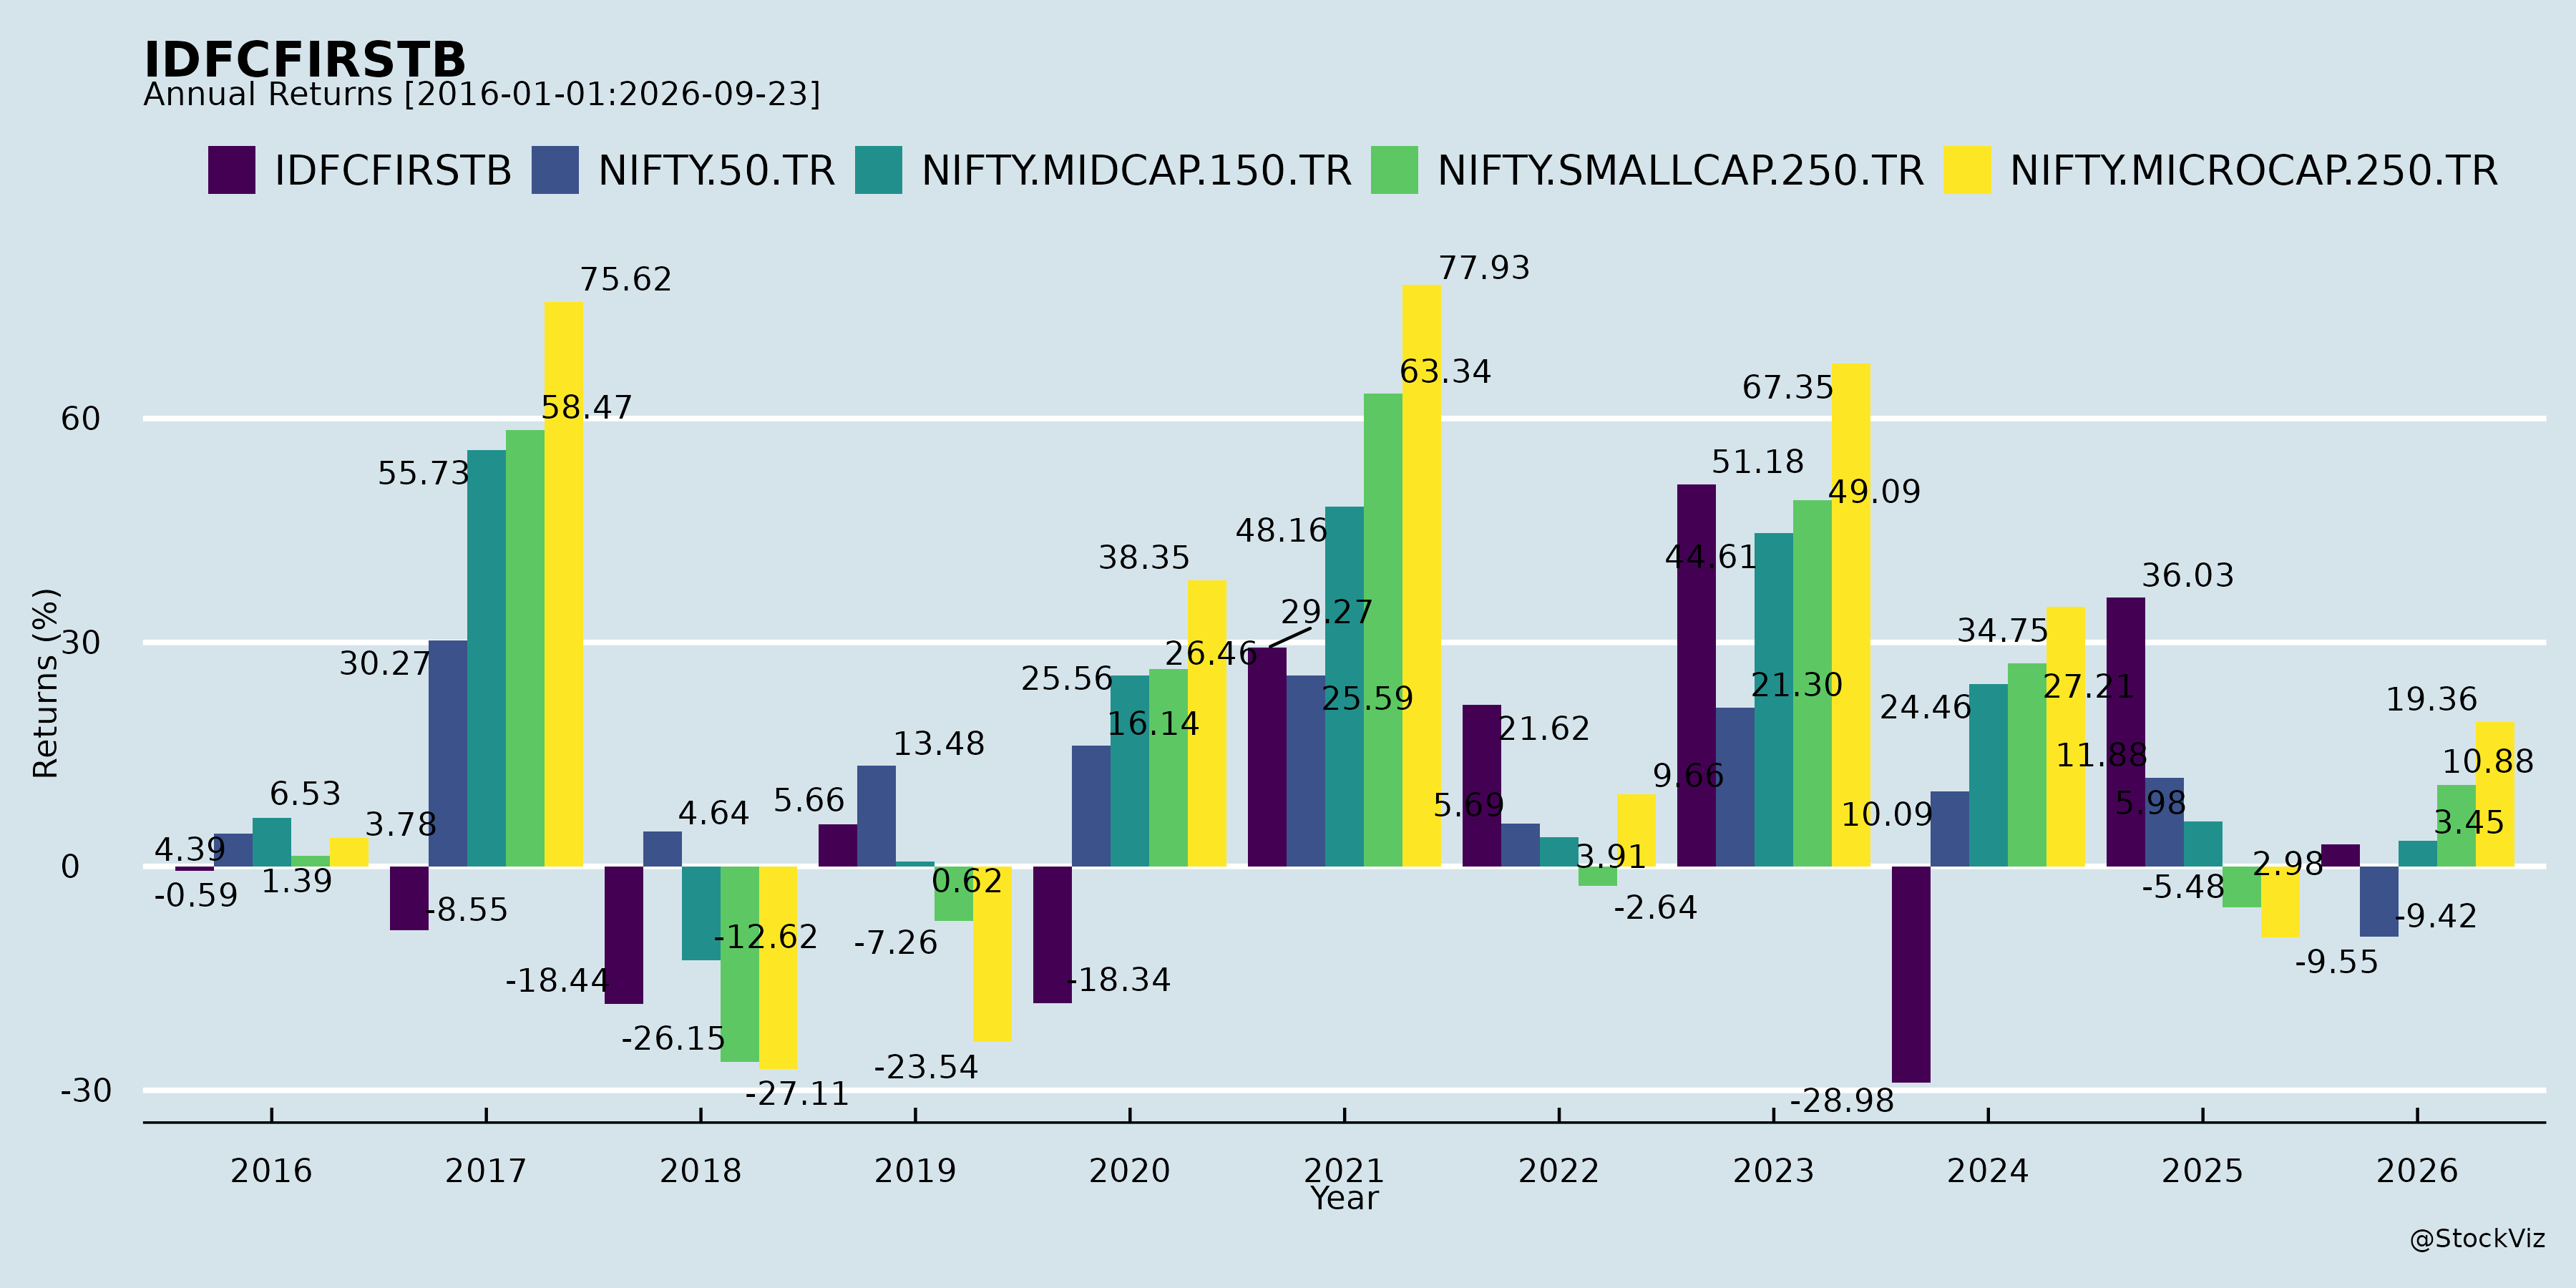
Annual Returns
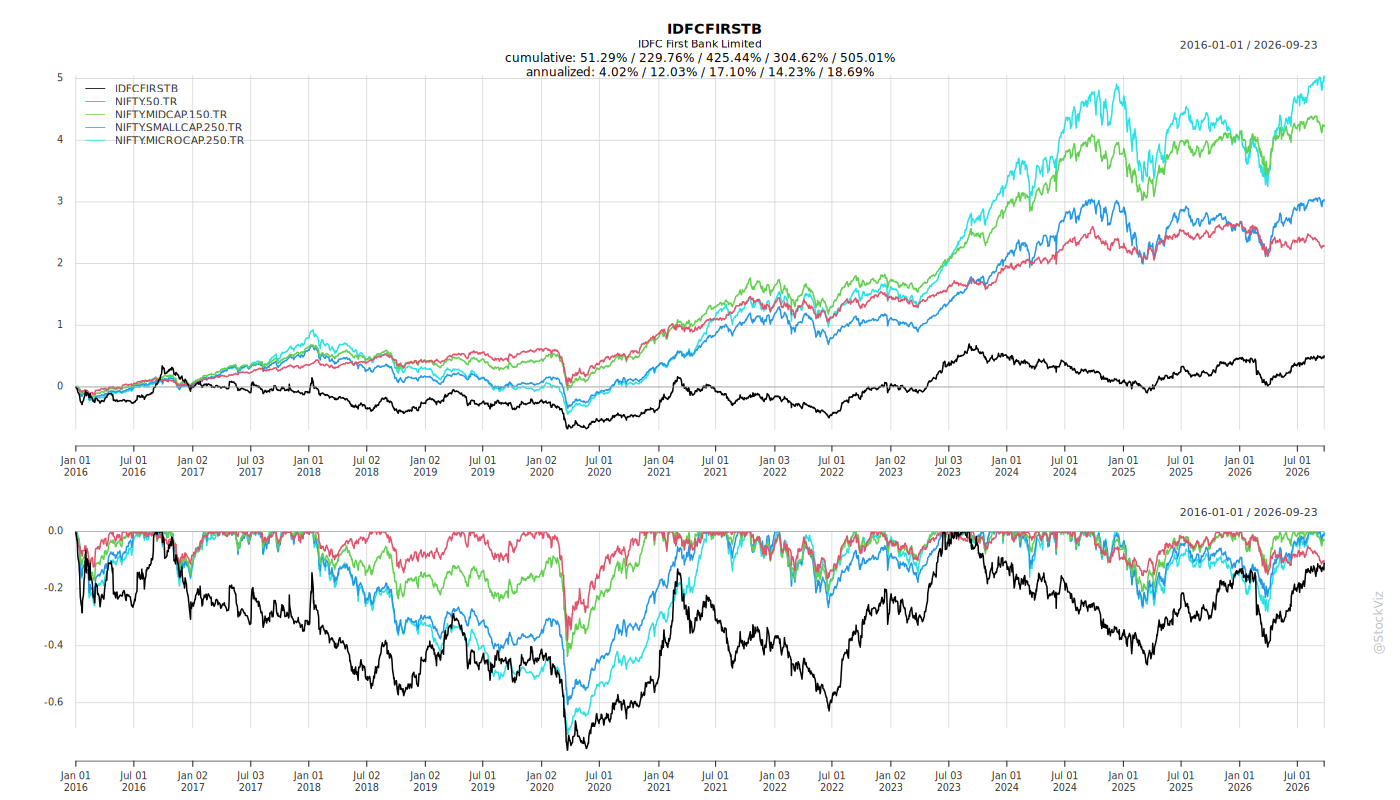
Cumulative Returns and Drawdowns
Fundamentals
Ownership
Margined
AI Summary
asof: 2026-09-16
IDFC FIRST Bank — Q1 FY27 Developments
1. Headwinds and Challenges
- Microfinance (MFI) drag on income and operating leverage. Management notes that the cost-to-income ratio got “stuck” at around 72.5%–73.5% in FY25 and FY26 because income fell as the MFI book was shrunk. The MFI book stood at ₹6,700 crore at June 2026 end, with only a marginal increase over the previous quarter. MFI headwinds and the broader MFI crisis in India are cited as having impacted income and operating leverage.
- Cost-to-income ratio still elevated. The ratio (excluding trading gains) was 70.7% in Q1 FY27. Management acknowledges it got the cost-income fix wrong in its original five-year plan and that it has taken seven years and is still being addressed. Building the bank has involved heavy compliance, ticketing, CRM and other setup costs.
- PSL shortfall and negative carry. The bank is still not originating its entire PSL organically and is a net buyer of PSLCs, losing money on PSL purchases — about ₹250 crore last year. Management expects to remain short and to keep buying, though it aims to build more organically.
- Margin pressure from asset mix. Corporate banking NIM is lower than retail, so continued corporate book growth (wholesale grew 30.4% YoY) has a dilutive effect on overall NIM. Management expects margins to be around 5.8% for the year, implying some quarter-on-quarter contraction from the 5.9% adjusted level.
- Macro and geopolitical uncertainty. A contingency provision of ₹515 crore was created on a prudent basis for evolving macroeconomic and geopolitical uncertainties, monsoon-related factors, and fuel price volatility. Management also flagged caution on macro factors that could play out.
- Fraud incident aftermath. The Q4 FY26 fraud incident affected opex comparatives. Recovery is subject to a legal/court process (PMLA court, claim filing, assessment), with no timeline committed and nothing booked in the Q1 P&L. A few more arrests have been made and the ED has filed a charge sheet indicating a potential recovery amount.
- Regulatory/ECL transition. Final ECL guidelines have arrived; the bank is fine-tuning numbers. On transition, more capital must be set aside for ECL, though this may be offset by reduced RWA on credit and operational risk, making the capital impact broadly neutral.
- Governance and tenure transitions. Mr. Pravir Vohra ceased to be an Independent Director effective close of business July 31, 2026, on completion of his second term and maximum permissible tenure. Mr. Nilesh Doshi ceased as Chief Vigilance Officer on August 16, 2026, on completion of the maximum five-year tenure, with Mr. Anurag Mishra elevated as CVO effective August 17, 2026.
2. Tailwinds and Growth Prospects
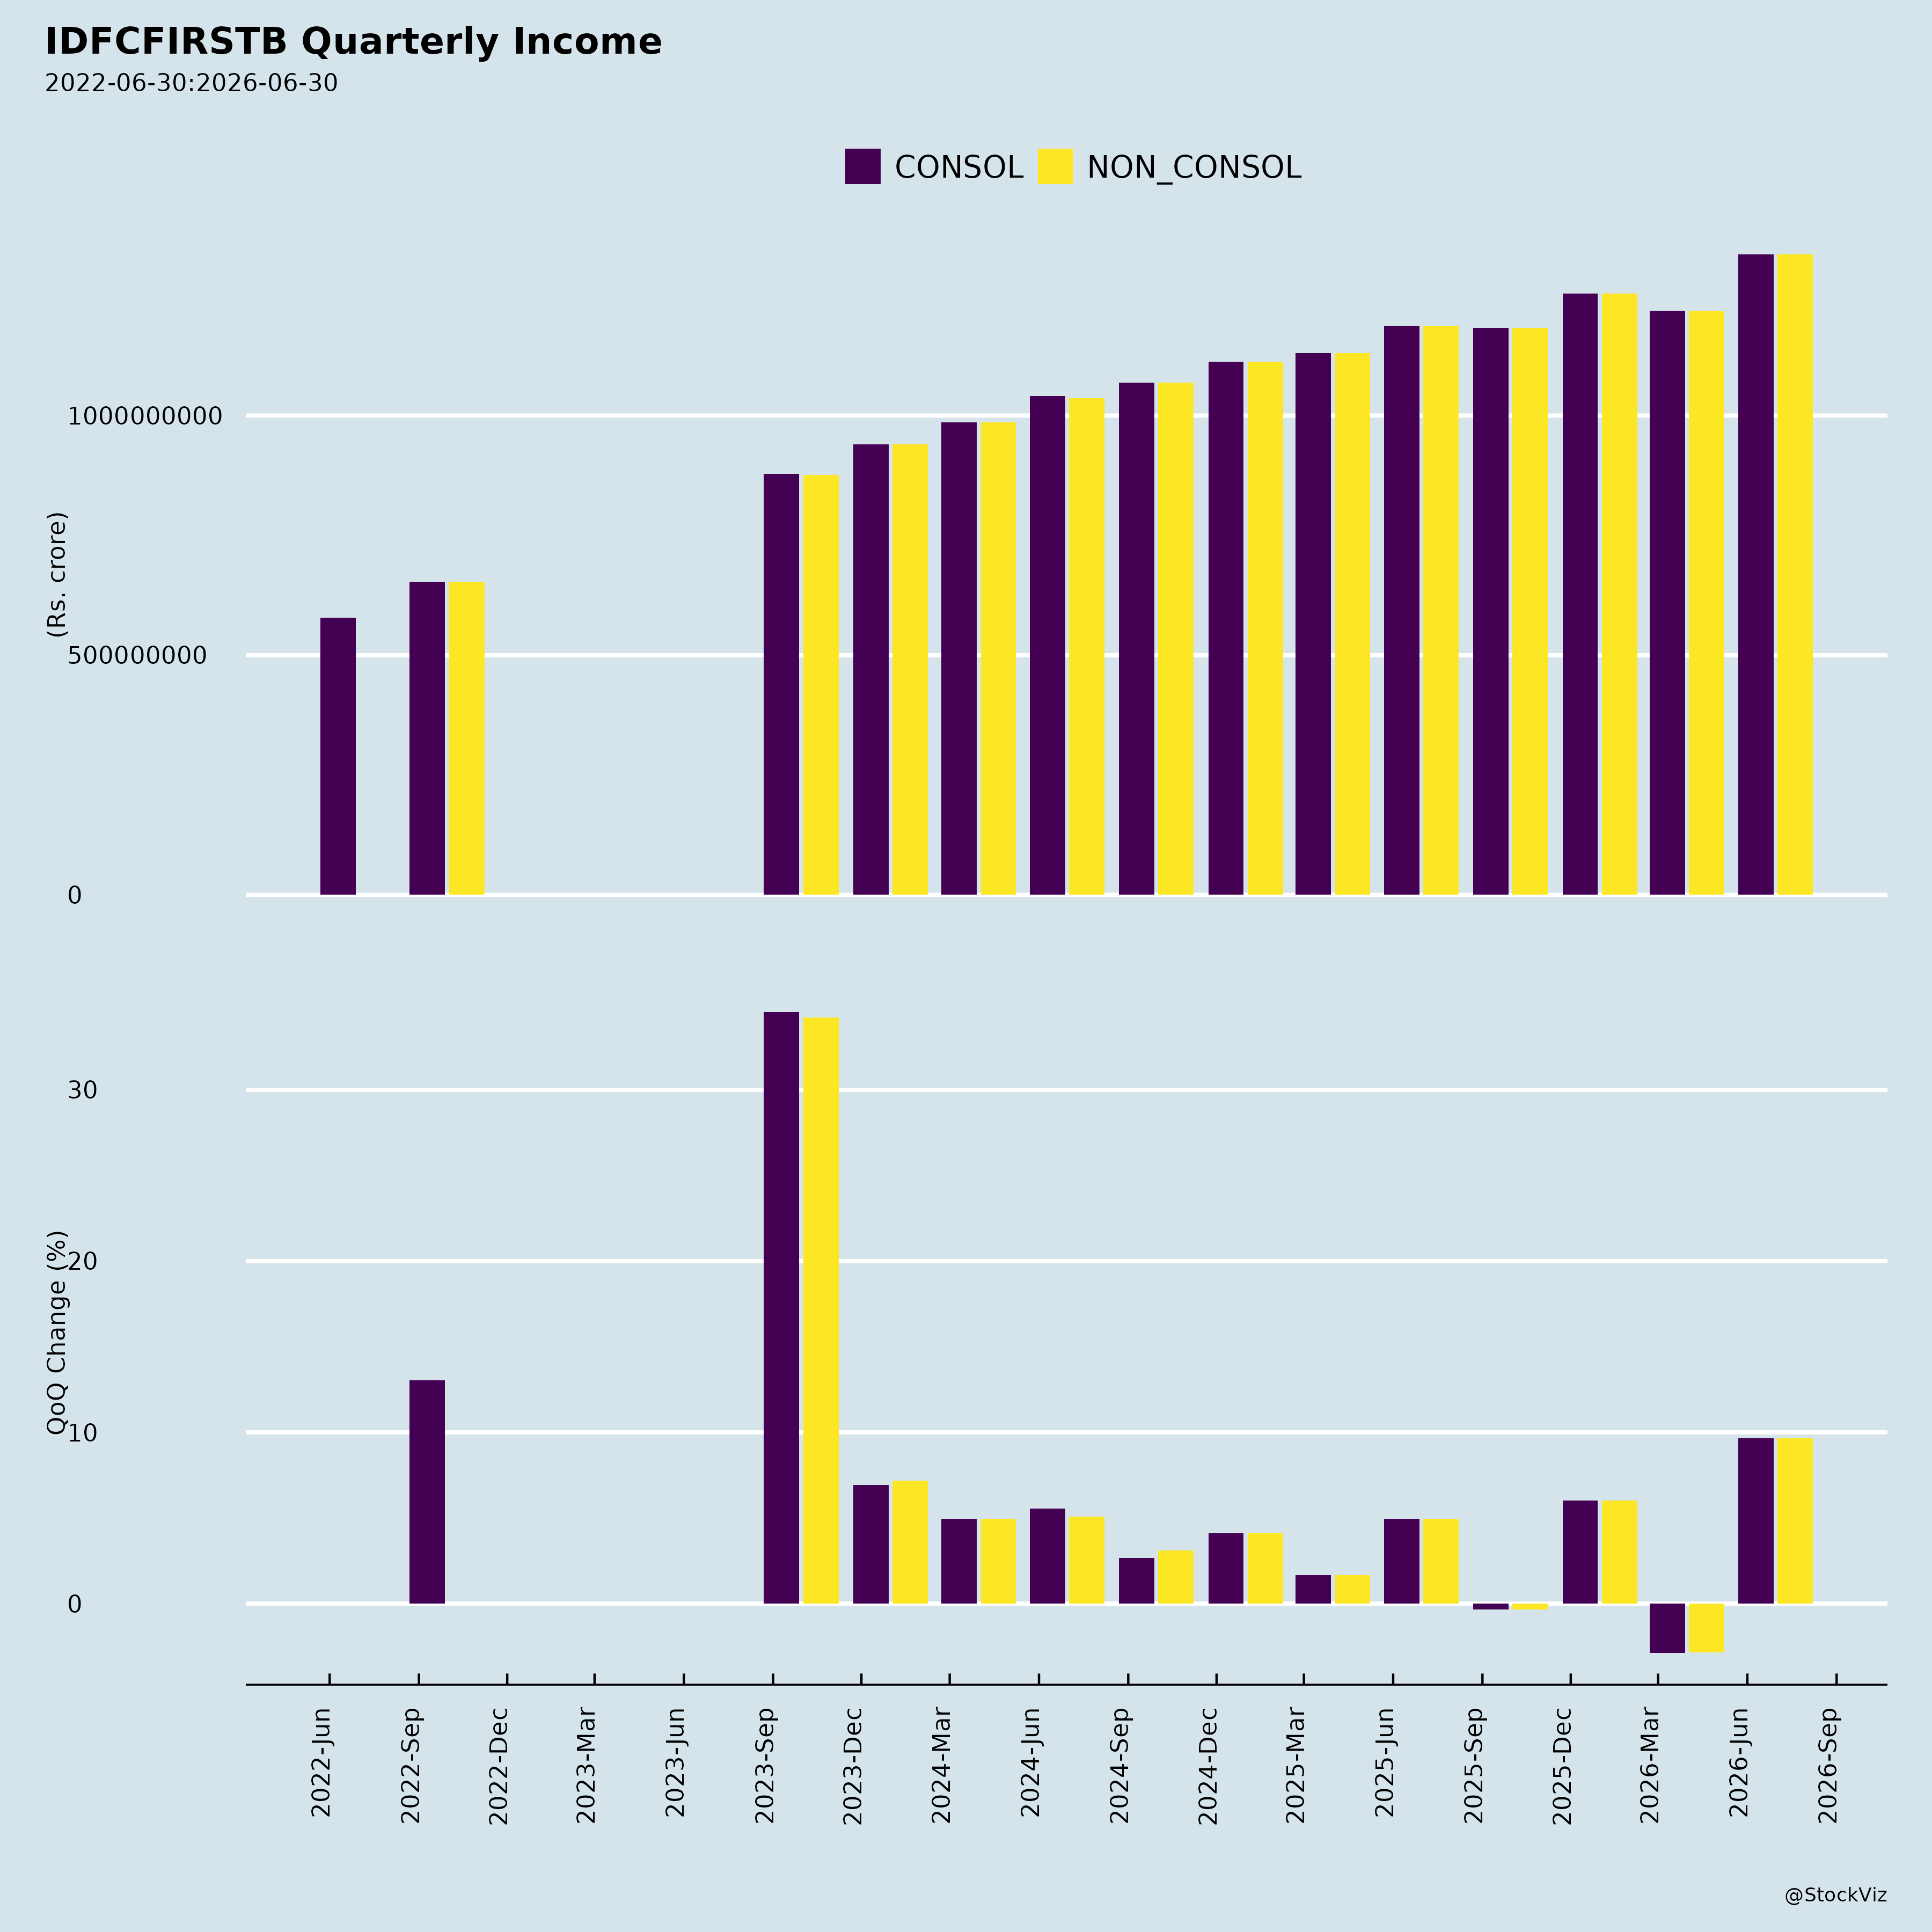
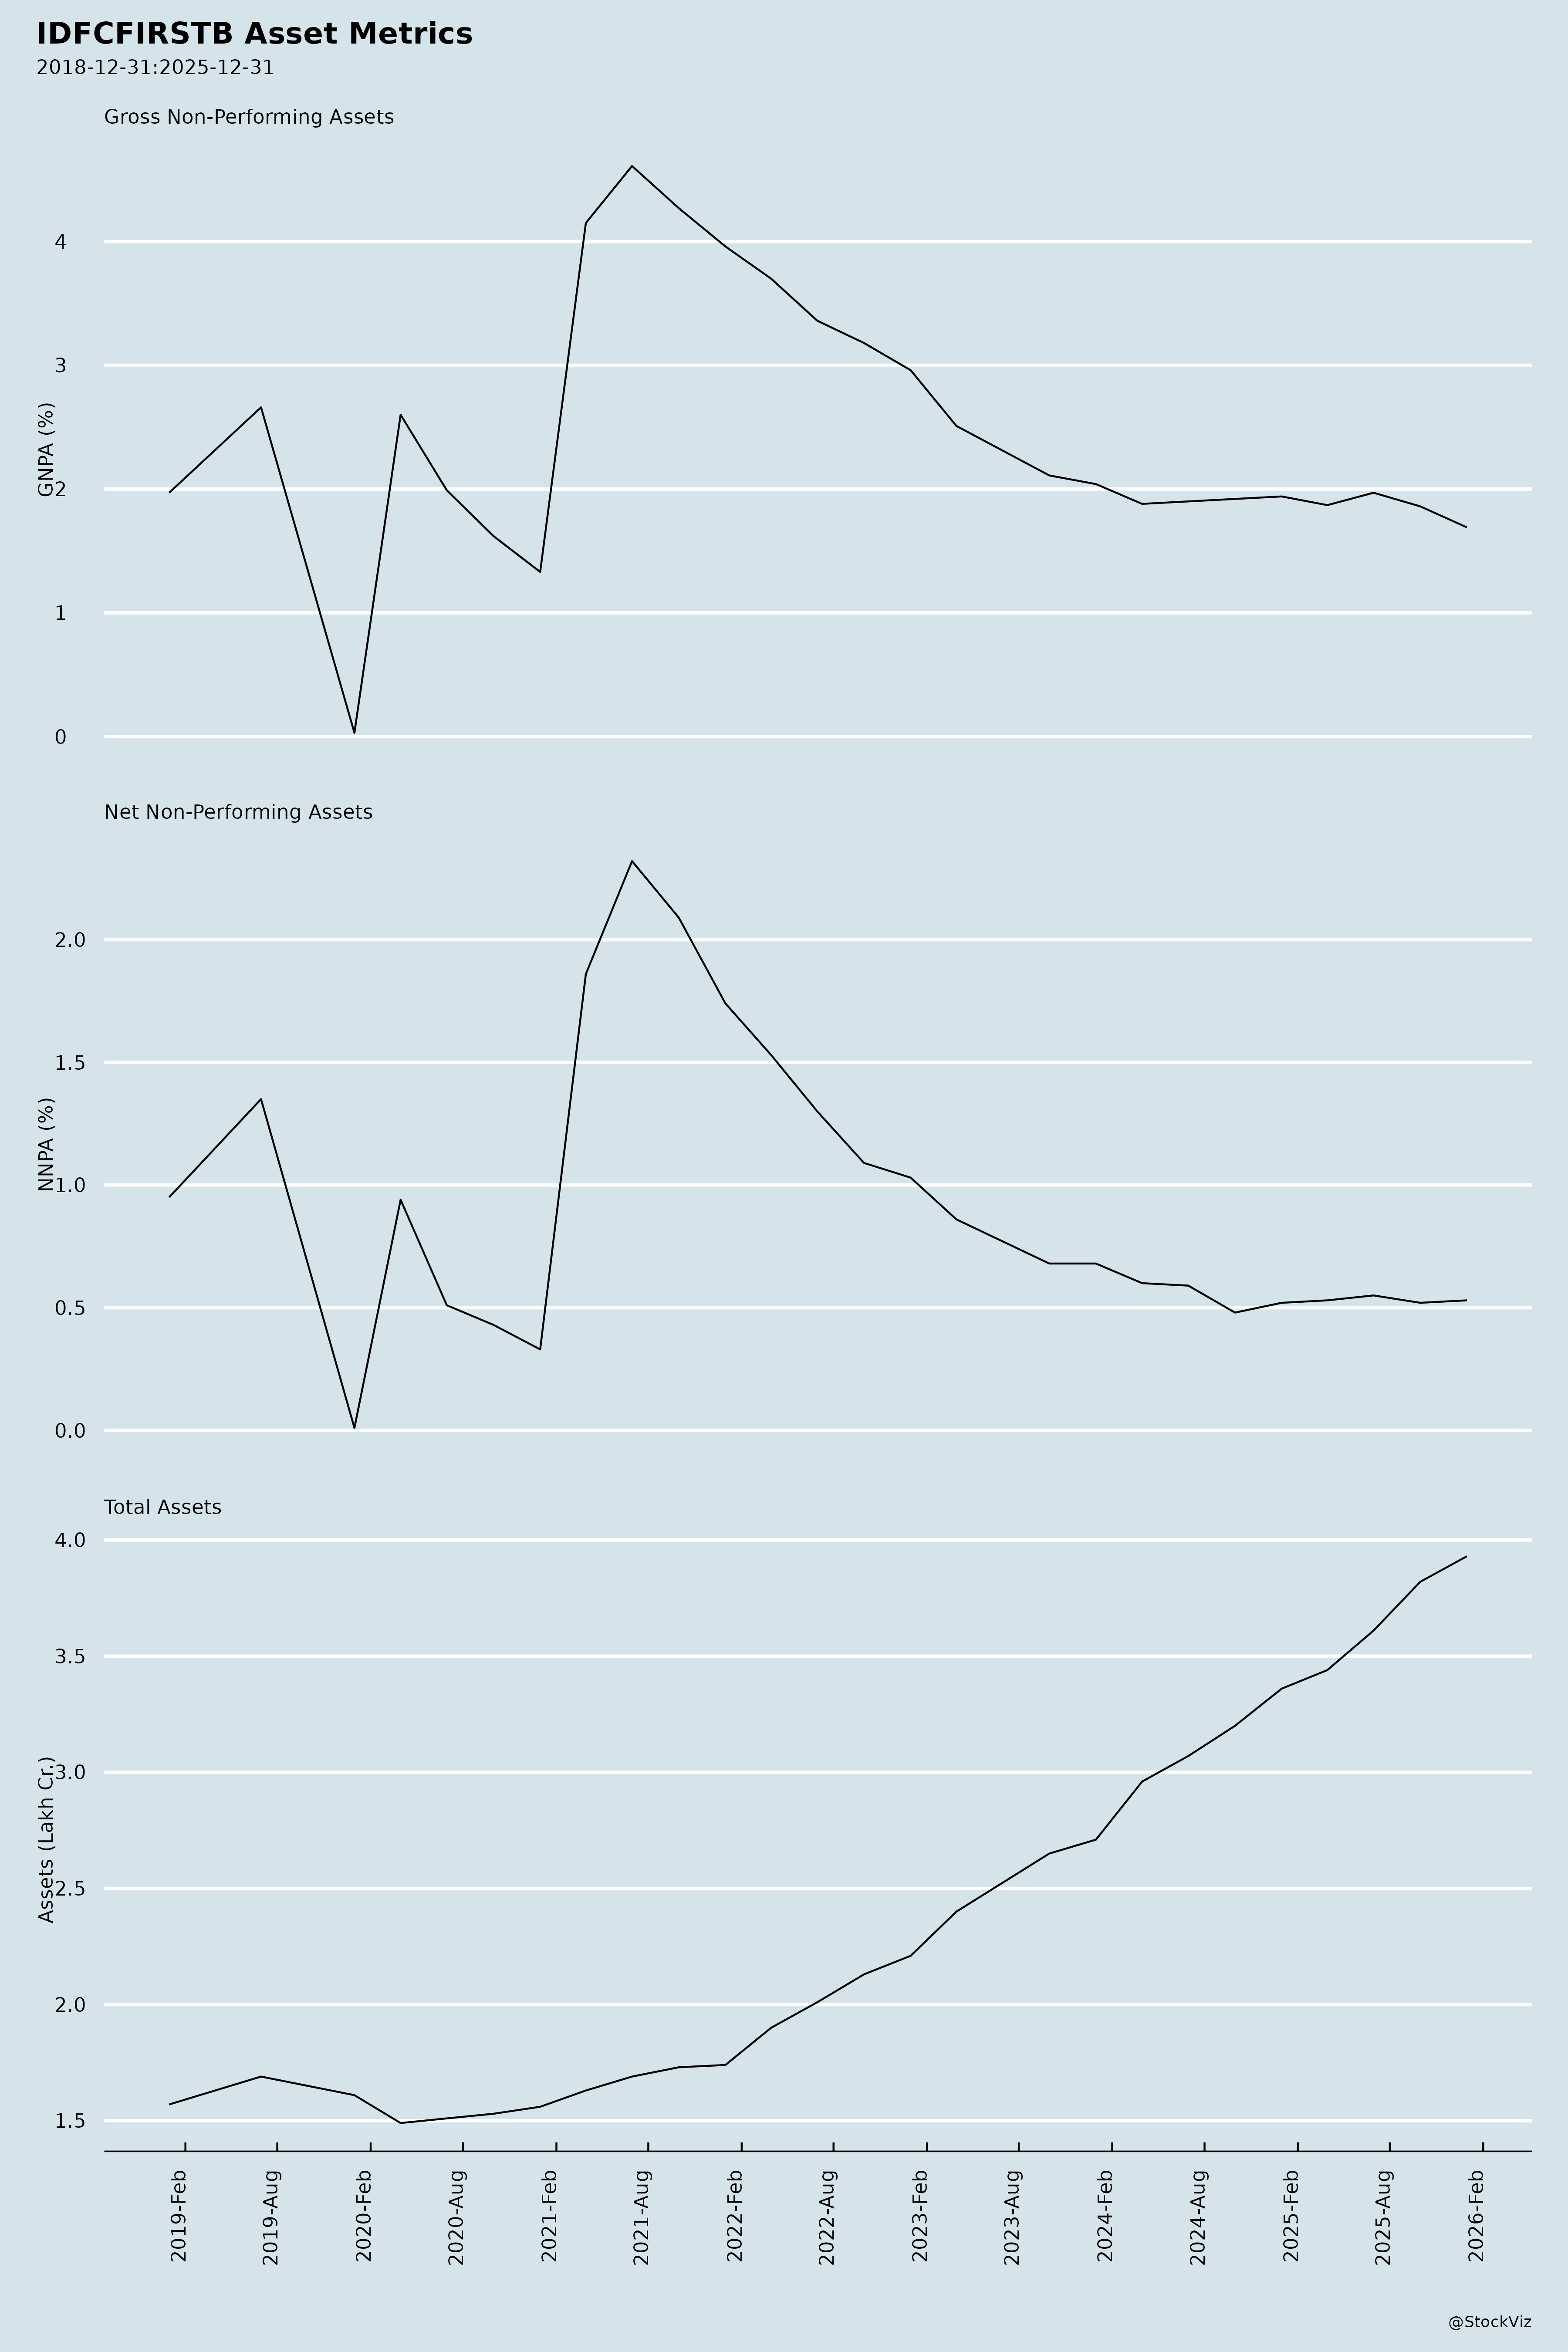
- Strong business momentum. Total customer business (loans + customer deposits) crossed ₹6 lakh crore, up ~20% YoY. Loans and advances crossed ₹3 lakh crore to ₹3.05 lakh crore, up 20.6% YoY and 5.2% QoQ, driven by mortgage, vehicle, corporate and consumer loans. Customer deposits reached ₹2,99,405 crore, up 16.6% YoY and 5.3% QoQ.
- CASA franchise strength. CASA deposits reached ₹1,58,492 crore, up 24.6% YoY and 8.1% QoQ; the CASA ratio improved to 50.8%. Average CASA ratio was above 50% at 50.1%. Average CA deposits grew ~30% YoY and SA ~25% YoY, with growth described as granular.
- Improving asset quality. Gross NPA improved to 1.51% (from 1.61% QoQ and 1.97% YoY); Net NPA to 0.44%. RAM gross NPA improved to 1.40% and net NPA to 0.52%. SMA-1 & 2 for RAM was stable at 0.77%. Collection efficiency was stable at 99.5%. MFI SMA 1 and 2 normalized to 0.71%, and MFI slippages were low.
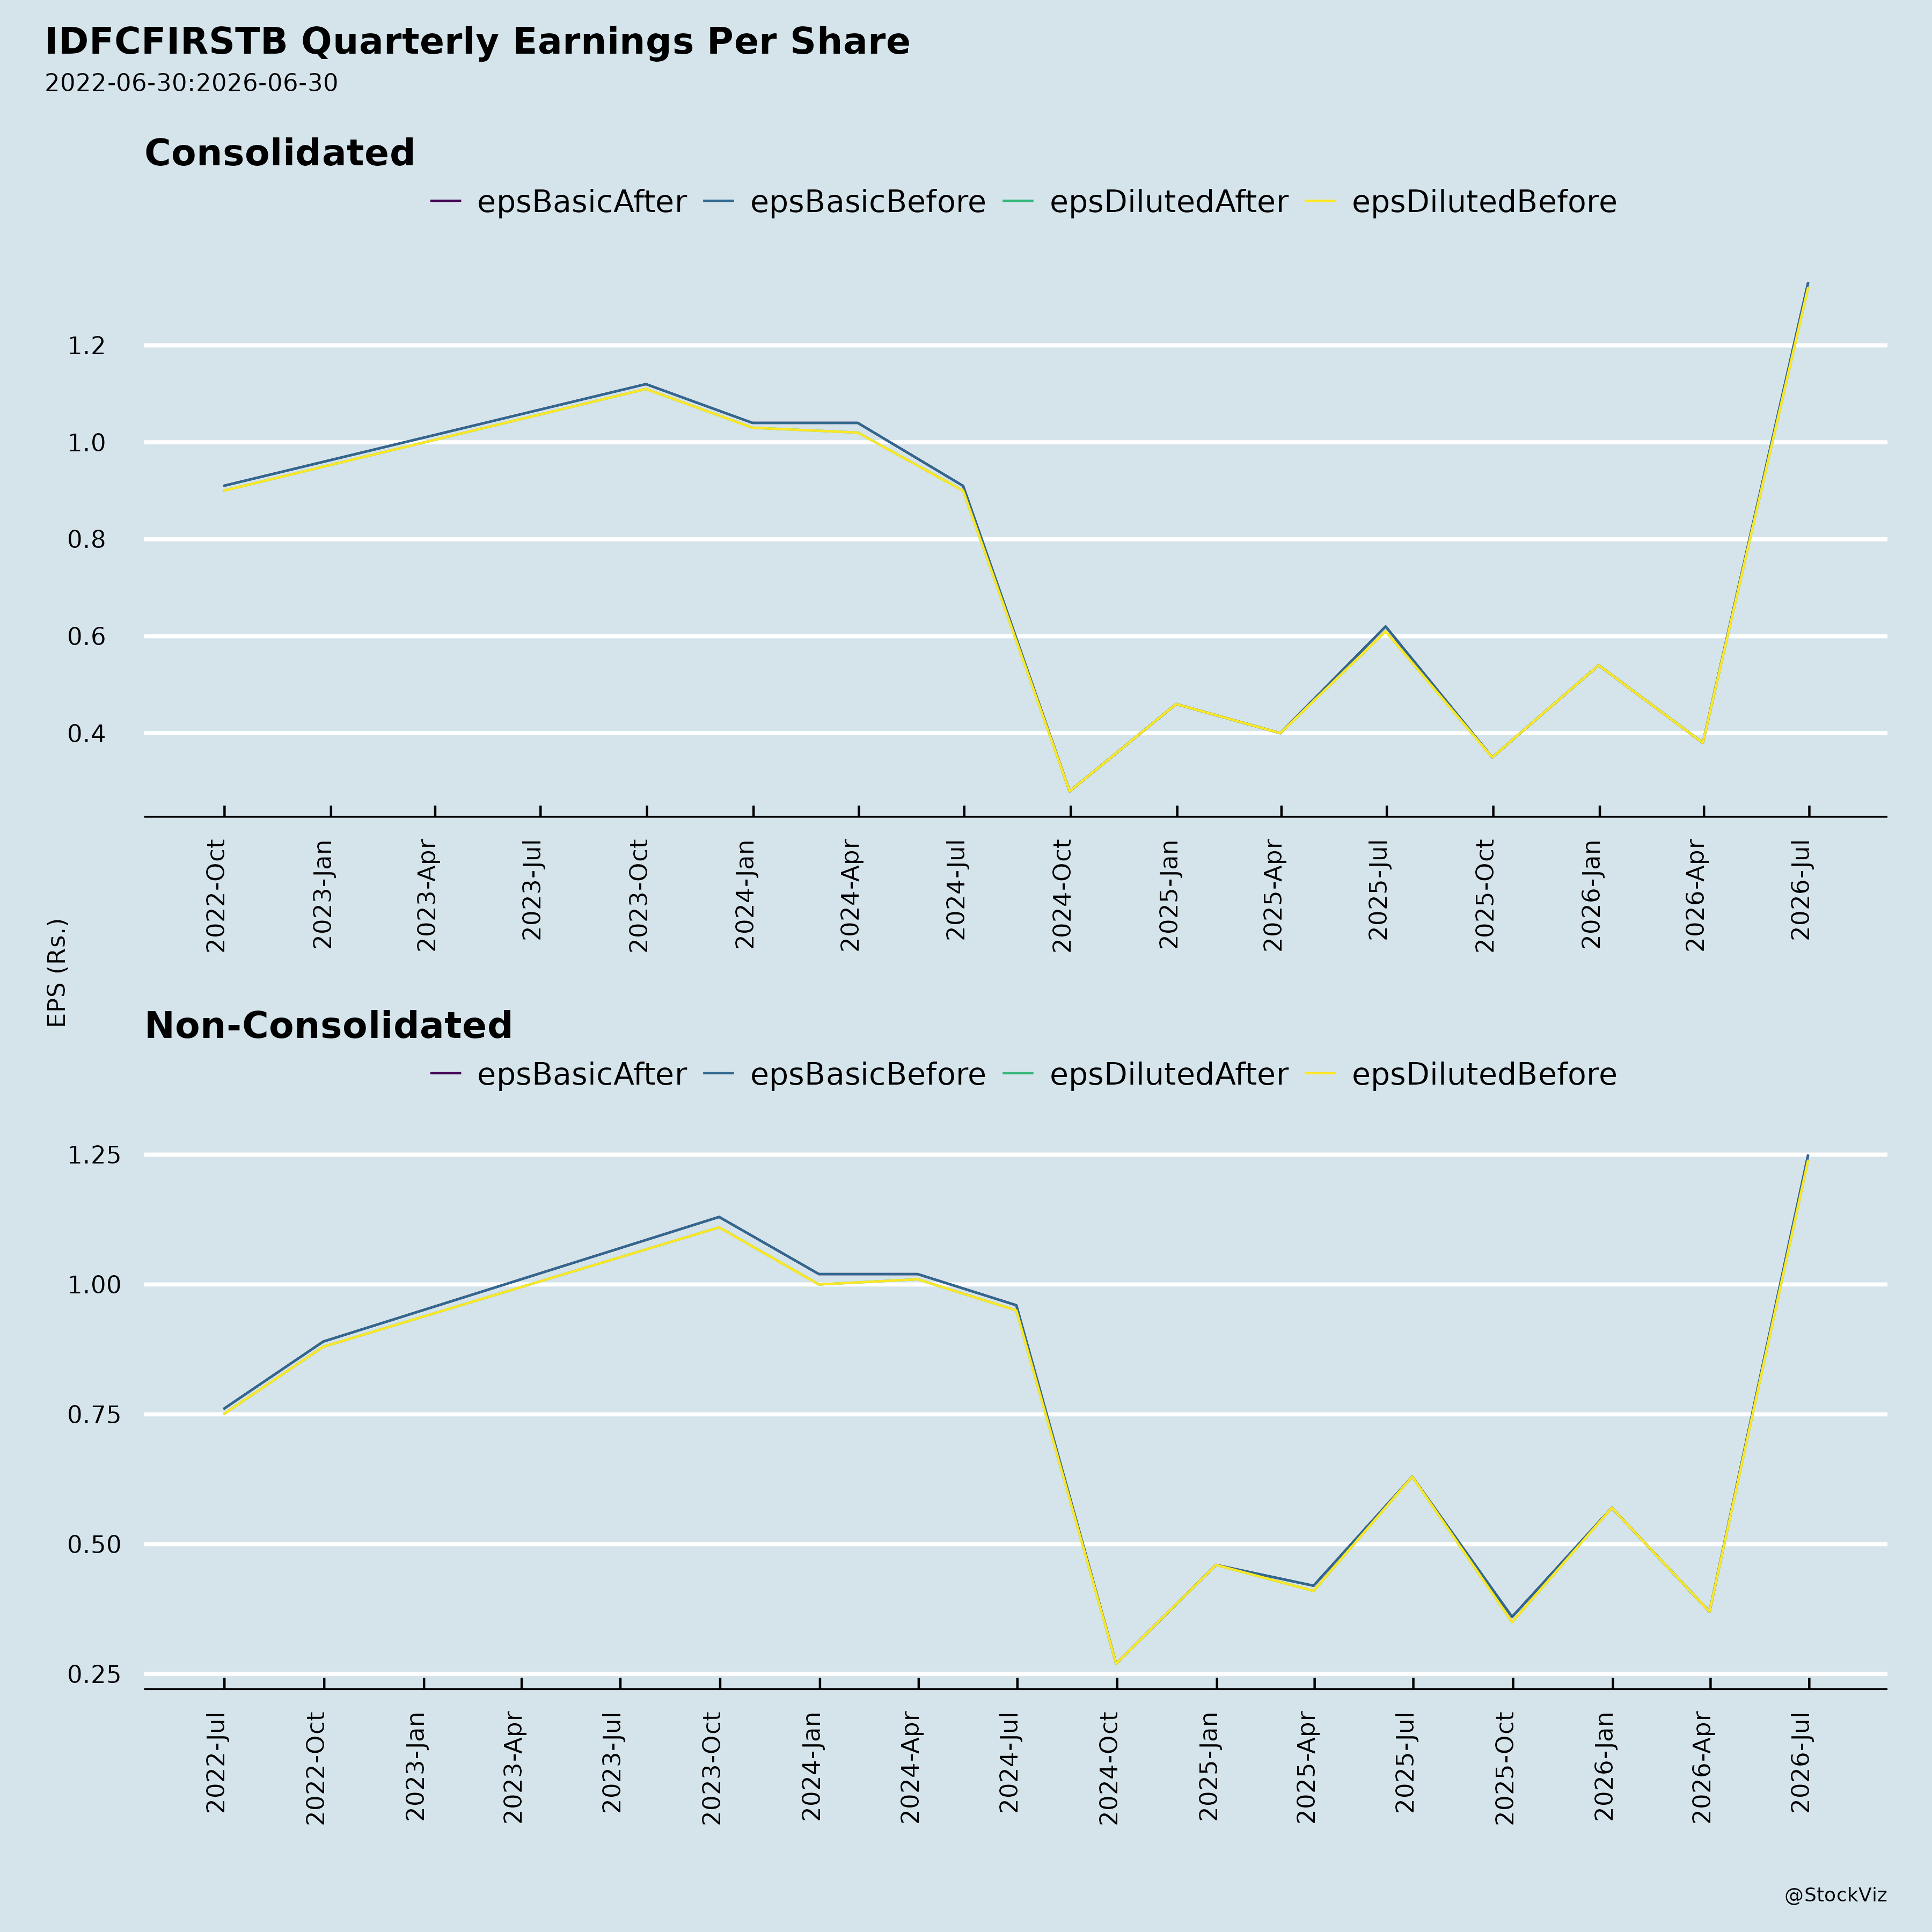
- Profitability inflection. Highest-ever quarterly PAT of ₹1,075 crore, up 132.4% YoY, crossing ₹1,000 crore for the first time. NII grew 21.1% YoY. Operating profit (excluding trading gains) rose 36% YoY. ROA was 1.06% for Q1 FY27 versus 0.54% a year earlier.
- Operating leverage emerging. The operating jaw between total income and opex was ~500 bps in Q1. Cost-to-income improved 166 bps QoQ and 310 bps YoY. Management expects the cost-to-income reduction journey to resume and aims to take it below 70% during the year.
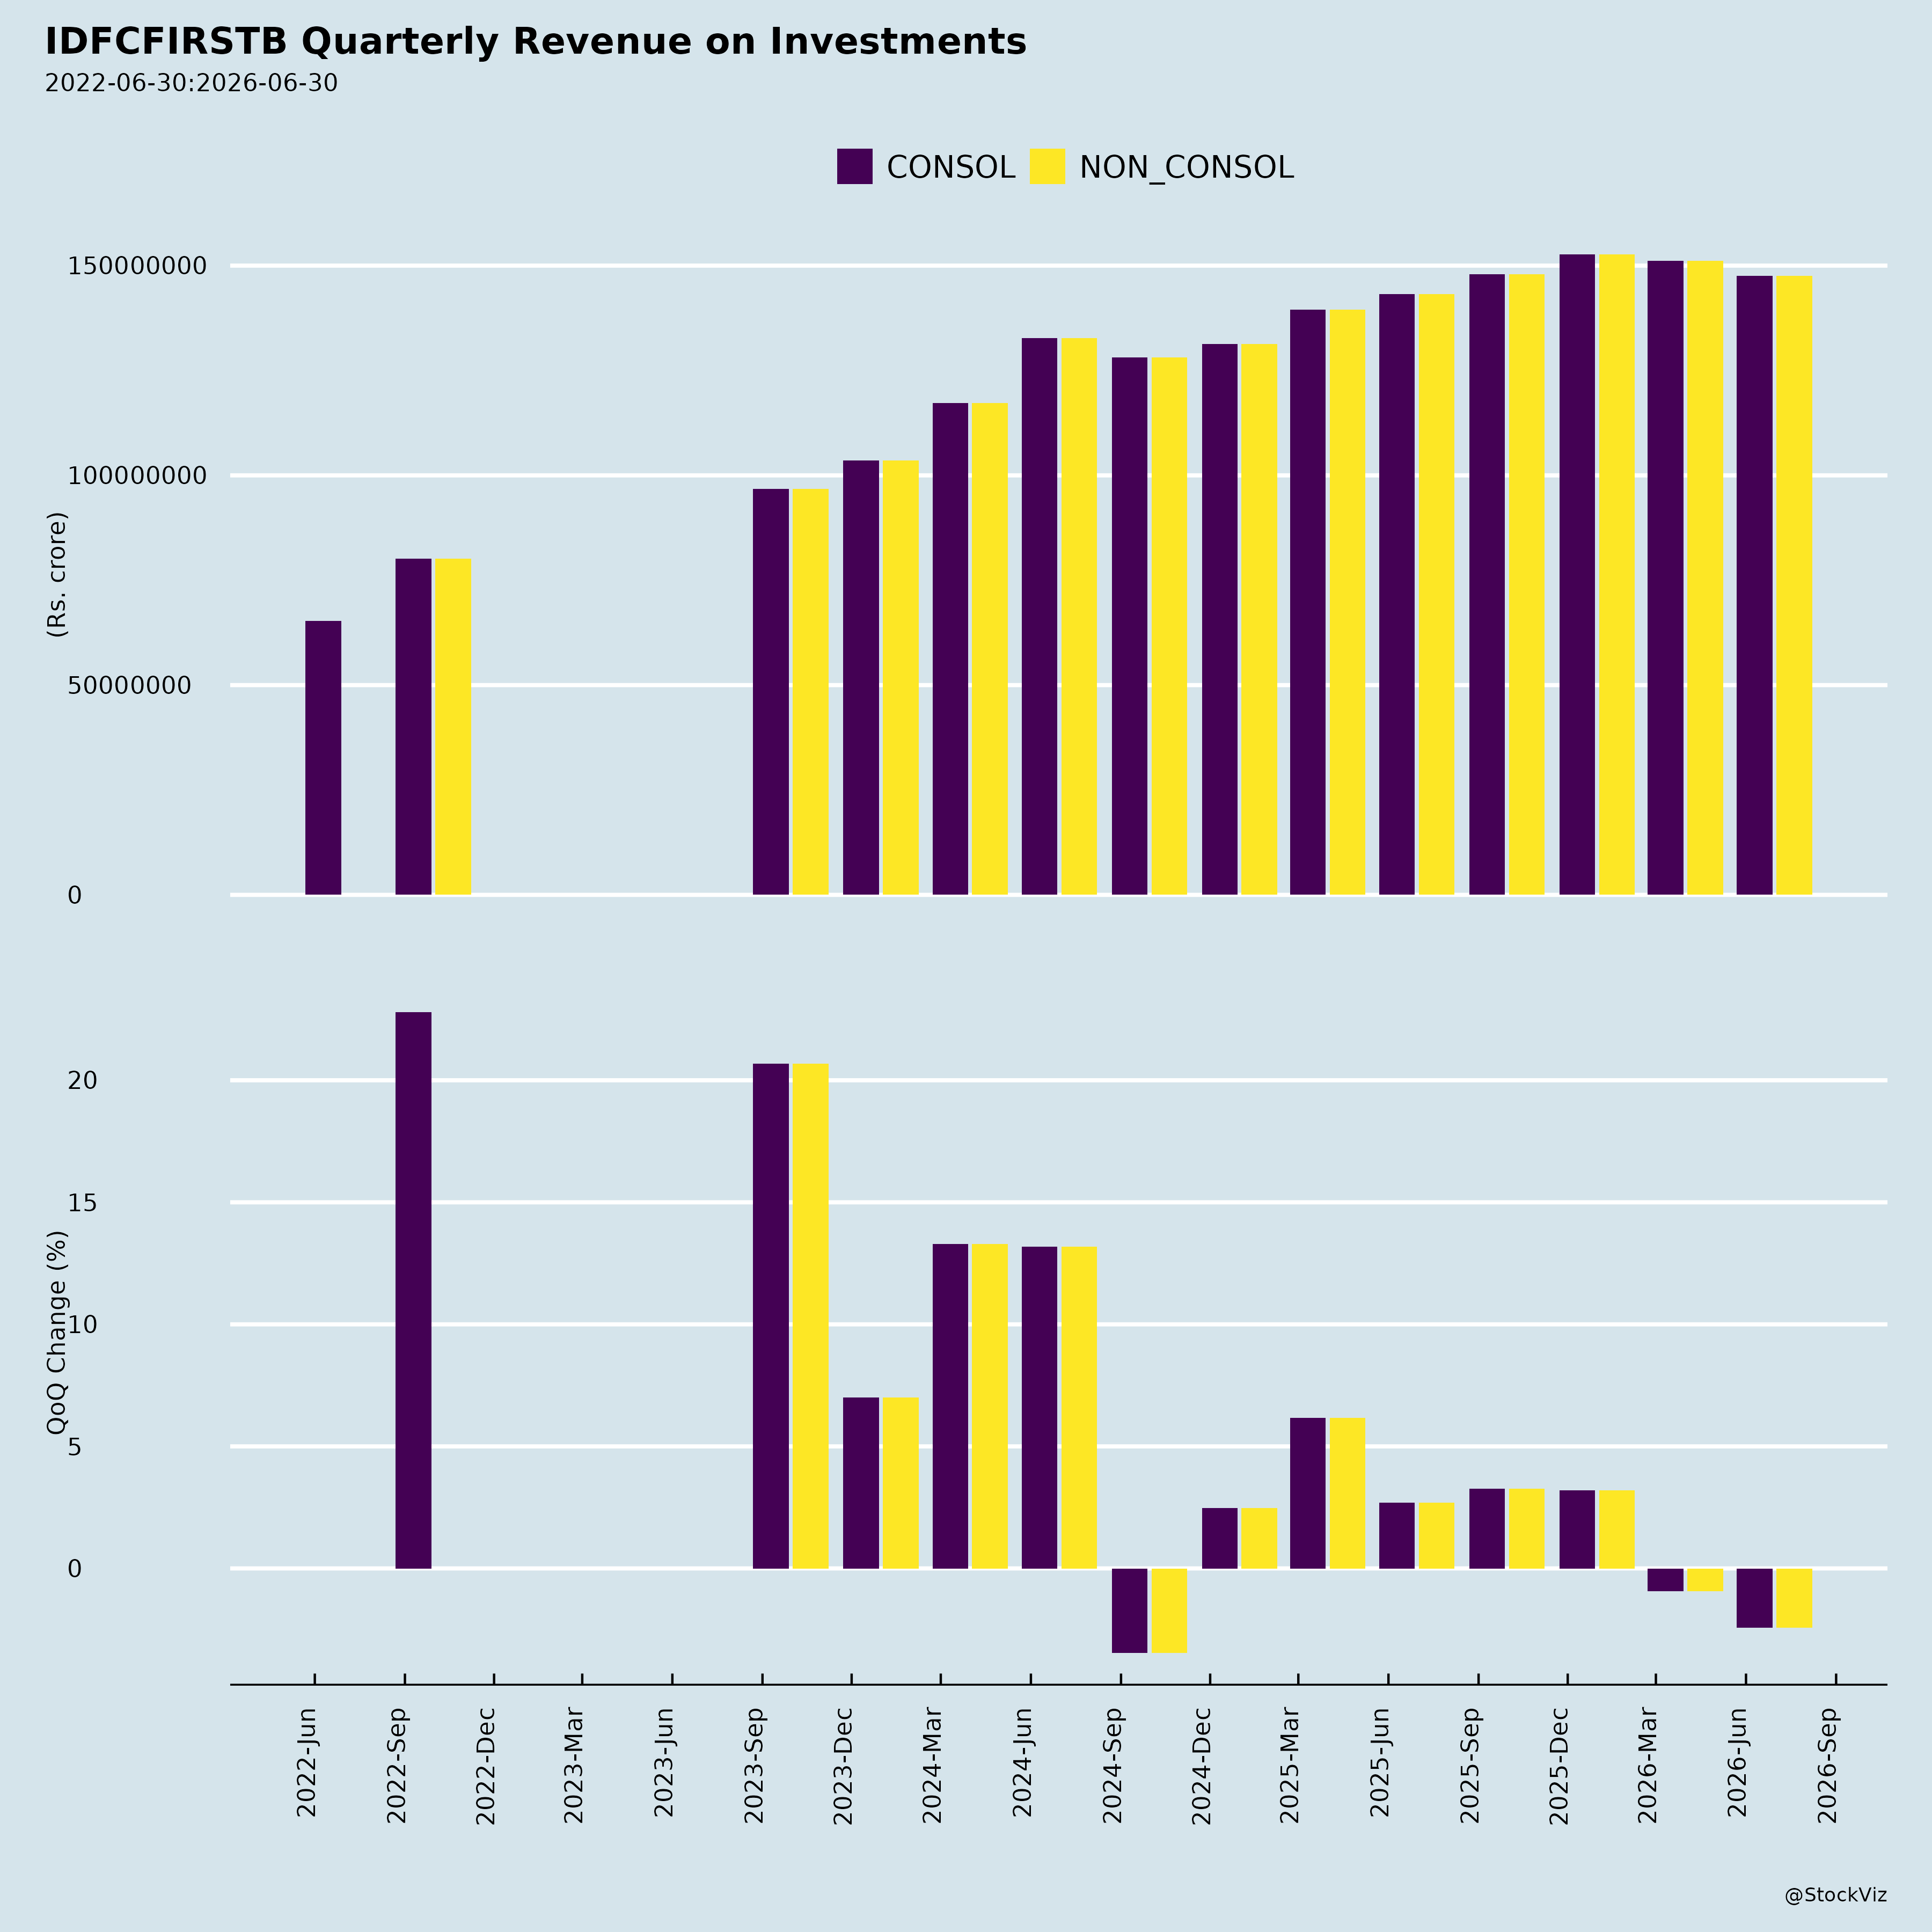
- Fee and treasury income. Fee income grew 22.9% YoY, backed by disbursements up over 25% YoY. Treasury gain of ₹181 crore benefited from softening G-Sec yields. Fee to average total assets was 2.09%.
- Credit cards and wealth. Cards in force reached 4.8 million; the card book grew ~19% YoY to ~₹9,600 crore, with spends up 22% YoY. Wealth management AUM reached ~₹64,000 crore, up 24% YoY.
- NRI and FCNR(B) opportunity. The NRI deposit book is ~₹25,000 crore, about 1.7% of a system pool of ~₹1.65 trillion. The bank announced a competitive FCNR(B) rate of 6.75% and hopes to garner ~2.5% share of the pool (assuming $60–70 billion inflows). Separately, the bank mobilized ~USD 3.57 billion (~₹33,975 crore) from NRI customers under the RBI’s FCNR(B) swap window, about 11% of the deposit base as of June 30, 2026, and its IFSC Banking Unit facilitated ~USD 2.60 billion (~₹24,720 crore) of lending. These FCNR(B) figures are provisional and unaudited, with INR equivalents based on the August 31, 2026 exchange rate.
- MFI normalization and growth. MFI disbursements nearly doubled versus Q1 last year; the decline in the book has been arrested, and management targets ~15% YoY book growth.
- Capital flexibility. The Board granted enabling approval to raise up to ₹7,500 crore via equity securities and up to ₹12,500 crore via debt/other eligible instruments, valid one year from the ensuing AGM, subject to shareholder and regulatory approvals. This is enabling in nature with no immediate obligation.
- Long runway. Management cites a growing deposit market providing a long runway for franchise growth and scaling of universal banking products. The bank serves 39 million customers through 1,155 branches across over 60,000 cities, towns and villages.
- Governance and technology foundation. Management emphasizes a customer-first culture, high governance standards, and a modern cloud-native, API-led, microservices architecture with data, analytics and AI, including machine-learning scorecards for consumer durable, two-wheeler, small-ticket and kirana/chemist/salon loans.
3. Key Risks
- Asset quality and credit cost risk. Credit cost guidance was 180–190 bps; Q1 came in at 1.53% (1.13% on average assets). Management flagged that Q1 is typically the weakest quarter, yet it outperformed, and noted uncertainty around how the current quarter and subsequent quarters play out.
- Macro, geopolitical and monsoon risk. The ₹515 crore contingency provision was made specifically for possible impacts of monsoon or fuel price volatility in the rest of the year, and for evolving macroeconomic and geopolitical uncertainties.
- Margin risk from asset mix and FCNR. Management expects margins around 5.8% for the year, with possible QoQ contraction from 5.9% adjusted, depending on asset mix changes and how FCNR plays out. No rate hike has been factored into projections.
- ECL transition risk. More capital must be set aside for ECL on transition, though RWA benefits on credit and operational risk may offset this; the bank’s preliminary sense is a broadly neutral capital impact.
- Fraud recovery uncertainty. Recovery depends on a legal and court process with no committed timeline; nothing was booked in Q1.
- PSL purchase drag. The bank remains short on PSL and expects to keep buying at a loss, with the extent dependent on market rates.
- Opex and income sensitivity. Management’s opex leverage depends on business momentum; if income growth exceeds the guided 18–18.5%, opex could also rise as the bank pursues market opportunities.
- Governance/tenure transitions. The cessation of an Independent Director and the change of Chief Vigilance Officer represent leadership transitions, though succession plans and committee recommendations were followed.
4. Management Guidance Versus Observed Performance
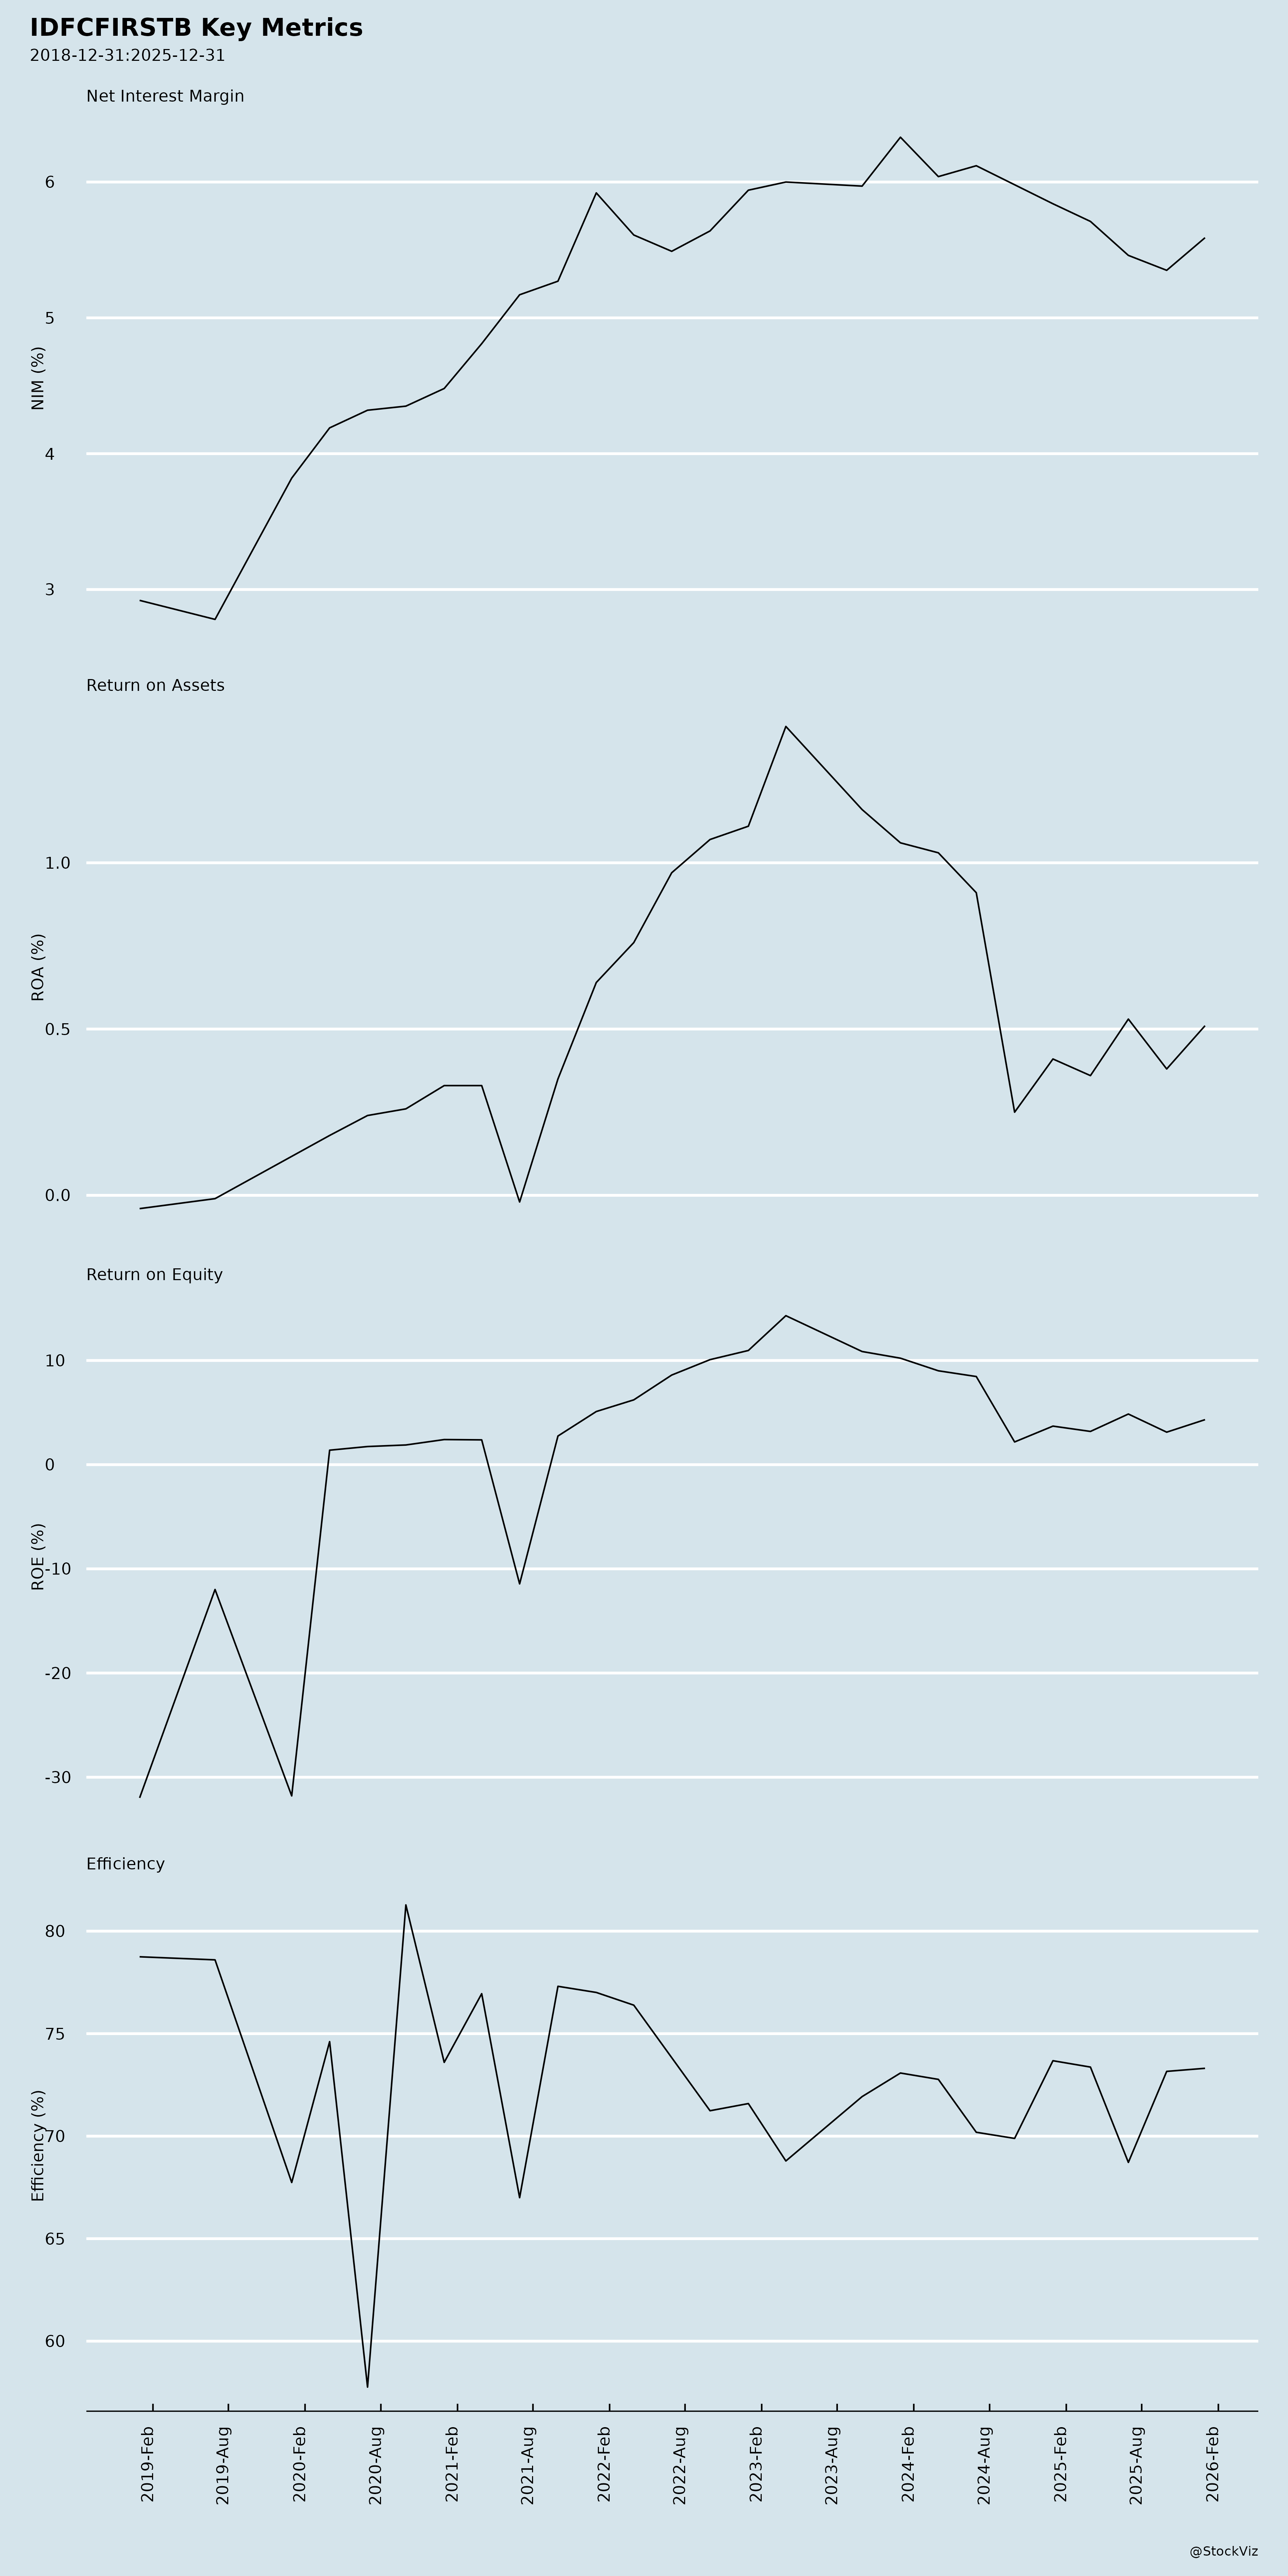
- NIM. Previously guided 5.75% for the full year; Q1 came in at 5.96% (5.90% adjusted for the income tax refund benefit, and excluding the prior quarter’s day-count benefit). Guidance was upgraded to ~5.8% for the year, with management indicating possible QoQ contraction from 5.9% adjusted.
- Credit cost. Prior guidance was 180–190 bps. Q1 actual was 1.53% (1.13% on average assets), which management described as better than expected, contributing to the ROA upgrade. Management did not explicitly commit to lowering the credit cost guidance in the discussion.
- ROA. Earlier guidance was to reach ~1% ROA by year-end, described as “kissing distance.” Q1 FY27 ROA was 1.06% (management noted ~90 bps if adjusted for treasury gain and other benefits). Management now says it is “gunning for” ~1% ROA for the full year, an upgrade from the prior year-end framing.
- Cost-to-income. Q1 FY27 was 70.7% (excluding trading gains), improved 166 bps QoQ and 310 bps YoY. Management’s endeavor is to take it below 70% during the year. Management expects the cost-to-income reduction journey to resume now that MFI is in the base case, with year-on-year improvement expected. Longer term, management guides the cost-to-income ratio for retail liabilities to reach 100% over the next 4–5 years and for credit cards to reach the mid-sixties over the next 4–5 years.
- Opex growth. Prior guidance was 13–14% for the full year with 18–18.5% income growth. Management said it would endeavor to maintain the ~500 bps operating jaw, with possible changes on both income and opex sides depending on business momentum.
- Deposits. Prior guidance was ~5% QoQ deposit growth; Q1 delivered 5.3% QoQ customer deposit growth and 5.9% total deposit growth, ahead of guidance.
- MFI book. Management targets ~15% YoY book growth, with disbursements nearly doubling YoY and the decline arrested.
- CGFMU. The ₹514.8 crore claim was received in Q1; procedurally this comes once a year, so it is done for the year. Some recovery could come next year but of a much smaller amount.
- ECL. Management’s preliminary sense is a broadly neutral capital impact on transition, combining higher ECL capital requirements with reduced RWA on credit and operational risk. Management does not expect the ROA expansion journey to be prolonged by the transition.
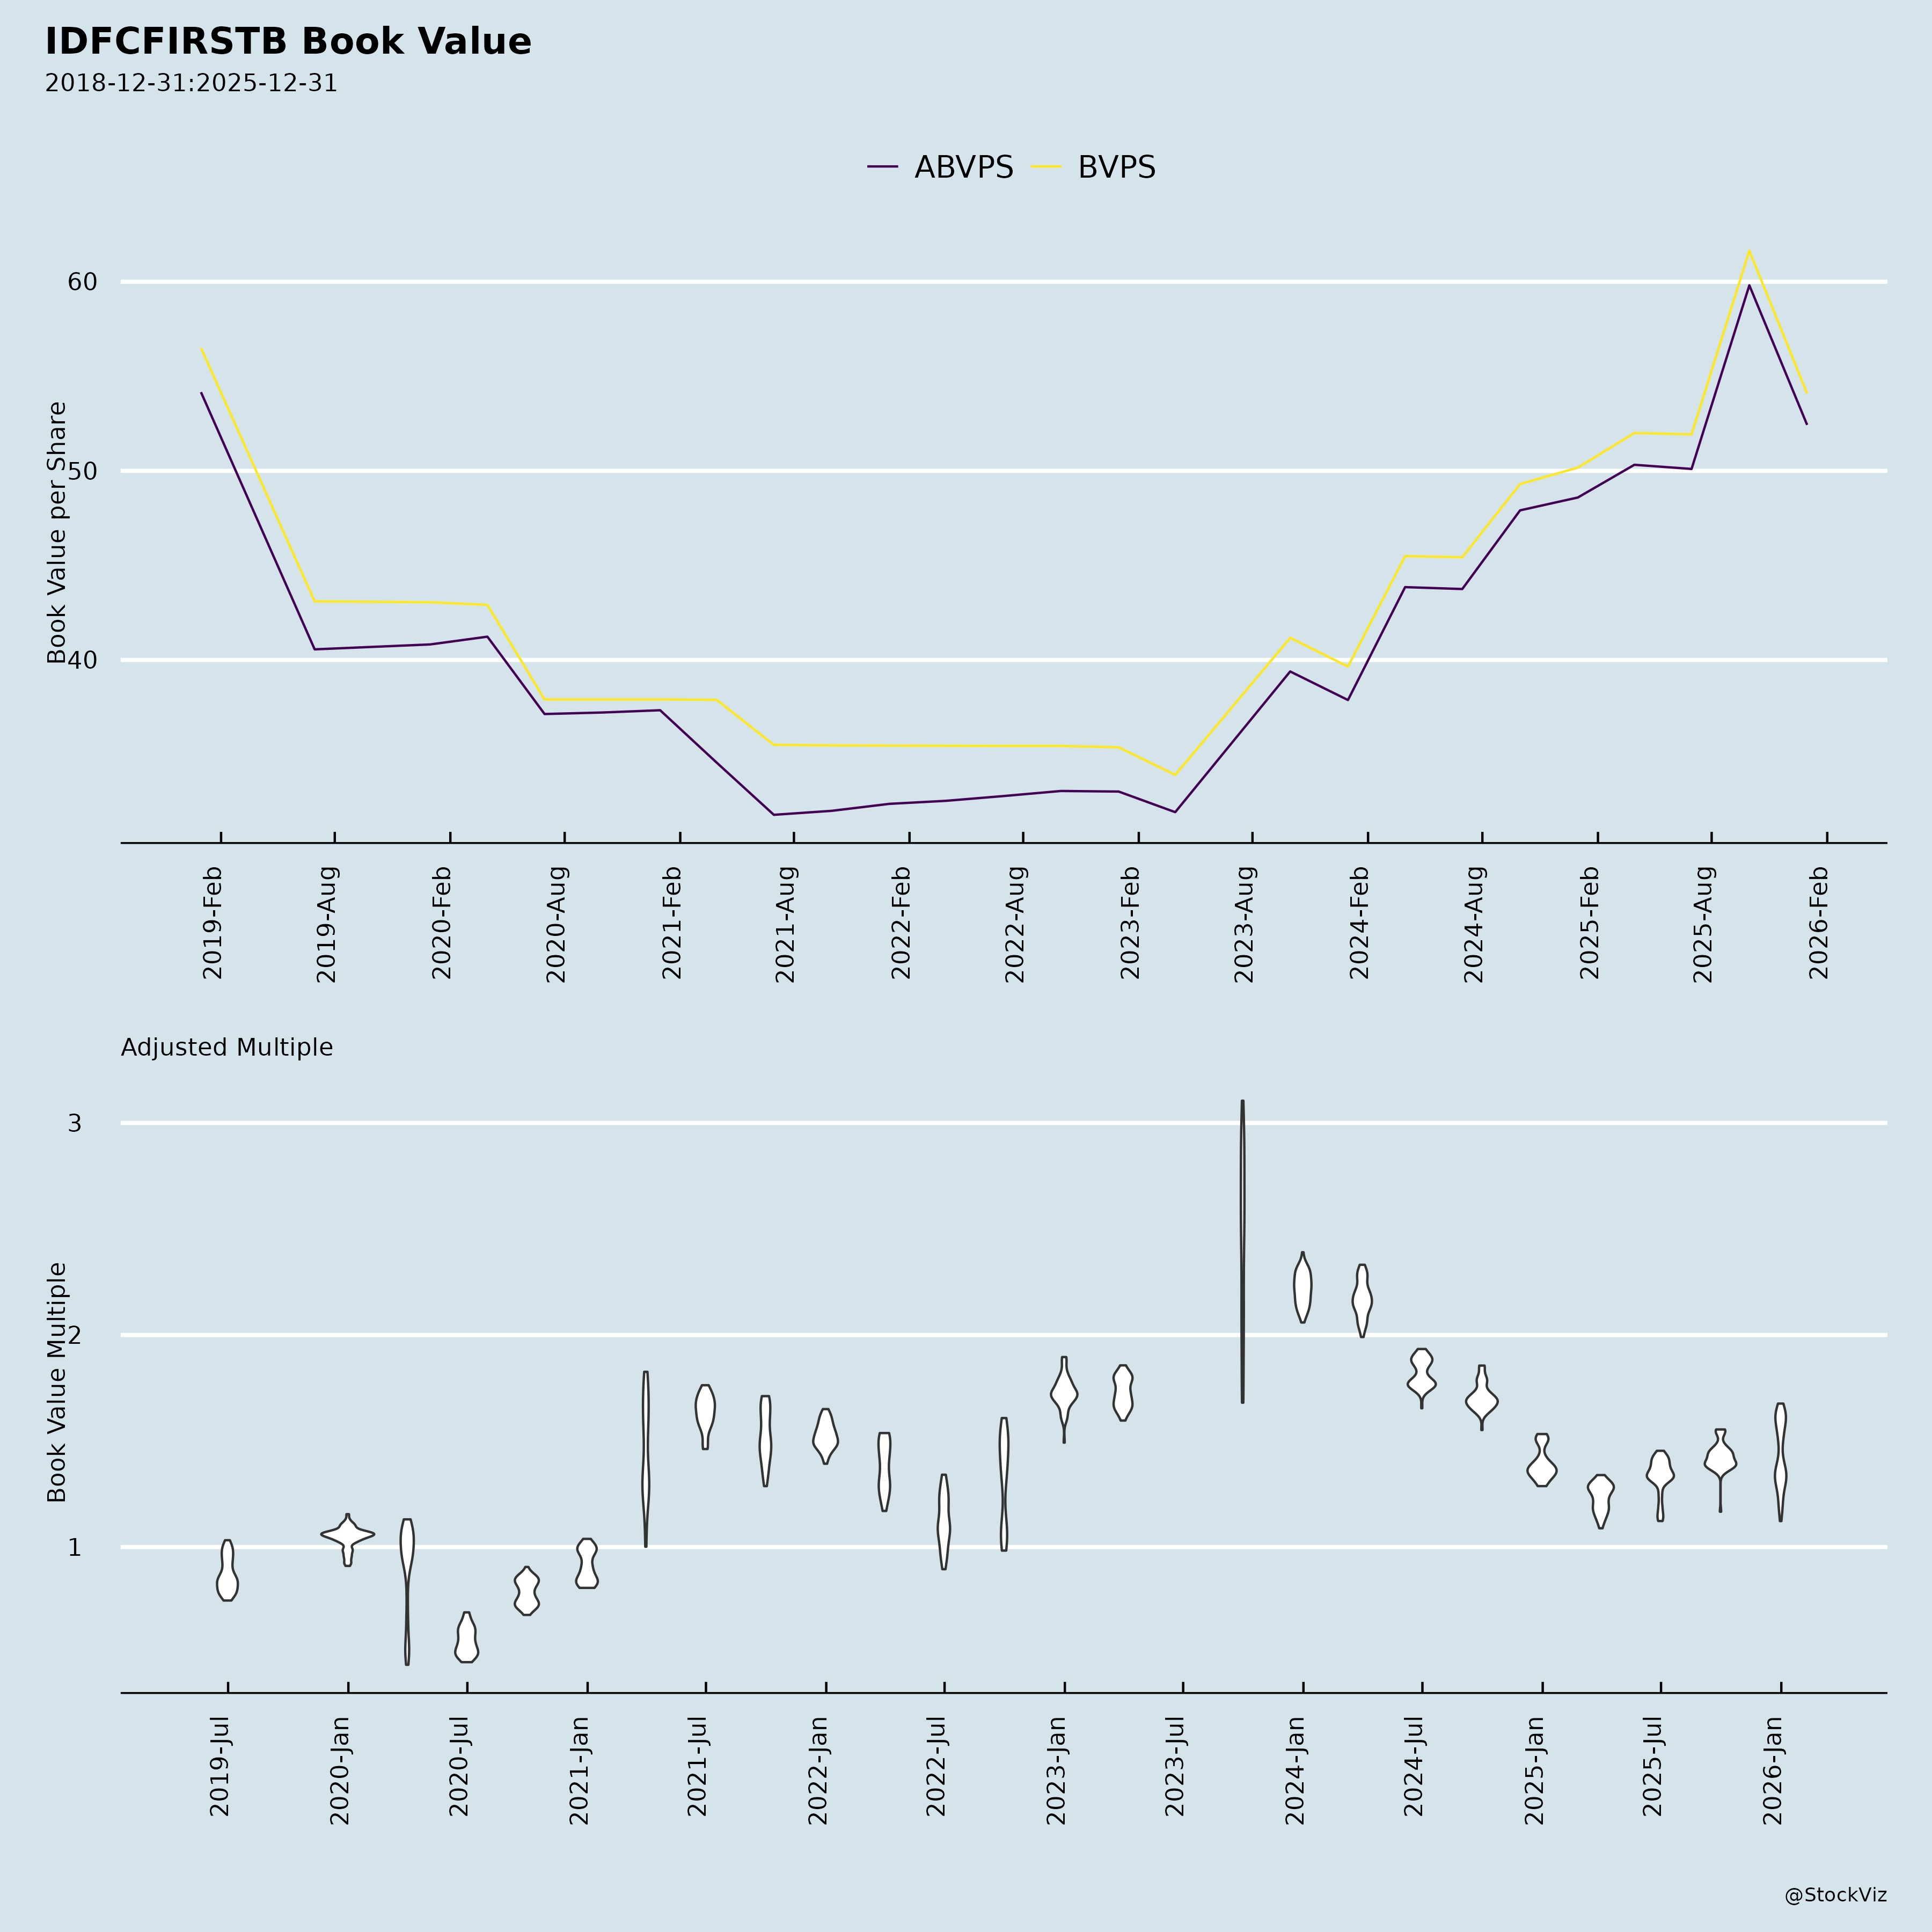
- Capital. Capital adequacy was 15.05% with CET-1 of 13.33%, including a ~30 bps impact from the ops risk RWA reset that typically occurs in Q1. Average LCR was ~116%, broadly around the guided range.
Broker Narrative
Early coverage was defensive, citing rising deposit costs, margin moderation, and wage-driven opex; by the last report these were reframed as resolved/improving, with CASA at 50.8%, CoF at 5.96%, and a 310 bps YoY cost-to-income improvement, supporting a Buy and ~1% FY27 RoA guidance. Credit costs/slippages and funding/margin dynamics were persistent themes, but the risk emphasis shifted to corporate-loan yield dilution, MFI stress, PSLC costs, and RWA/ECL transitions. The final narrative is more constructive, with upgraded NIM/RoA guidance and capital-neutral ECL transition.
Fears that came true
- Rising cost of deposits/higher funding costs and bulk-deposit mix materialised before the later CoF decline to 5.96%, and this pressure overlapped with multiple DISAPPOINTMENT calls in 2023-24 (e.g., -19.7%, -25.9%).
- Margin moderation was experienced in the interim, with negative actual returns on early Add/Buy calls before NIM recovered to ~5.9%, and the last report still flags investment-book normalization as a NIM risk.
- Elevated operating expenses due to wage revisions were a real drag, as the cost-to-income ratio only later improved by 310 bps YoY to 70.7%.
- Stagnating/diluting loan yields persisted: the last report warns that 30% YoY corporate loan growth shifts the mix to lower-yielding assets and may dilute overall yields.
Optimism that failed
- The expectation that healthy Retail/SME credit growth would be a key growth driver was undercut by insufficient organic PSL growth, as the bank still needed ~₹250–260 crore of PSLC purchases in FY26.
Broker Timeline
30 broker calls · 2023-06-01 to 2026-07-28
Copyright © 2023 SAS Data Analytics Pvt. Ltd. All rights reserved.