ICICIPRULI
Equity Metrics
September 24, 2026
ICICI Prudential Life Insurance Company Limited
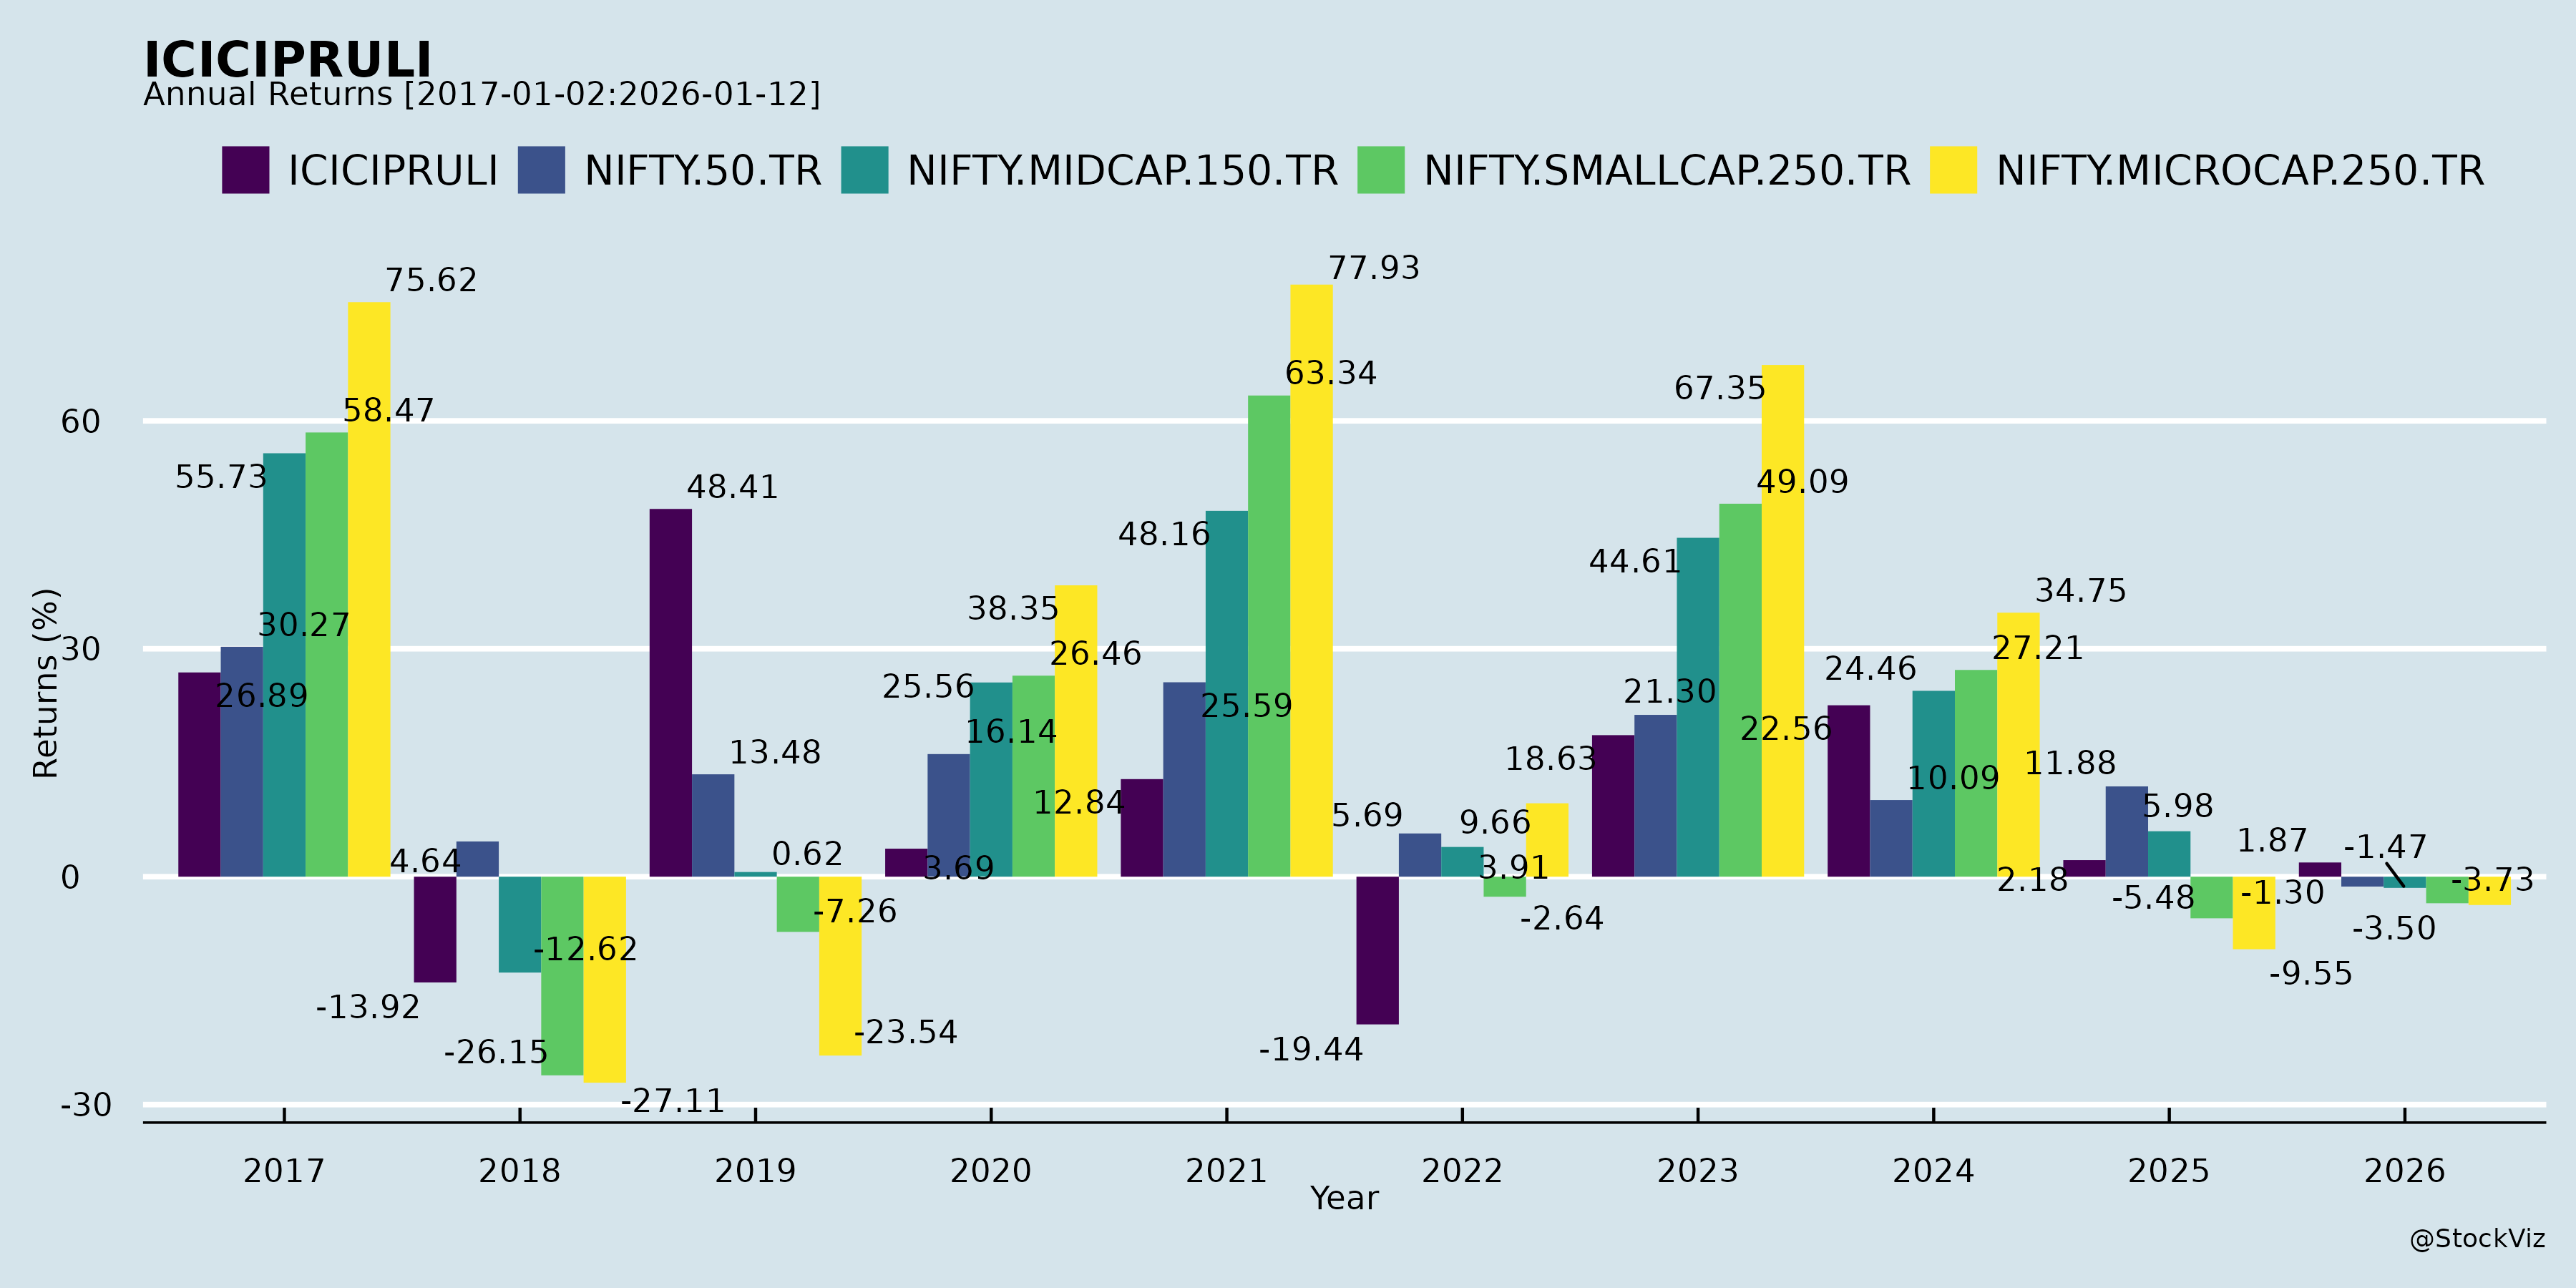
Annual Returns
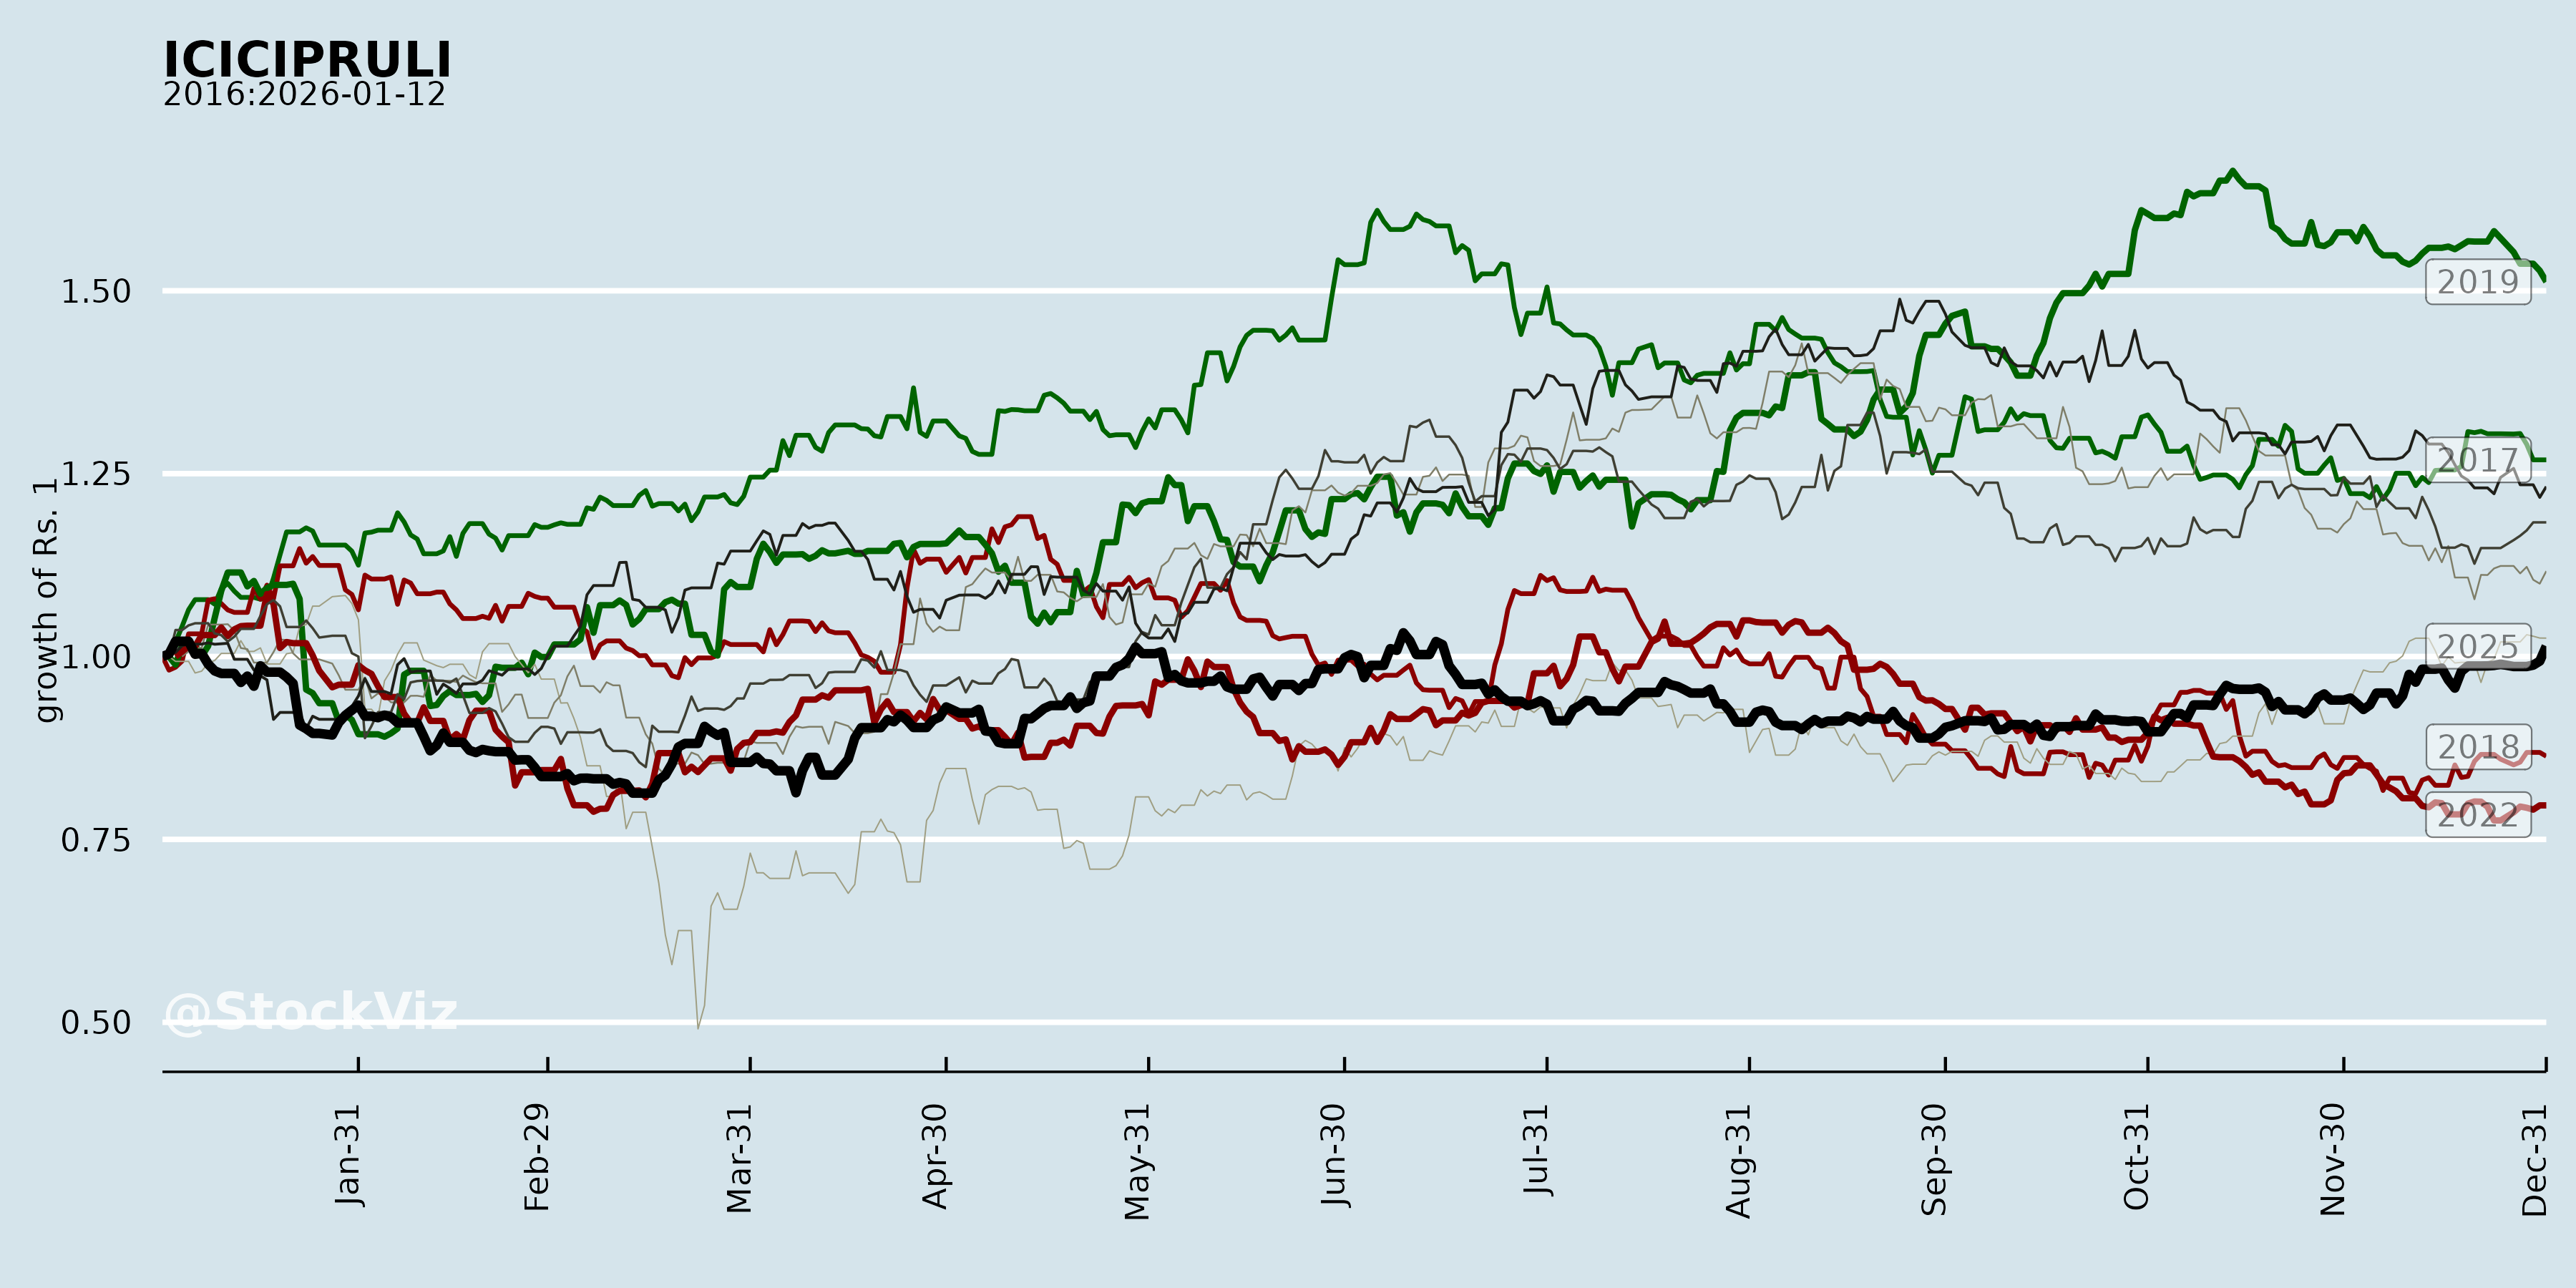
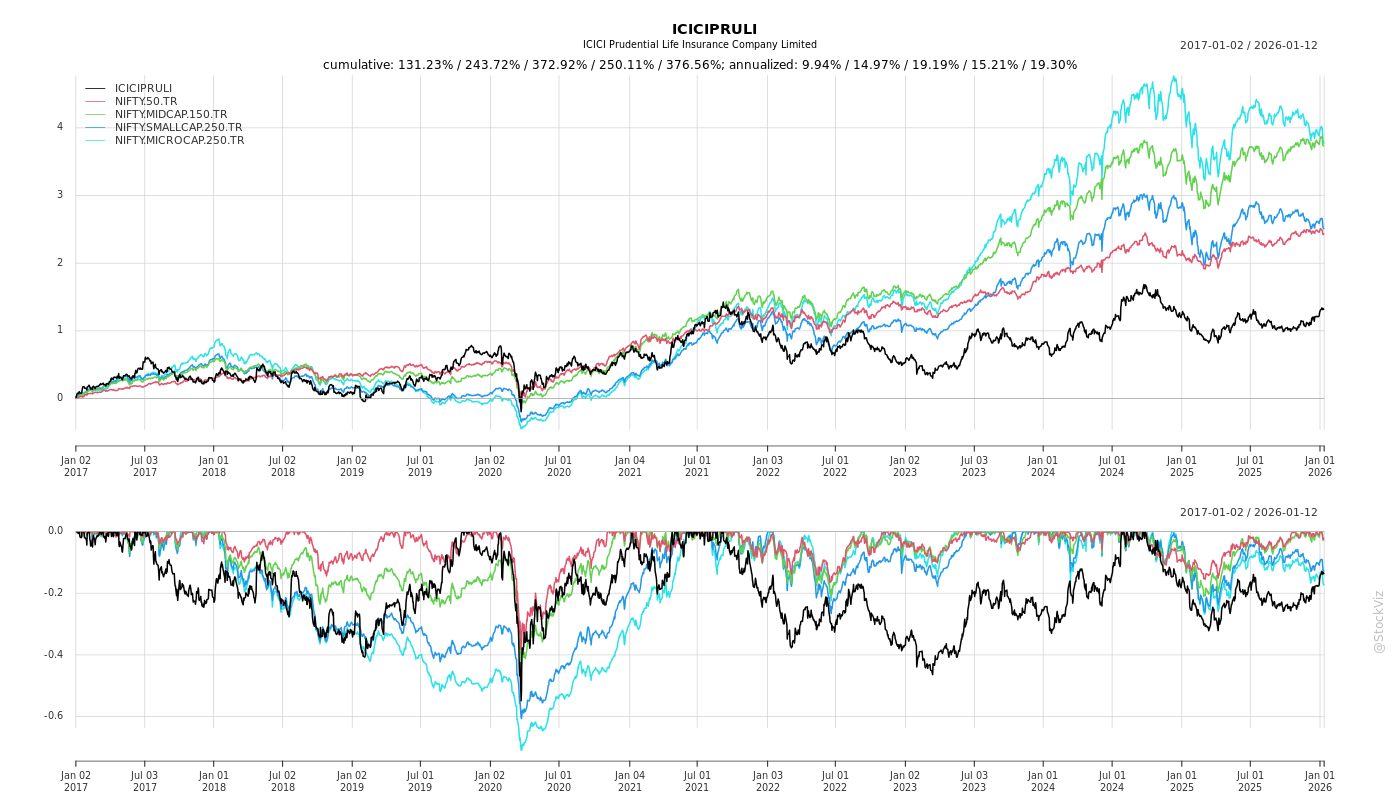
Cumulative Returns and Drawdowns
Fundamentals

Ownership
Margined
AI Summary
asof: 2026-09-16
ICICI Prudential Life Insurance — Recent Corporate Announcements
1. Headwinds and Challenges
- Cost ratio pressure at the aggregate level. Cost/Total Premium rose to 21.8% in Q1-FY2027 from 21.2% in Q1-FY2026 (a 60 bps increase), even as the savings line-of-business cost ratio improved to 13.6% from 14.1% (a 50 bps reduction). Total expenses grew 17.8% year-on-year against total premium growth of 14.5%.
- Persistency deterioration at the shorter tenors. 13th-month persistency declined to 84.0% at June 30, 2026 from 86.0% at June 30, 2025 and 84.5% at March 31, 2026. 25th-month persistency fell more sharply to 77.0% at June 30, 2026 from 83.4% a year earlier and 81.0% at March 31, 2026. Longer-tenor ratios (37th, 49th, 61st month) were broadly stable or improved.
- Non-linked savings contraction. Non-linked savings APE declined 9.5% year-on-year in Q1-FY2027 (₹4.00 bn to ₹3.62 bn), with its share of APE falling from 21.5% to 16.9%.
- Agency channel stagnation. Agency APE grew only 2.0% year-on-year, and its share of total APE fell from 24.3% to 21.7%.
- Credit life segment flatness. The presentation notes the credit life segment remained flat due to MFI (microfinance institution) headwinds, even as retail protection grew strongly partly aided by GST reforms.
- Negative operating variances in EV movement. FY2026 EV movement shows operating assumption changes plus operating variance of negative ₹4.81 bn, comprising negative persistency and other variance of ₹2.64 bn and negative operating assumption changes of ₹2.56 bn. Economic assumption change and investment variance was negative ₹7.78 bn in FY2026.
- Declining ROEV. Return on embedded value declined to 11.9% in FY2026 from 13.1% in FY2025 and 14.1% in FY2024.
- VNB growth volatility. FY2026 VNB year-on-year growth was 10.9%, following a decline of 3.2% in Q1-FY2026.
2. Tailwinds and Growth Prospects
- Strong headline growth in Q1-FY2027. APE grew 14.6% year-on-year to ₹21.36 bn (3-yr CAGR 13.2%); total premium grew 14.5% to ₹102.51 bn; retail sum assured grew 45.9% to ₹1,134.13 bn; VNB grew 24.9% to ₹5.71 bn; profit after tax grew 27.8% to ₹3.86 bn.
- VNB margin expansion. VNB margin rose to 26.7% in Q1-FY2027 from 24.5% in Q1-FY2026 and 24.7% in FY2026.
- Protection as a growth engine. Protection APE grew 45.7% year-on-year to ₹5.96 bn; retail protection APE grew 60.4% to ₹2.23 bn. Protection’s share of APE rose from 21.9% to 27.9%. New business sum assured grew 31.8% and new business retail sum assured grew 45.9%. Sum assured market share was 11.8% in Q1-FY2027.
- Annuity and group funds growth. Annuity APE grew 33.0% to ₹1.33 bn; group funds APE grew 42.2% to ₹1.18 bn; group APE grew 38.8% to ₹4.90 bn.
- Partnership distribution momentum. Partnership distribution APE grew 29.5% to ₹3.12 bn, with its share rising from 12.9% to 14.6%.
- Solvency strength. Solvency ratio was 225.4% at June 30, 2026, up from 212.3% at June 30, 2025 (227.3% at March 31, 2026).
- Asset quality. 95.0% of fixed income in sovereign or AAA; 99.8% of fixed income AA and above; zero NPA since inception.
- Industry opportunity. The presentation cites a protection gap of $16.5 tn for FY2020, individual protection sum assured at 27% of GDP versus Malaysia at 153% and Thailand at 143%, pension assets at 11% of GDP versus Hong Kong at 65%, US at 146% and Australia at 162%, and life insurance at 17% of household financial savings at March 31, 2024.
- Digital and operational metrics. ~58% of policies issued using digital KYC in Q1-FY2027; ~54% of savings policies issued same day; 97.0% of service interactions via self-help/digital modes; ~27 mn digital service interactions in Q1-FY2027; 5.1 mn+ cumulative app downloads.
- AI-driven savings. ~₹900 mn in savings from onboarding automation; ~₹1,100 mn in savings from claims automation.
3. Key Risks
- Interest rate sensitivity. Sensitivity analysis shows a 100 bps increase in reference rates reduces VNB margin by 1.4 and EV by 1.8% in FY2026; a 100 bps decrease increases VNB margin by 0.6 and EV by 1.6%. 66.2% of liabilities largely pass on market performance to customers; derivatives are used to hedge interest rate risks on non-par guaranteed savings, protection and annuities.
- Mortality/morbidity risk. A 10% increase in mortality/morbidity rates reduces VNB margin by 4.6 and EV by 2.6% in FY2026.
- Discontinuance (persistency) risk. A 10% increase in discontinuance rates reduces VNB margin by 1.9 and EV by 0.6% in FY2026.
- Expense risk. A 10% increase in acquisition expenses reduces VNB margin by 4.7 (no EV impact); a 10% increase in maintenance expenses reduces VNB margin by 0.7 and EV by 0.6%.
- Tax risk. Tax rates increased to 25% would reduce VNB margin by 2.5 and EV by 6.6% in FY2026.
- Equity market risk. A 10% decrease in equity values reduces VNB margin by 0.3 and EV by 1.5%.
- Regulatory and approval risk on the name change. The proposed change of name from ‘ICICI Prudential Life Insurance Company Limited’ to ‘ICICI Life Insurance Limited’ is subject to approval of the Registrar of Companies, Ministry of Corporate Affairs, the Insurance Regulatory and Development Authority of India, the stock exchanges and other appropriate regulatory and statutory authorities, and becomes effective only upon issuance of a fresh certificate of incorporation.
- Promoter re-classification dependency. The name change is intended to align corporate identity with the post re-classification structure following Prudential Corporation Holdings Limited’s July 2026 request to re-classify its shareholding from ‘Promoter’ to ‘Investor’ under the IRDAI Registration Regulations 2024.
4. Management Guidance Versus Observed Business Performance
- Name change rationale versus observed performance. The Board approved the proposal to rename the Company as ‘ICICI Life Insurance Limited’ at its meeting on August 13, 2026. The Company states the proposed name reflects strength, trust and legacy associated with the ‘ICICI’ franchise, and that core business operations, strategy and governance frameworks remain unchanged. The Company also states it remains well-positioned to drive sustainable growth, enhance customer outcomes and create long-term value for stakeholders. Observed Q1-FY2027 performance shows APE growth of 14.6%, VNB growth of 24.9%, PAT growth of 27.8% and VNB margin expansion to 26.7%.
- Strategy stated as delivering sustainable VNB growth by balancing business growth, profitability and risk and prudence. Observed: VNB grew 24.9% year-on-year in Q1-FY2027 with margin at 26.7%, versus FY2026 VNB growth of 10.9% at 24.7% margin and Q1-FY2026 VNB decline of 3.2% at 24.5% margin.
- Cost efficiency focus. Observed: savings line-of-business cost ratio improved 50 bps year-on-year to 13.6%, while aggregate cost/total premium rose 60 bps to 21.8%.
- Persistency monitoring. The Company states persistency experience and mortality experience are monitored regularly. Observed: 13th-month persistency declined to 84.0% at June 30, 2026 from 86.0% a year earlier; 25th-month persistency declined to 77.0% from 83.4%.
- Protection and annuity as segments in focus. Observed: protection APE grew 45.7% and retail protection APE grew 60.4%; annuity APE grew 33.0% in Q1-FY2027.
- Digital and customer-centricity commitments. Observed: claim settlement ratio of 99.3% for Q1-FY2027 (individual death claims), average settlement TAT of 1.0 day for non-investigated individual claims, early claims ratio of 22% for Q1-FY2027, and 13M persistency of 84.0% at June 30, 2026.
- Dividend. The Board approved an interim dividend of ₹1.65 per share (nominal value ₹10 per share) in the year ended March 31, 2026, alongside a final dividend of ₹1.65 per share.
Broker Narrative
The broker narrative shifted from a bank-centric framing in 2023 — centered on deposit costs, loan yields, and treasury performance — to an insurance-specific discourse by 2026, emphasizing VNB growth, protection/annuity channels, and distribution mix. Margin pressure persisted throughout but morphed from general ‘margin moderation’ to specific ULIP and volume/margin compression risks, while persistency and GST-related cost concerns emerged as new anxiety points. Despite the call upgrading from Neutral to Buy, the intervening years were dominated by recurring DISAPPOINTMENT outcomes, with the final Buy recommendation resting on recovering retail APE, cost efficiency, and valuation appeal rather than the original banking-tailwind thesis.
Fears that came true
- Rising cost of deposits and higher funding costs materialized across the period, contributing to widespread DISAPPOINTMENT outcomes as profitability was squeezed by expensive bulk deposit mixes.
- Margin moderation escalated into confirmed margin compression, with weak volume and margin growth unable to match rising cost structures, as evidenced by nearly two years of relentless negative actual returns from mid-2024 through early 2026.
- Elevated operating expenses flagged as a risk persisted and continued to erode earnings, with the stock failing to recover despite multiple bullish calls from 2023 to 2026.
- Controlled slippages and credit costs proved temporary, as sustained DISAPPOINTMENT outcomes from late 2023 onward indicate credit costs and recoveries did not remain supportive enough to drive outperformance.
Optimism that failed
- Healthy credit growth in Retail and SME segments failed to translate into positive stock returns, as the majority of subsequent reports delivered negative actual outcomes despite this growth driver being cited.
- Deposit accretion from the discontinuance of the INR2k currency note did not provide a durable tailwind, with the stock continuing to underperform in reports issued well after this factor was highlighted.
- Healthy treasury performance due to bond yield moderation was insufficient to offset headwinds, as DISAPPOINTMENT outcomes persisted even when treasury strength was part of the bullish case.
- Improved real rate of return did not materialize into sustained investor confidence, with the stock generating negative returns in most reports spanning 2023 to mid-2026.
Broker Timeline
44 broker calls · 2023-06-01 to 2026-07-20
Copyright © 2023 SAS Data Analytics Pvt. Ltd. All rights reserved.