GROWW
Equity Metrics
January 13, 2026
Billionbrains Garage Ventures Limited
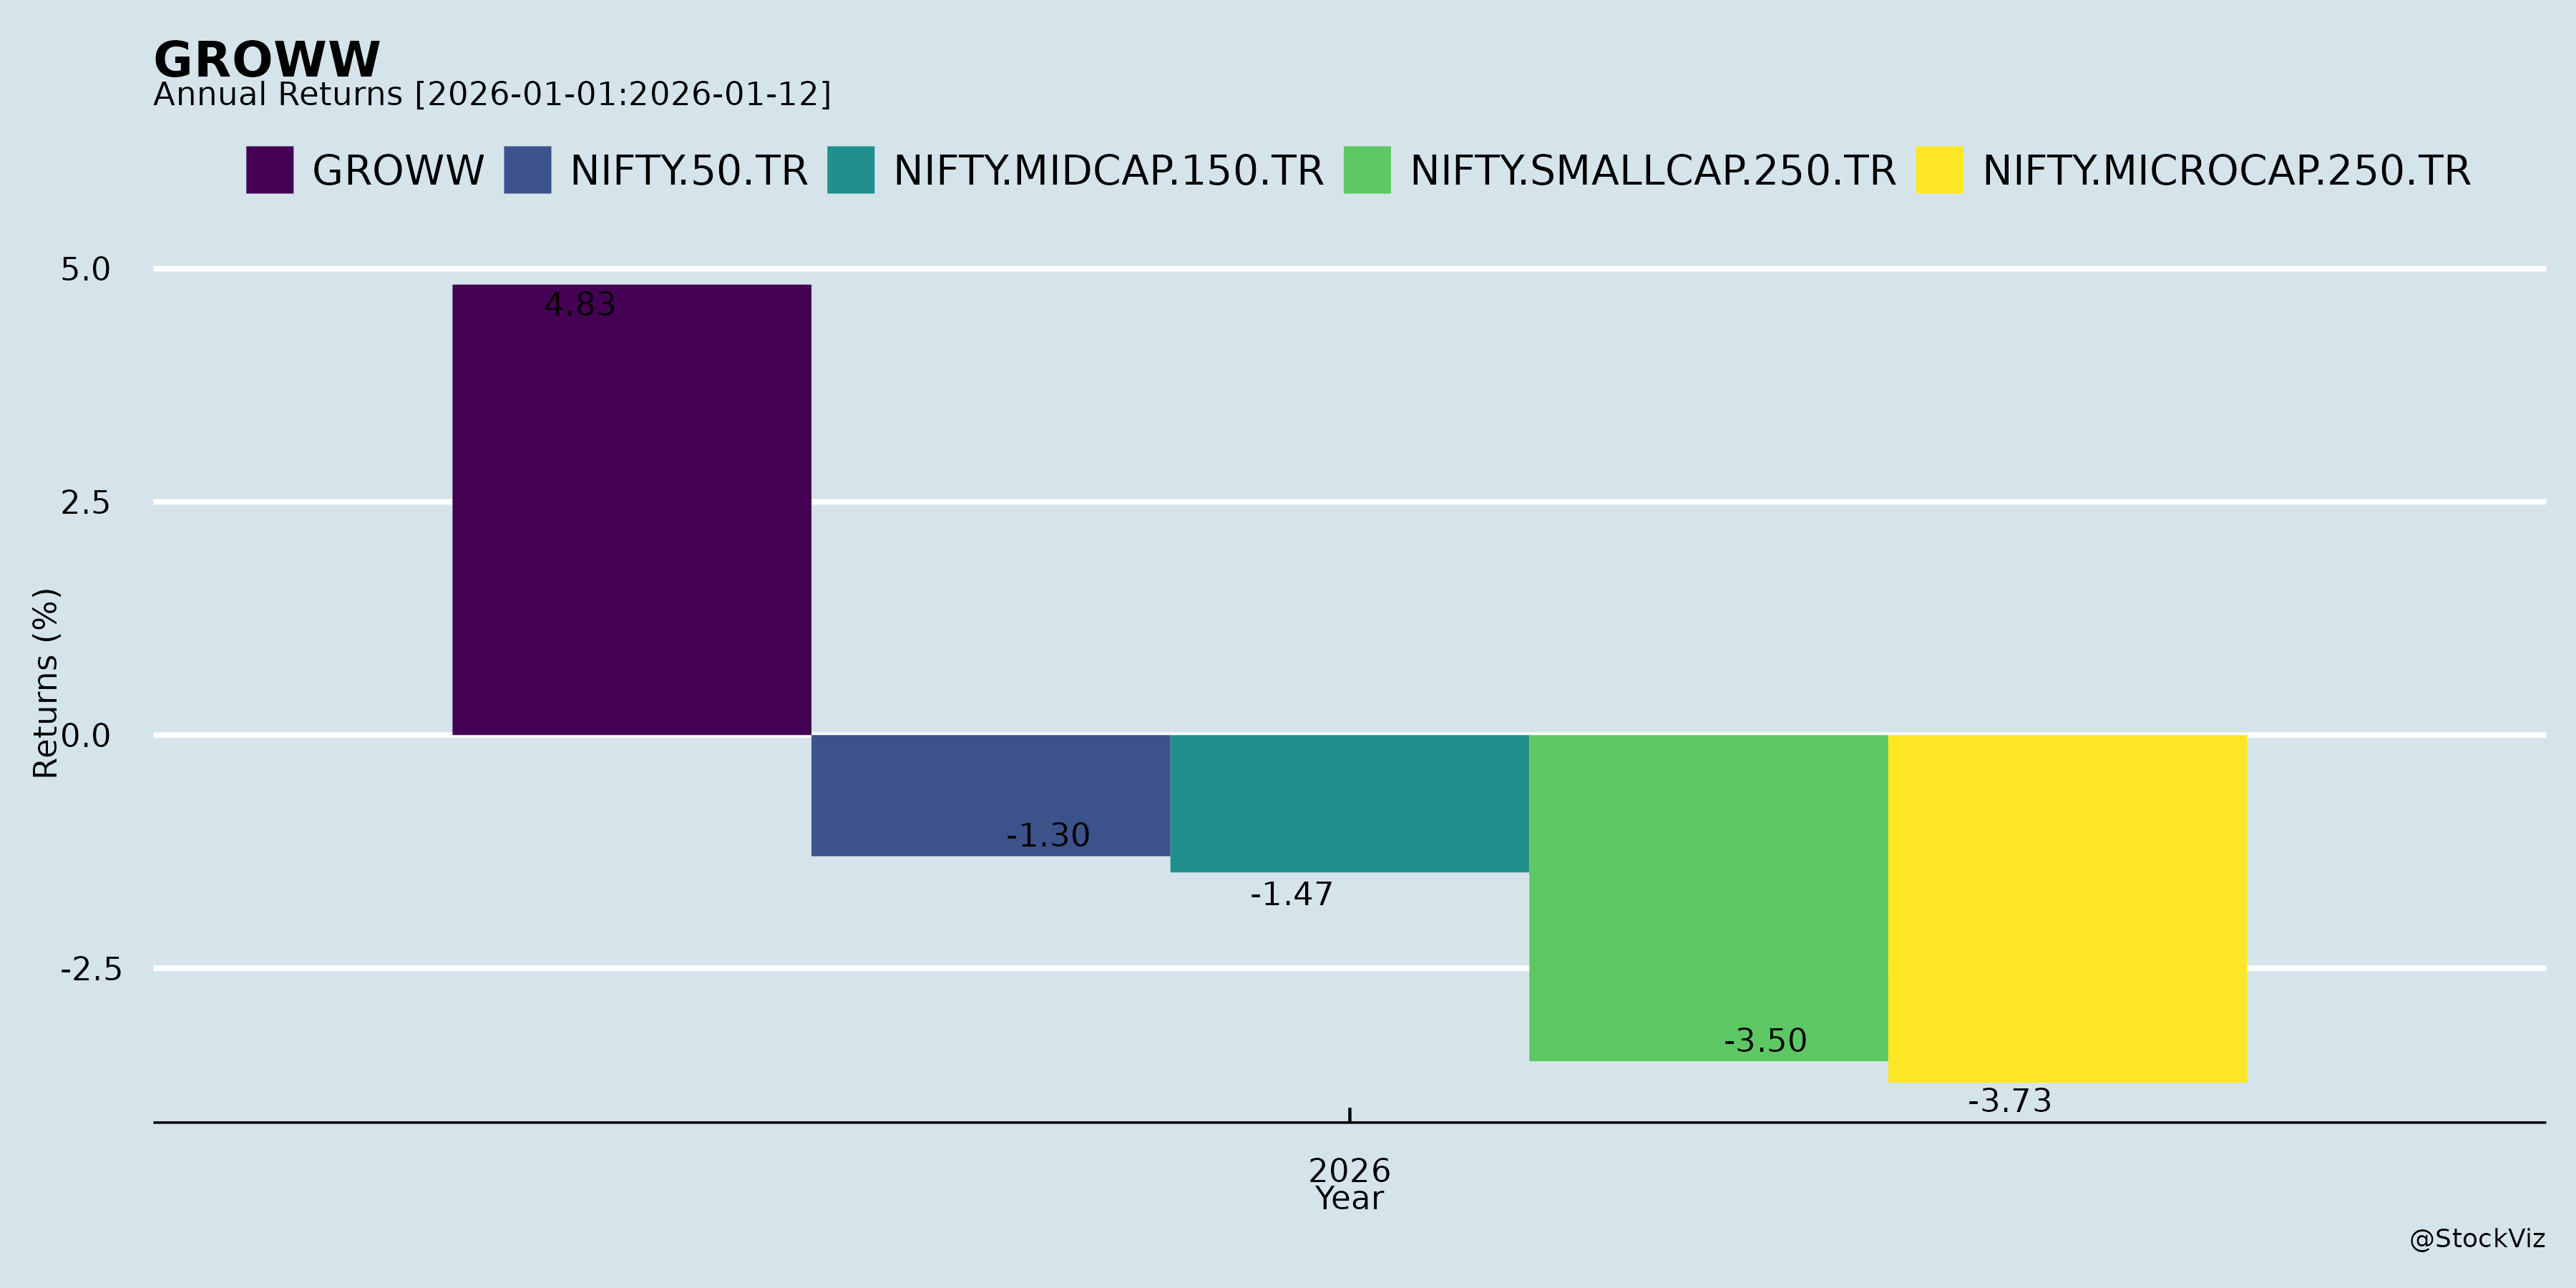
Annual Returns

Cumulative Returns and Drawdowns

Fundamentals
Ownership
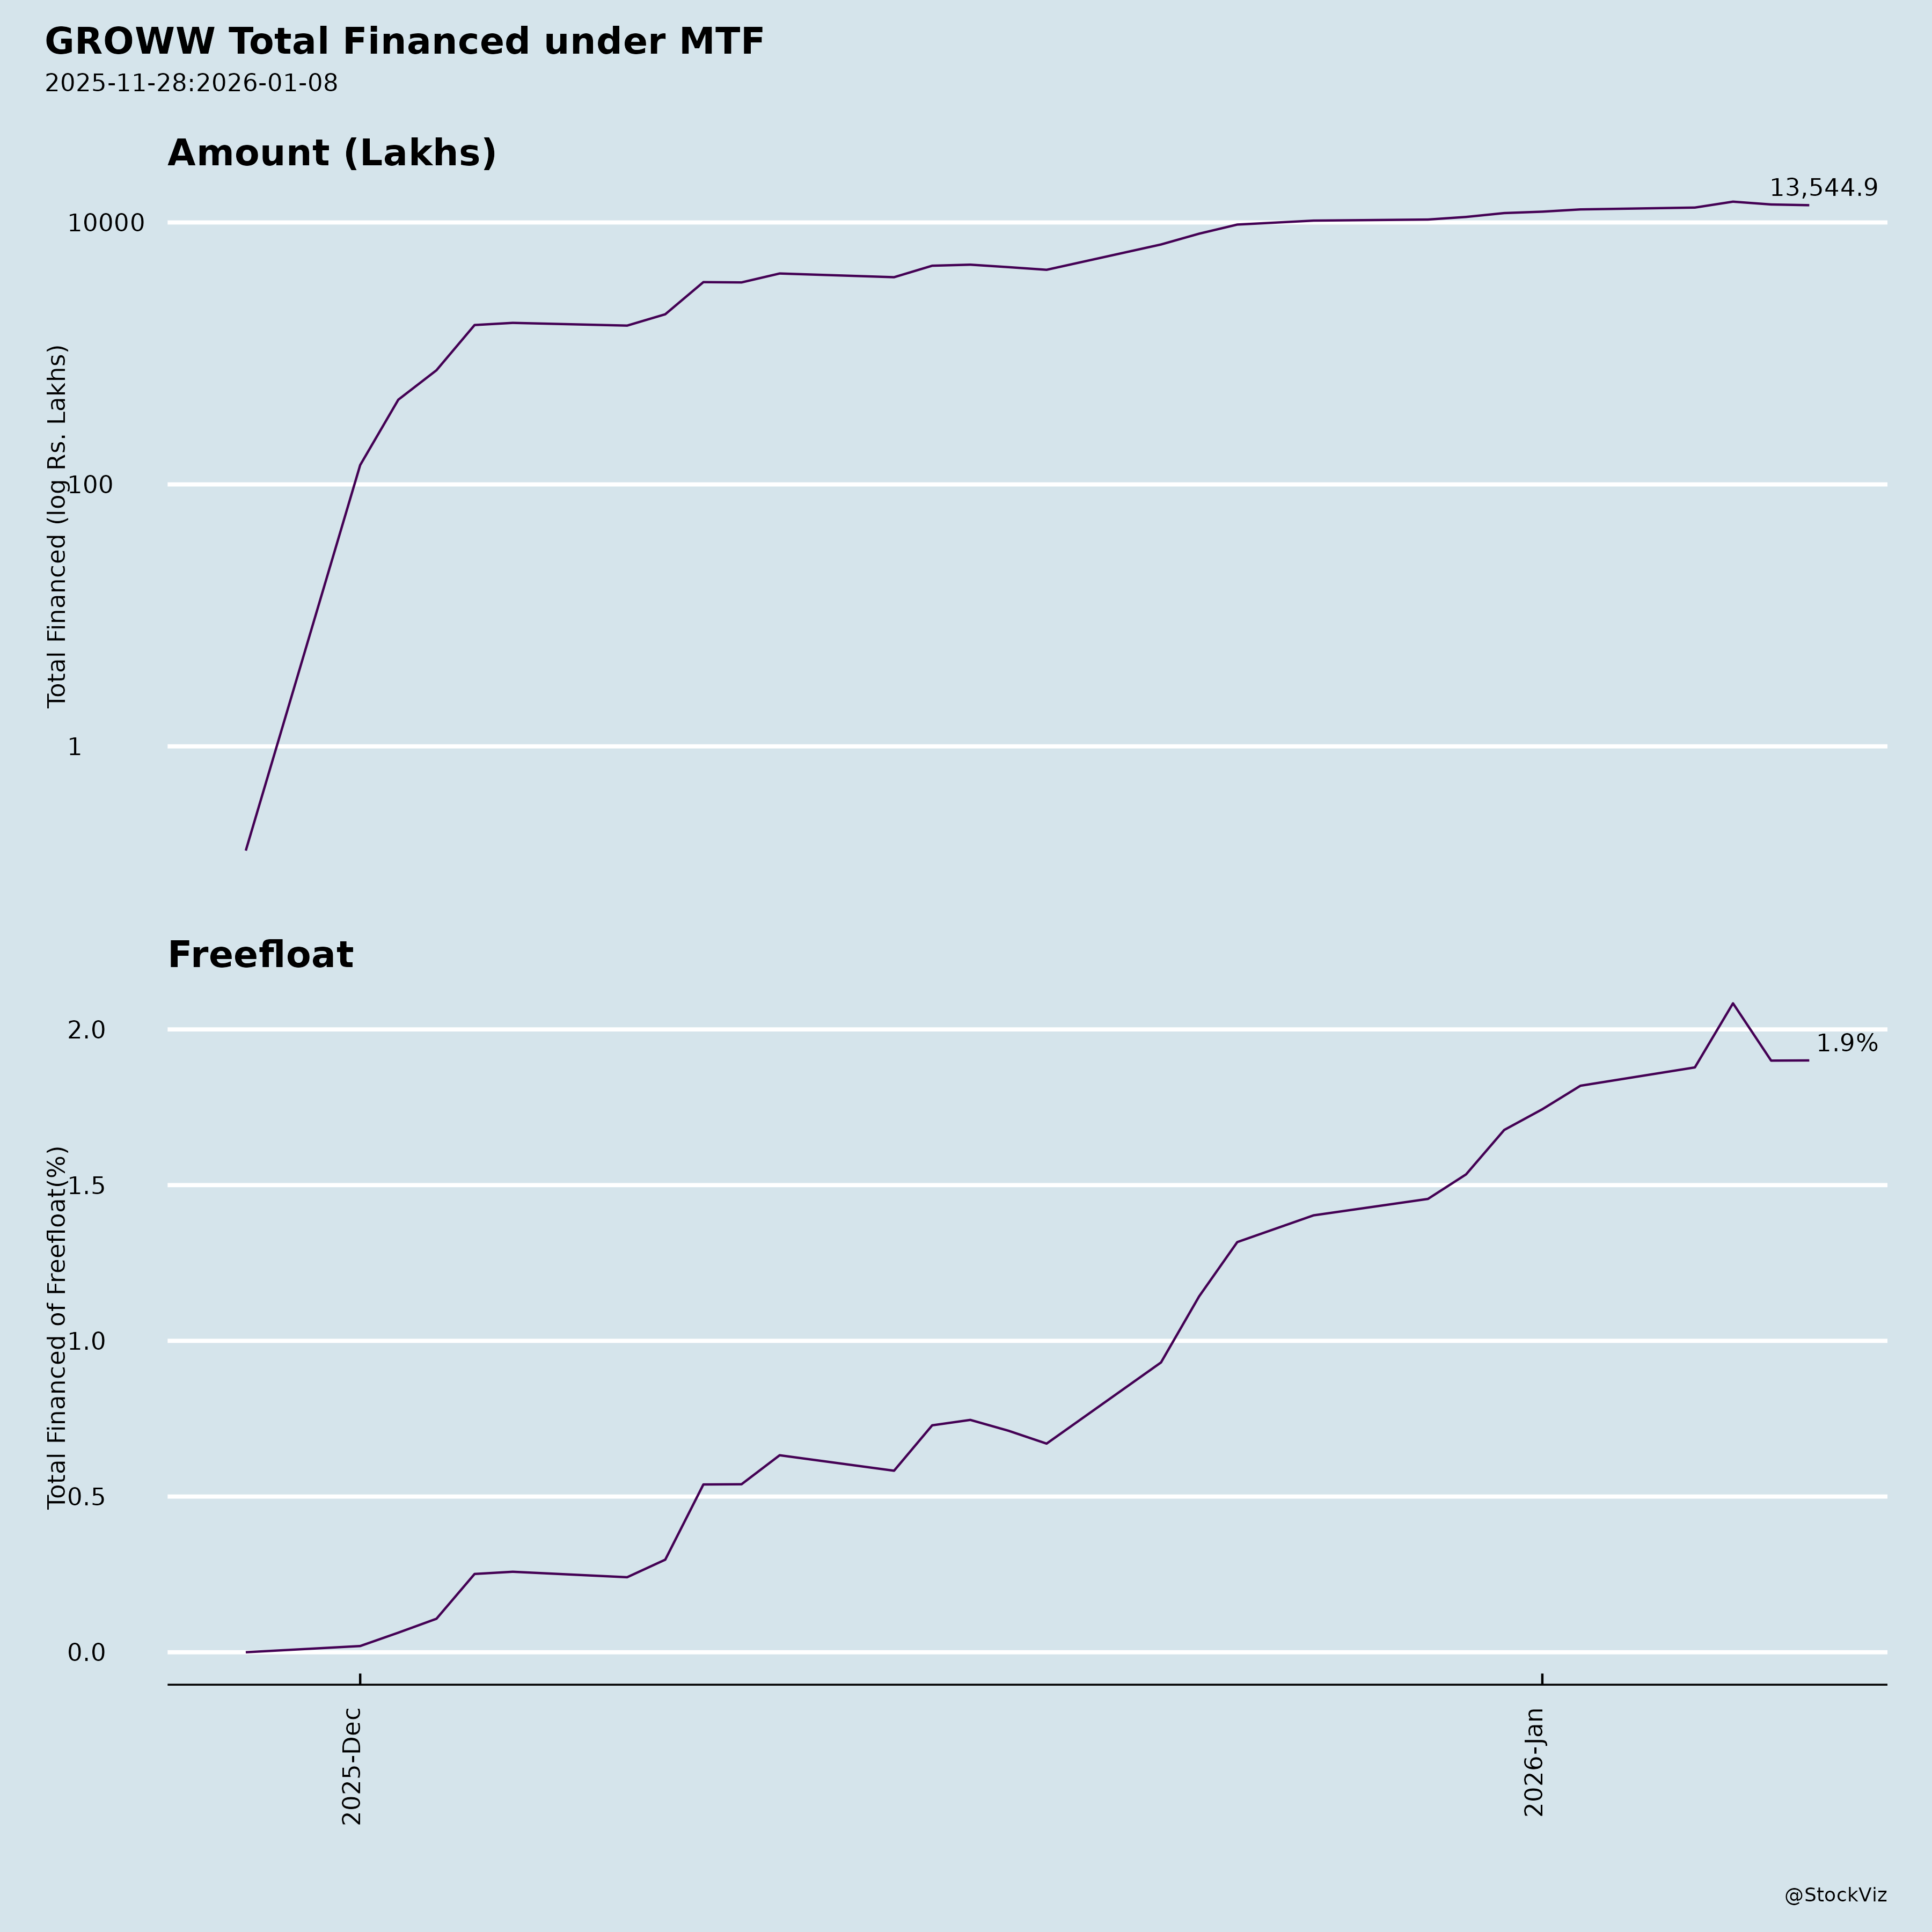
Margined
AI Summary
asof: 2025-12-03
Groww (Billionbrains Garage Ventures Ltd.) Analysis: Headwinds, Tailwinds, Growth Prospects, and Key Risks
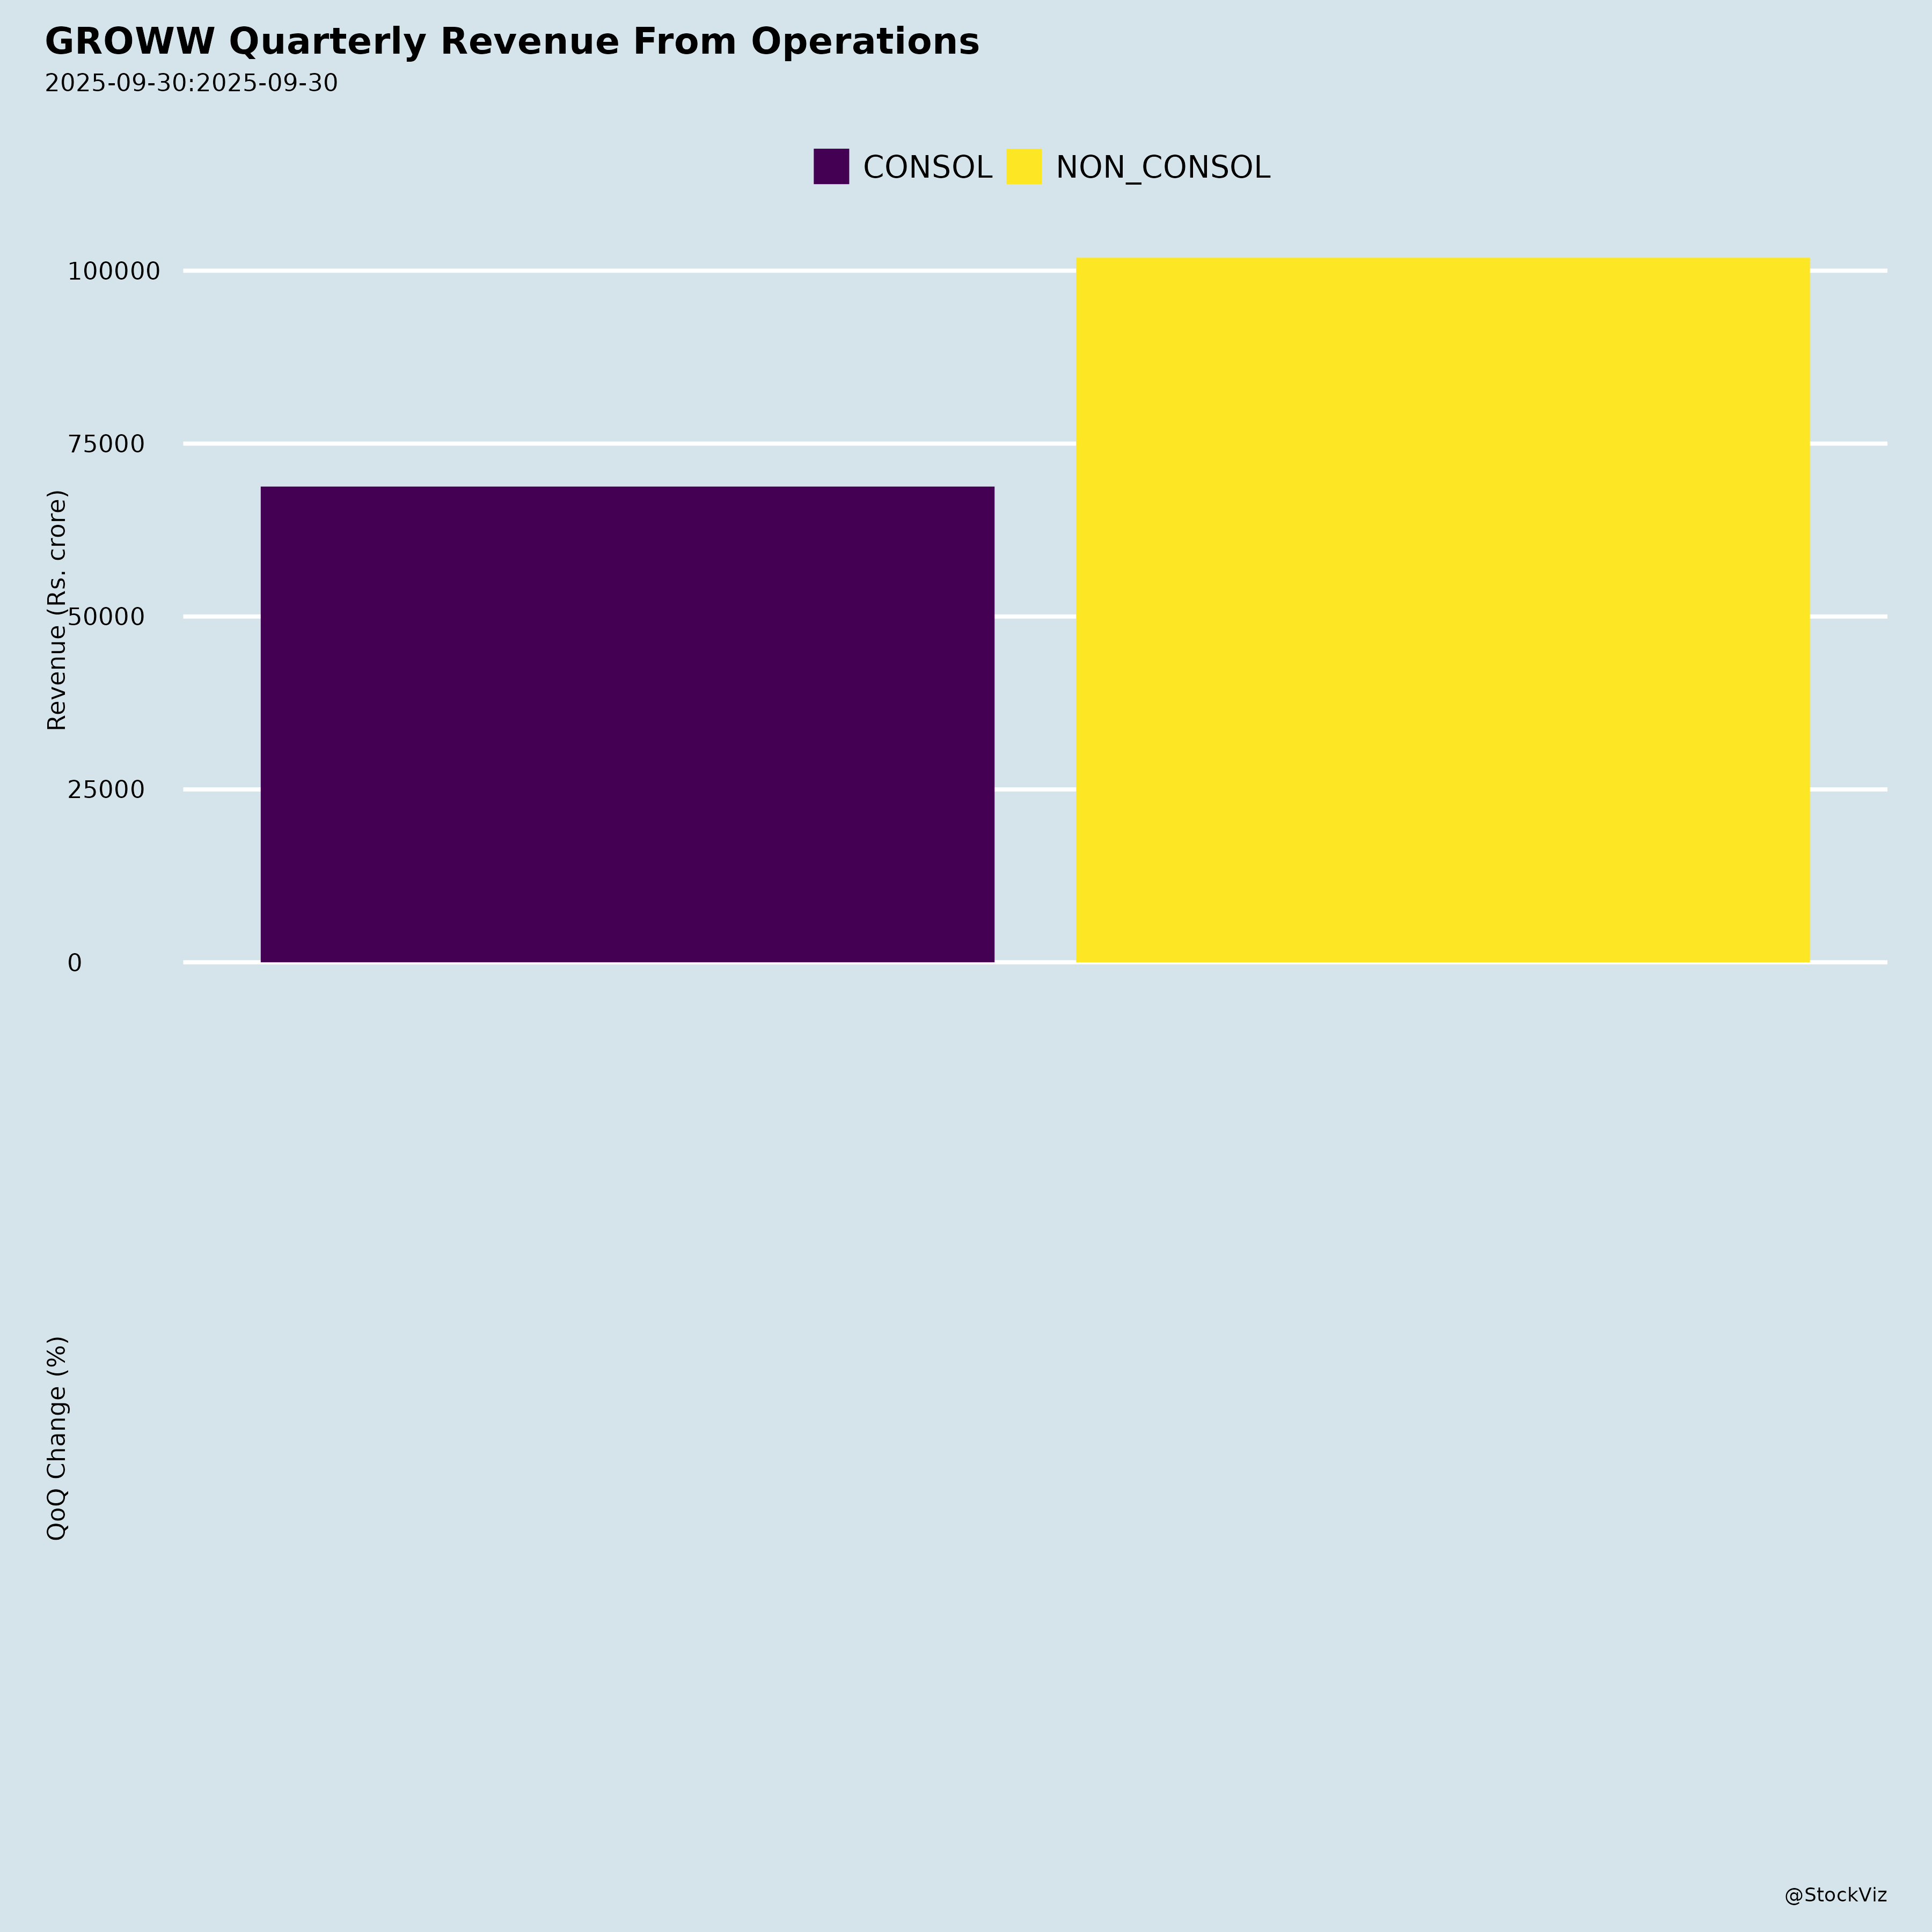
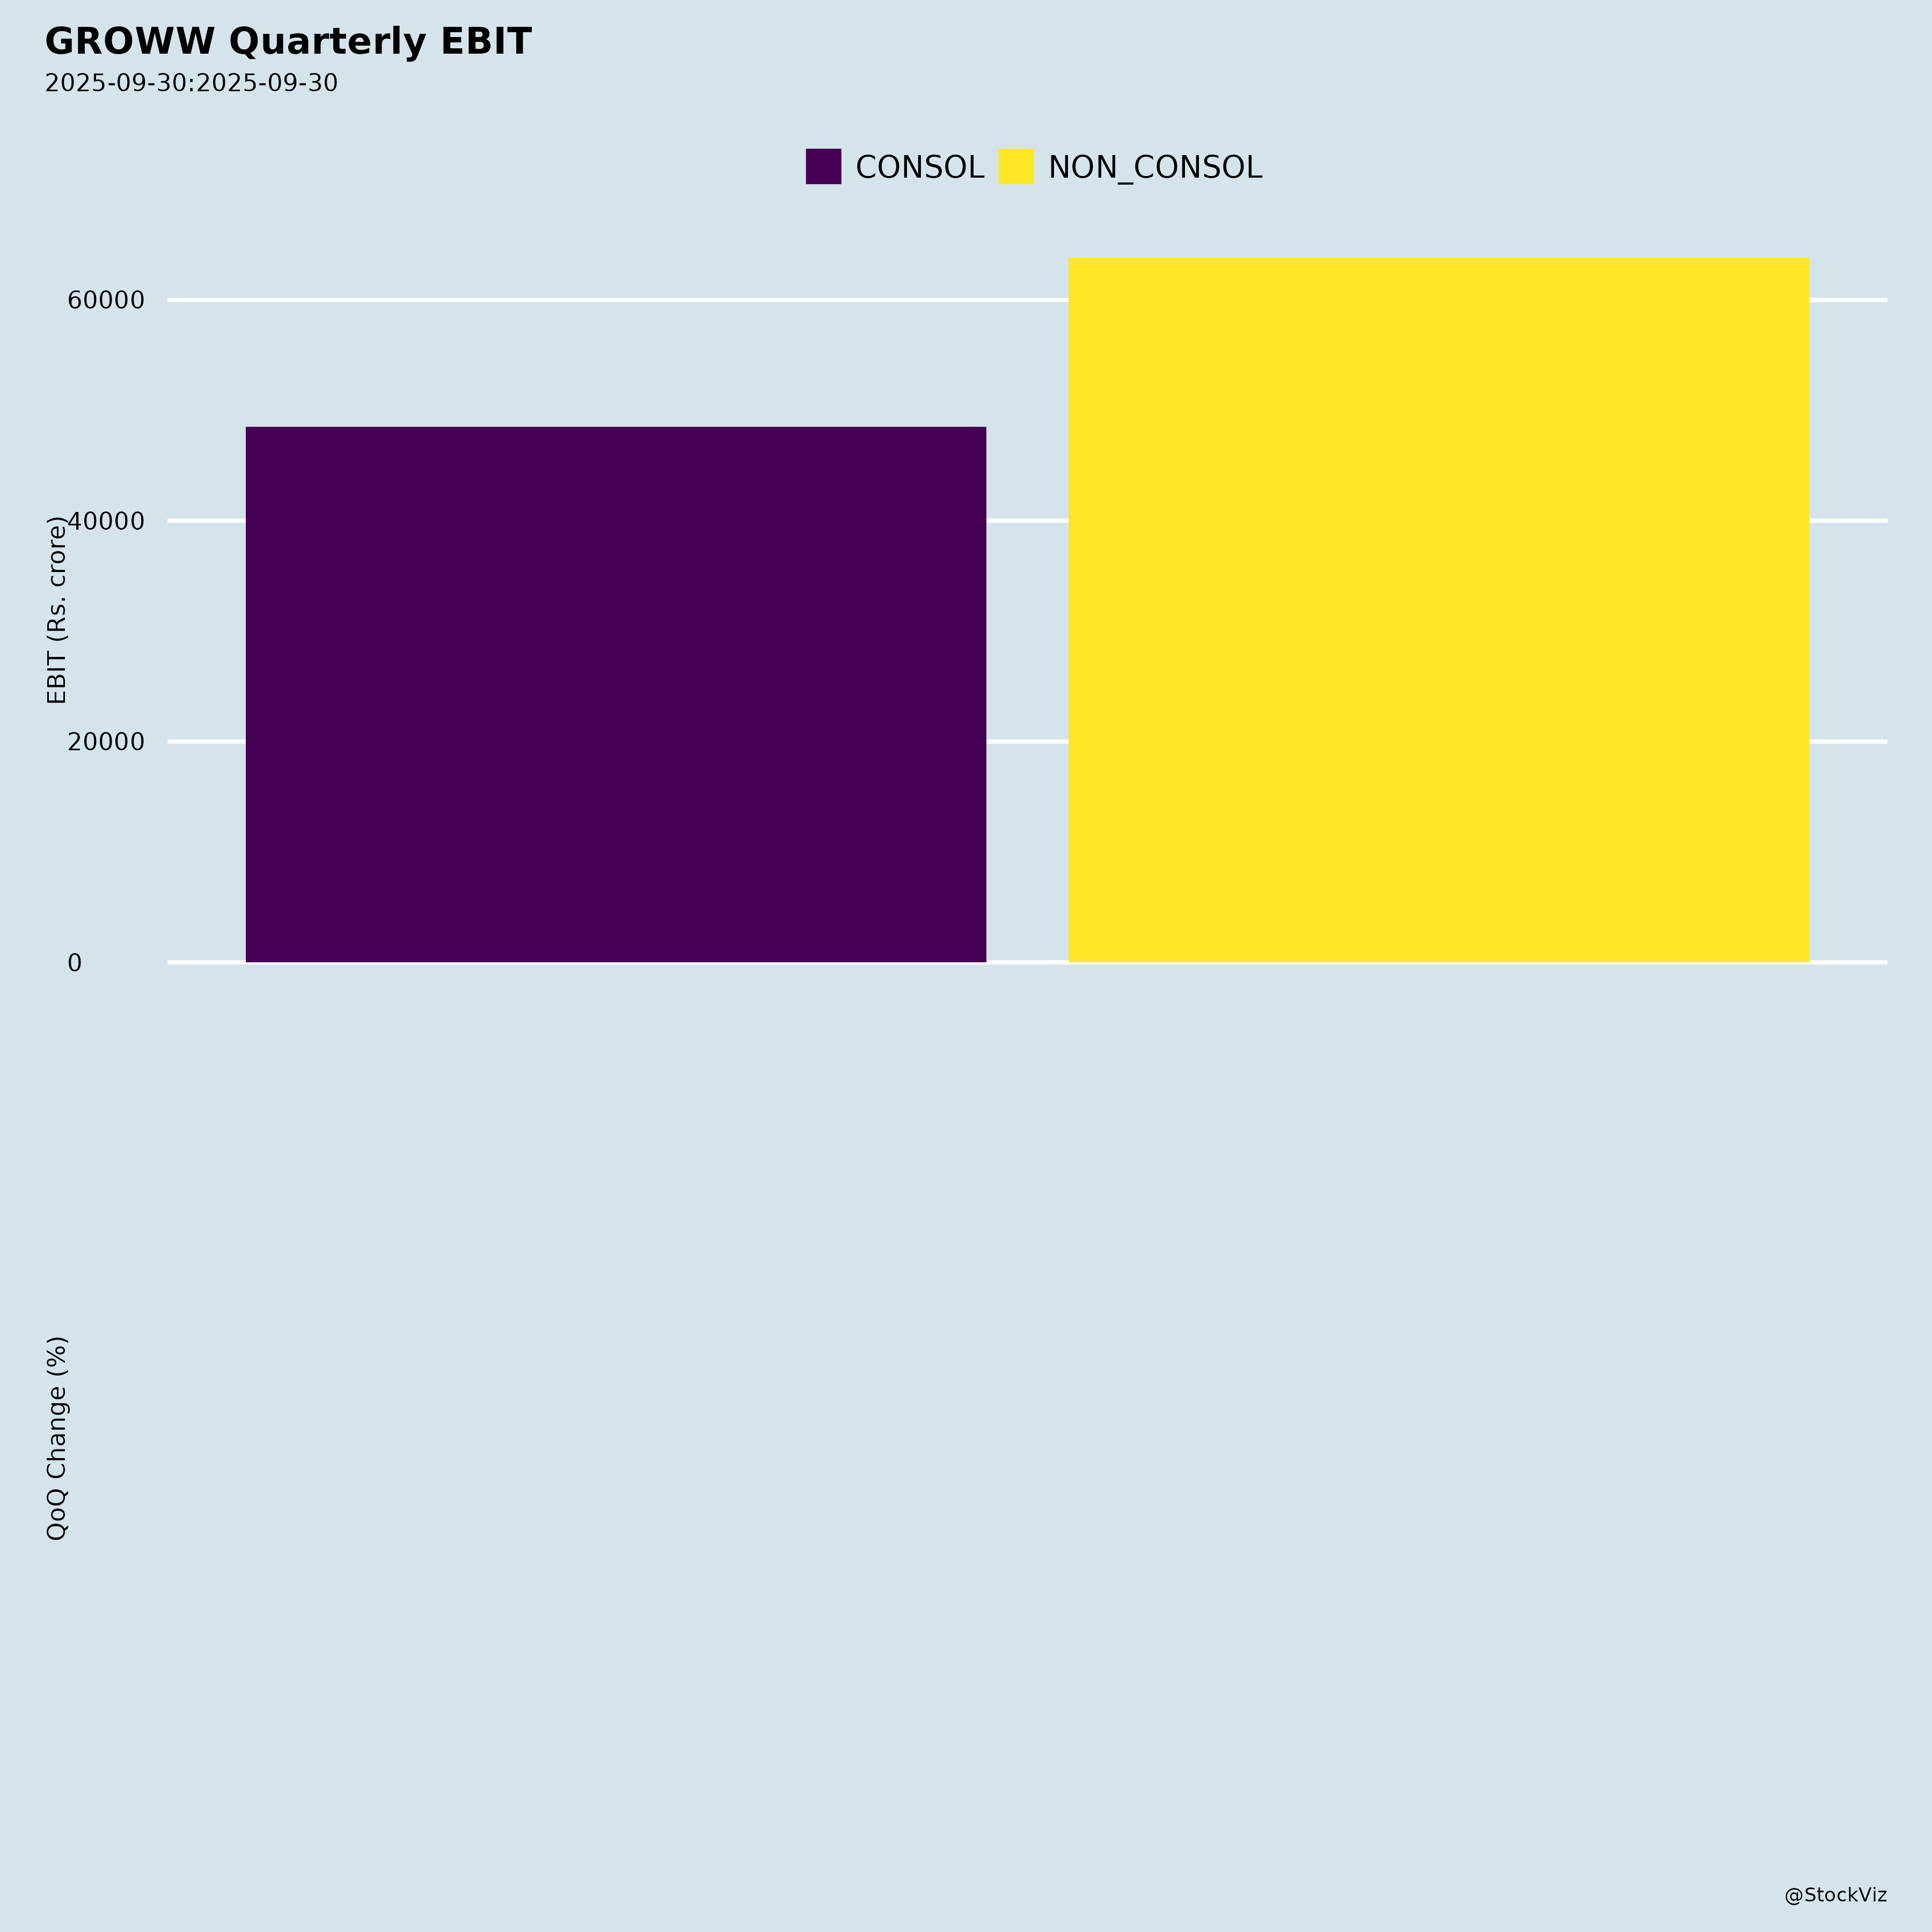
Groww, India’s leading retail investment platform, reported robust Q2 & H1 FY26 results (ended Sep 30, 2025) post-IPO (listed Nov 12, 2025). Consolidated revenue from operations reached ₹10,187 Mn in Q2 (up 13% QoQ), driven by broking (cash ~30%, derivatives ~70% of orders). H1 net profit was ₹8,497 Mn on total income of ₹20,193 Mn. Balance sheet expanded to ₹136,769 Mn assets (goodwill up to ₹13,401 Mn post-Fisdom acquisition). Key themes from earnings call, financials, and disclosures: strong execution in broking/lending, diversification via wealth (Fisdom), but moderating F&O growth and credit risks.
Tailwinds (Positive Momentum)
- Robust Revenue & Profitability: Q2 revenue +13% QoQ; H1 PBT ₹11,409 Mn (margins ~56%). Cost-to-serve declined QoQ due to tech optimizations. Revenue per order up (mix of pricing, MTF, higher ticket sizes).
- Customer & Volume Growth: 80% organic acquisition; high-quality F&O users retained (ARPU +10-20%). New users adopting SIPs/MFs for diversification.
- Product Diversification: Broking dominant (derivatives/cash), but MTF AUM growing fast (yield ~15%, 3-4% of cash ADTO adds ~₹2/order); commodities launched (DTU 20-30k); LAS early-stage (book ₹60 Cr).
- Strategic Acquisitions: Fisdom (wealth/distribution) adds ~3% revenue (mutual funds, PMS/AIF, insurance, unlisted); ₹1,045 Mn rights infusion for integration. Tech-led DNA supports scale.
- Capital Strength: Post-IPO equity ₹11,985 Mn; cash reserves support lending/expansion. Low debt (borrowings down QoQ).
- Market Leadership: Incremental market share > current share; young users maturing (higher orders/AUM).
Headwinds (Challenges)
- CAC Volatility: Q2 spike due to branding/performance marketing; annualizes similar to FY25 but market-dependent.
- F&O Moderation: Active users stable ~1.4 Mn (post-SEBI regs churned low-quality); derivatives mix to decline <50% as cash/commodities/wealth grow.
- Lending Slowdown: Partner disbursements down (market concerns + app transition); unsecured credit losses ~5-7% (₹70 Cr on ~₹1,250 Cr book).
- Acquisition Integration: Fisdom P&L consolidation pending; provisional accounting (finalization within 12 months). Employee base up (832 core +300 CS +500 Fisdom).
- Cost Pressures: Employee expenses ₹1,238 Mn Q2; tech/transaction costs variable with volumes.
- Competitive Intensity: MTF pricing aggression (competitors at 7.99%); broking saturation risks.
Growth Prospects
- Broking Core (High Confidence): Cash ADTO acceleration via MTF/commodities penetration (aim fair share faster in commodities). Target: Derivatives mix <50% in 2 years; overall market share expansion (users young/growing).
- Lending Scale-Up: MTF to double-digit market share in 3 yrs (expands pie); secured (MTF/LAS) prioritized (personal loans book ₹1,140 Cr). Healthy secured/unsecured mix.
- Wealth Ramp: Fisdom synergies (PMS of MFs launched; tech-led advisory). Long runway: Affluent customers shifting to PMS/AIF/insurance/unlisted.
- Platform Flywheel: 10+ products; SIP/MF inflows rising (new users less monetized initially but sticky). 3-yr vision: Tech-led wealth platform, multi-product retention.
- Quantitative Outlook: ARPU stable across vintages; MTF/LAS/commodities to boost yields. H1 cash flows show operating leverage potential despite investments.
| Segment | H1 FY26 Contribution/Key Metric | 3-Yr Aspiration |
|---|---|---|
| Broking | ~95% revenue; 70% deriv orders | Fair share gains; commodities >MTF speed |
| Lending | MTF/LAS books ₹1,200 Cr+ | 10%+ MTF share; AUM-led growth |
| Wealth | ~3% revenue (Fisdom) | Faster growth via integration/PMS |
Key Risks
- Regulatory: SEBI F&O curbs (ongoing churn); lending norms (unsecured scrutiny). No near-term BAU risks noted.
- Credit & Market: 5-7% losses on unsecured; volatility in ADTO/orders (e.g., MTF day-dependent). High trade payables (₹53,885 Mn) signal volume reliance.
- Competition/Execution: MTF pricing wars; Fisdom integration delays (revenue run-rate ~3%, EBITDA negative). Dependency on organic growth (referrals non-commercial).
- Macro/Operational: Equity market downturns hit volumes; cyber/tech uptime (optimizing capacity). Employee retention post-IPO (ESOP exercises).
- Financial: Provisional acquisition accounting; share dilution (CCPS conversion + IPO). Cash burn in early lending/wealth (~₹1,537 Mn H1 op cash flow negative due to loans/taxes).
Overall Summary: Strong Buy Case with tailwinds from diversification/market share outweighing headwinds. FY26 growth ~20-30% revenue feasible via lending/wealth ramp, but monitor F&O regs and credit costs. Valuation supported by 50%+ margins, cash hoard, and India’s retail investing boom (democratization theme). Risks mitigated by tech moat and customer obsession.
Copyright © 2023 SAS Data Analytics Pvt. Ltd. All rights reserved.