FSL
Equity Metrics
January 13, 2026
Firstsource Solutions Limited
Business Process Outsourcing (BPO)/ Knowledge Process Outsourcing (KPO)
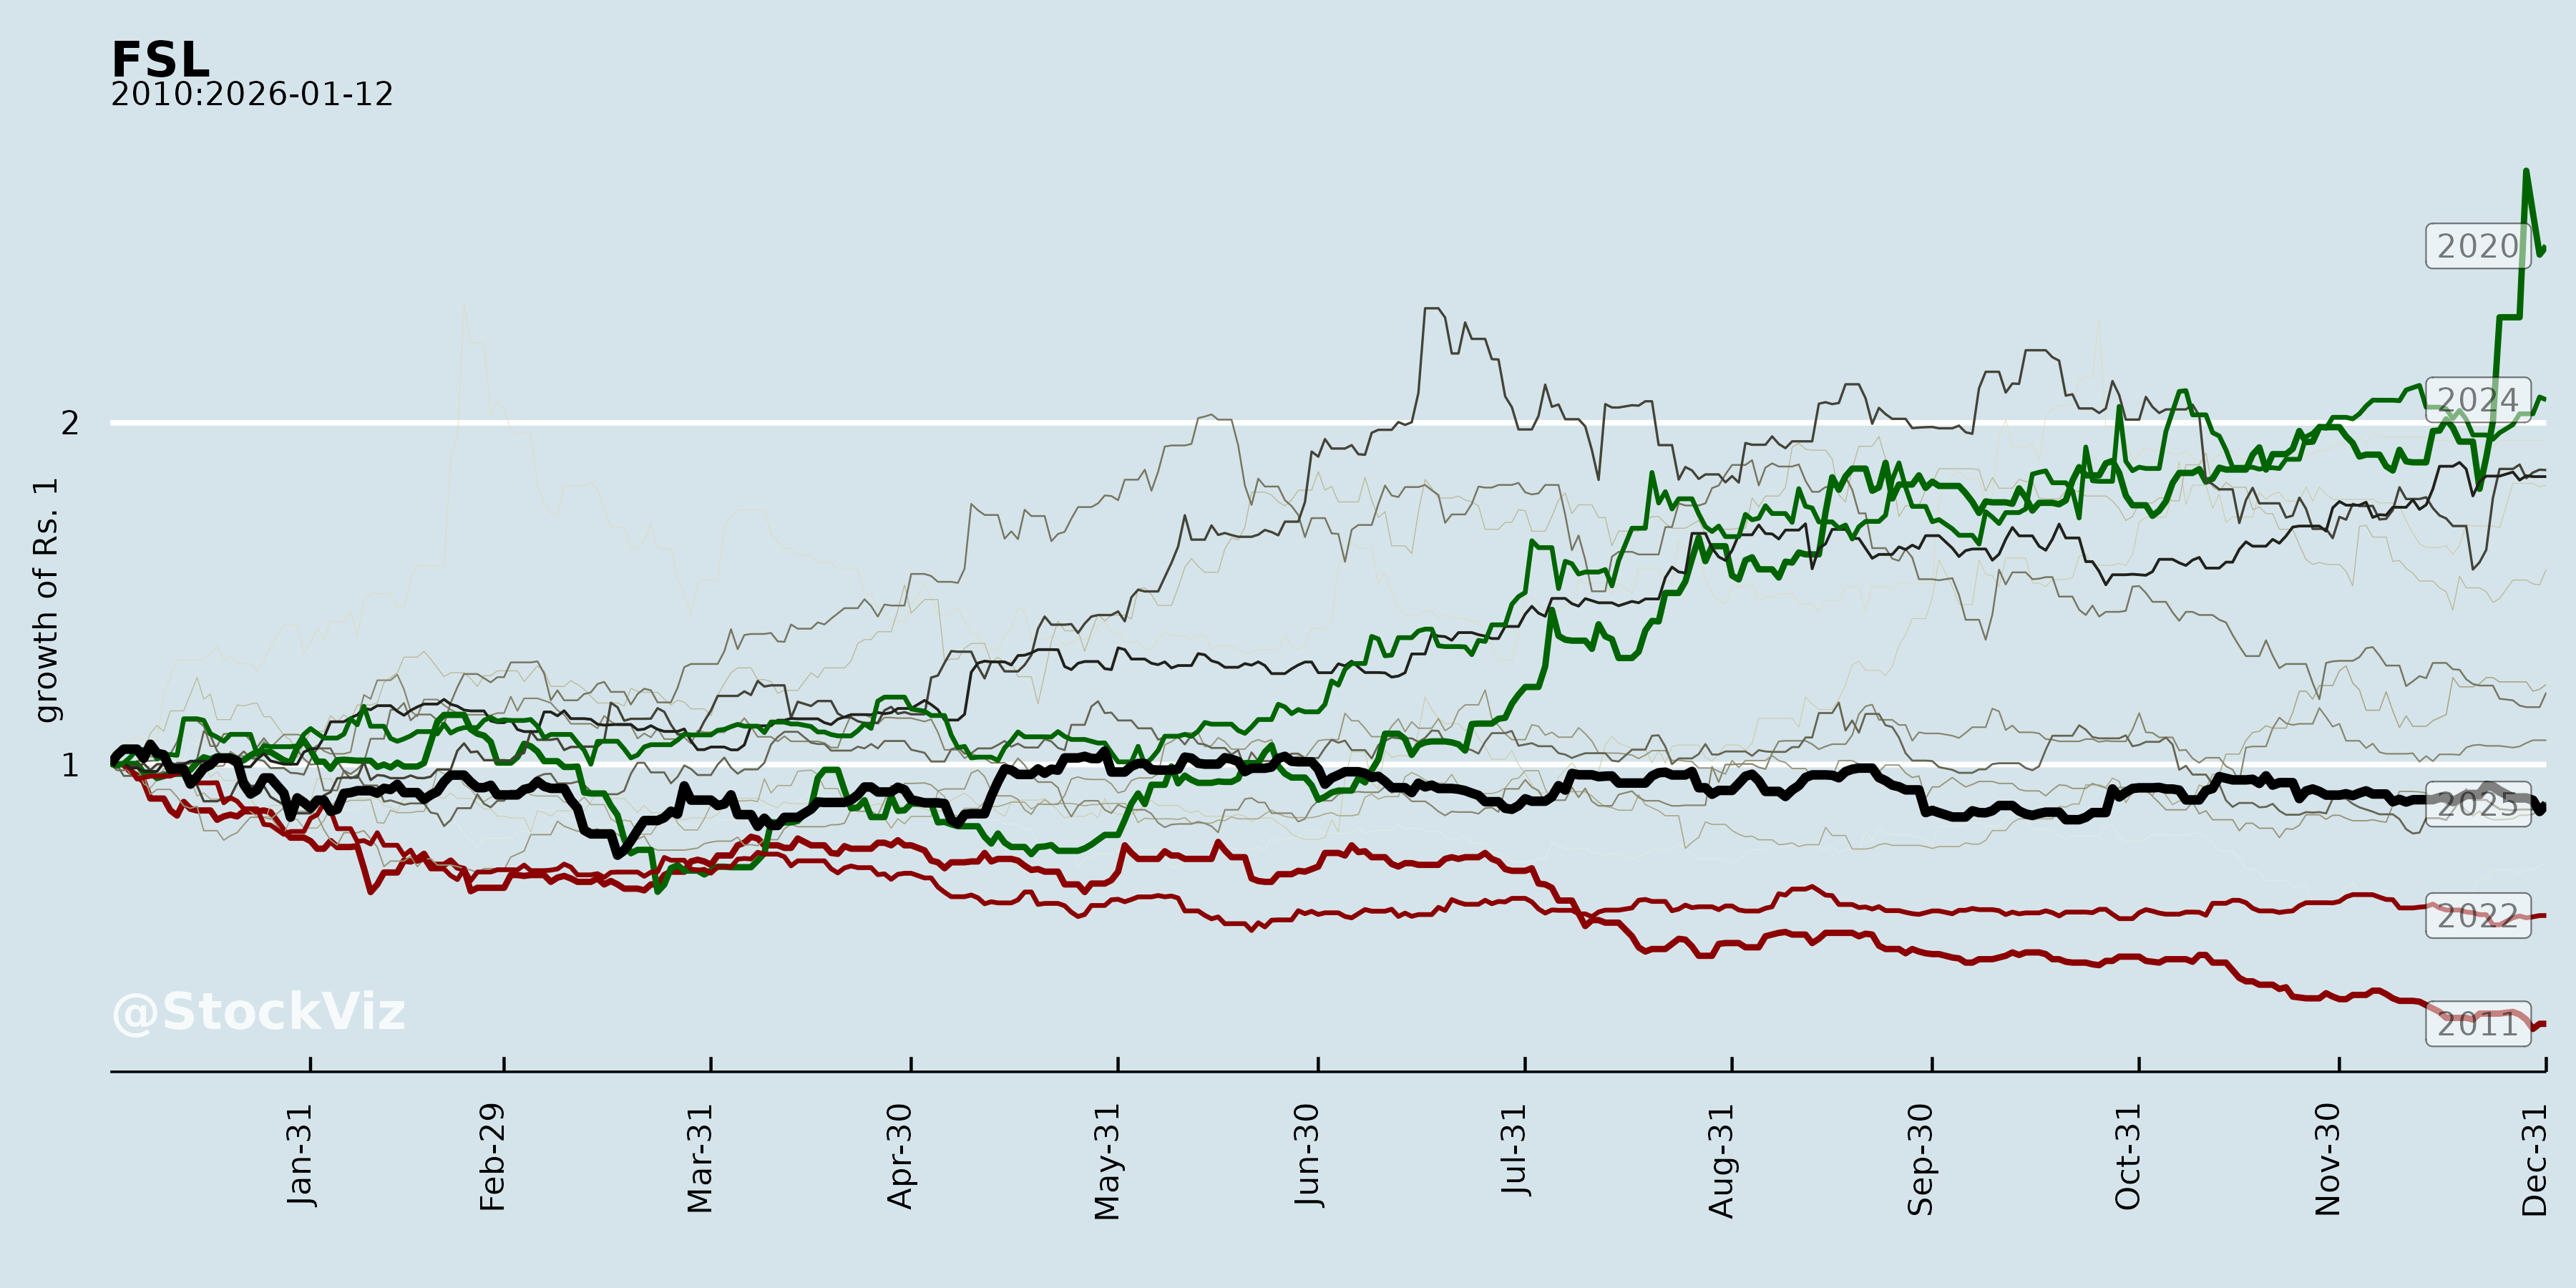
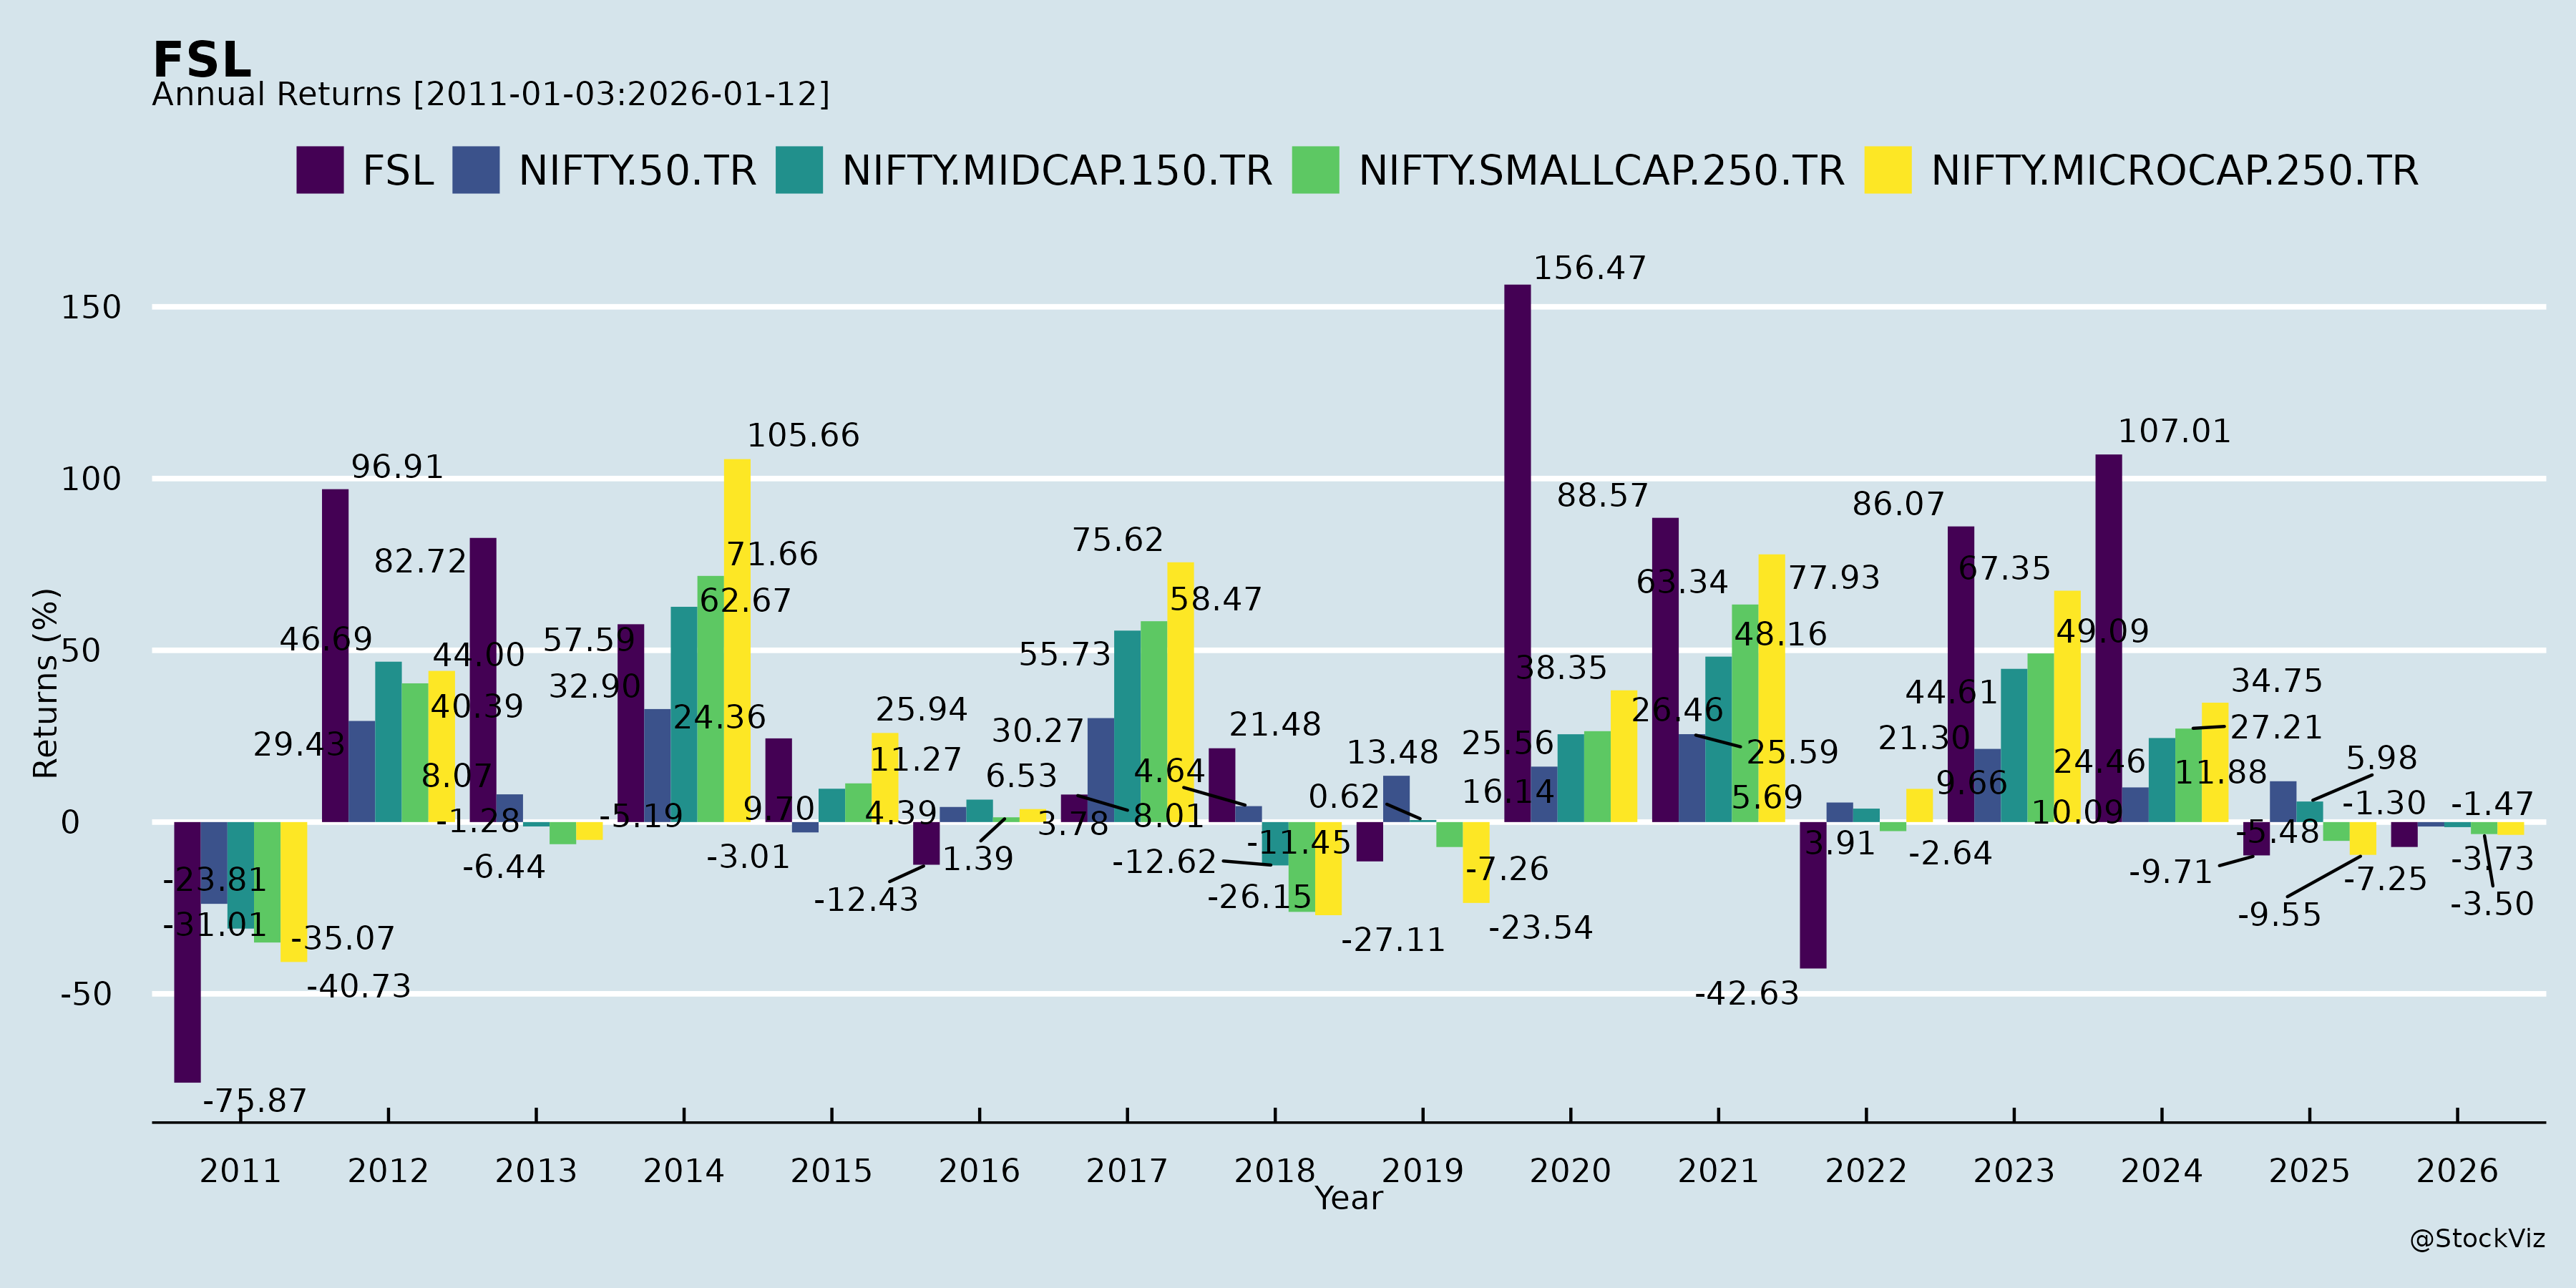
Annual Returns
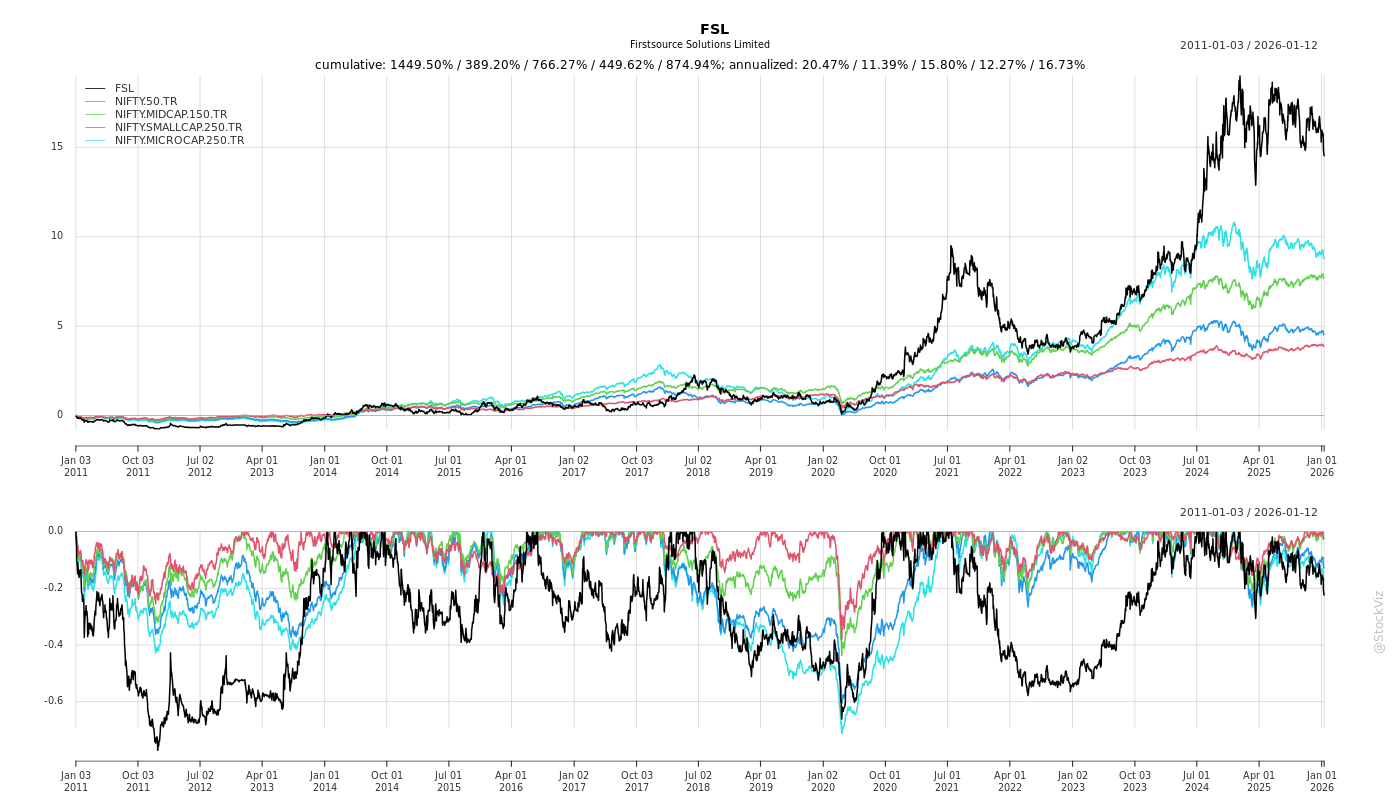
Cumulative Returns and Drawdowns
Fundamentals
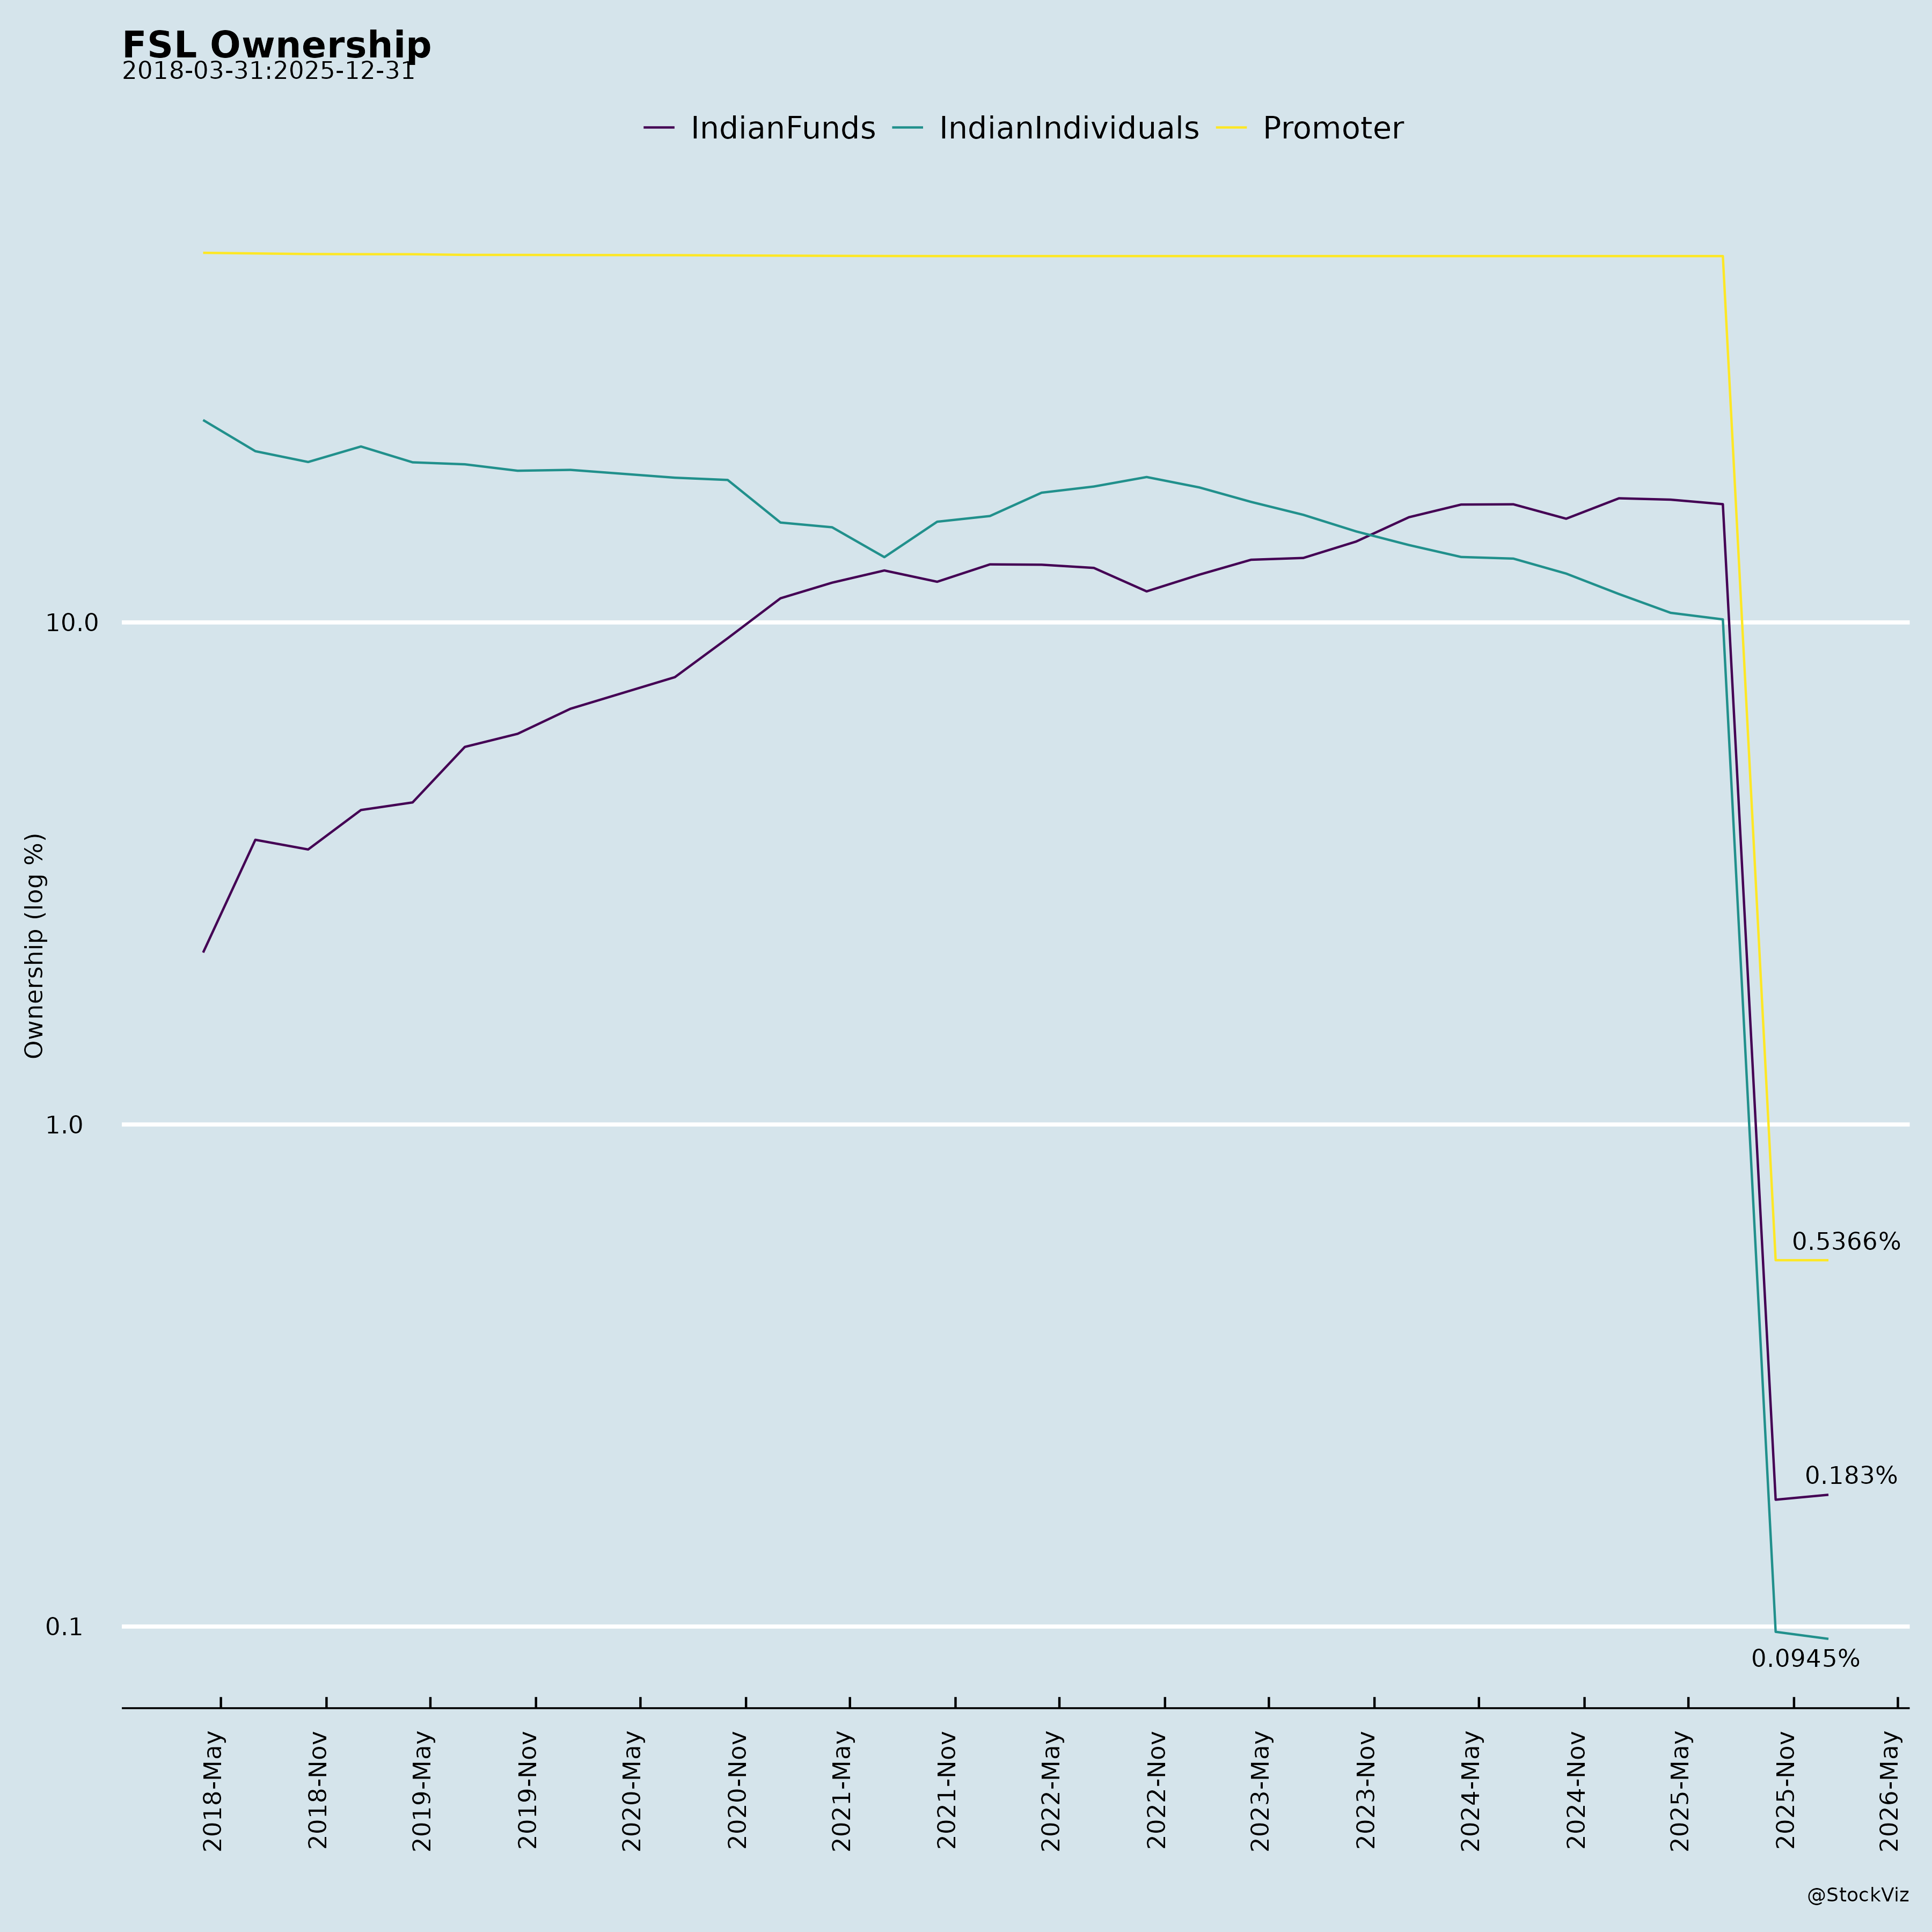
Ownership
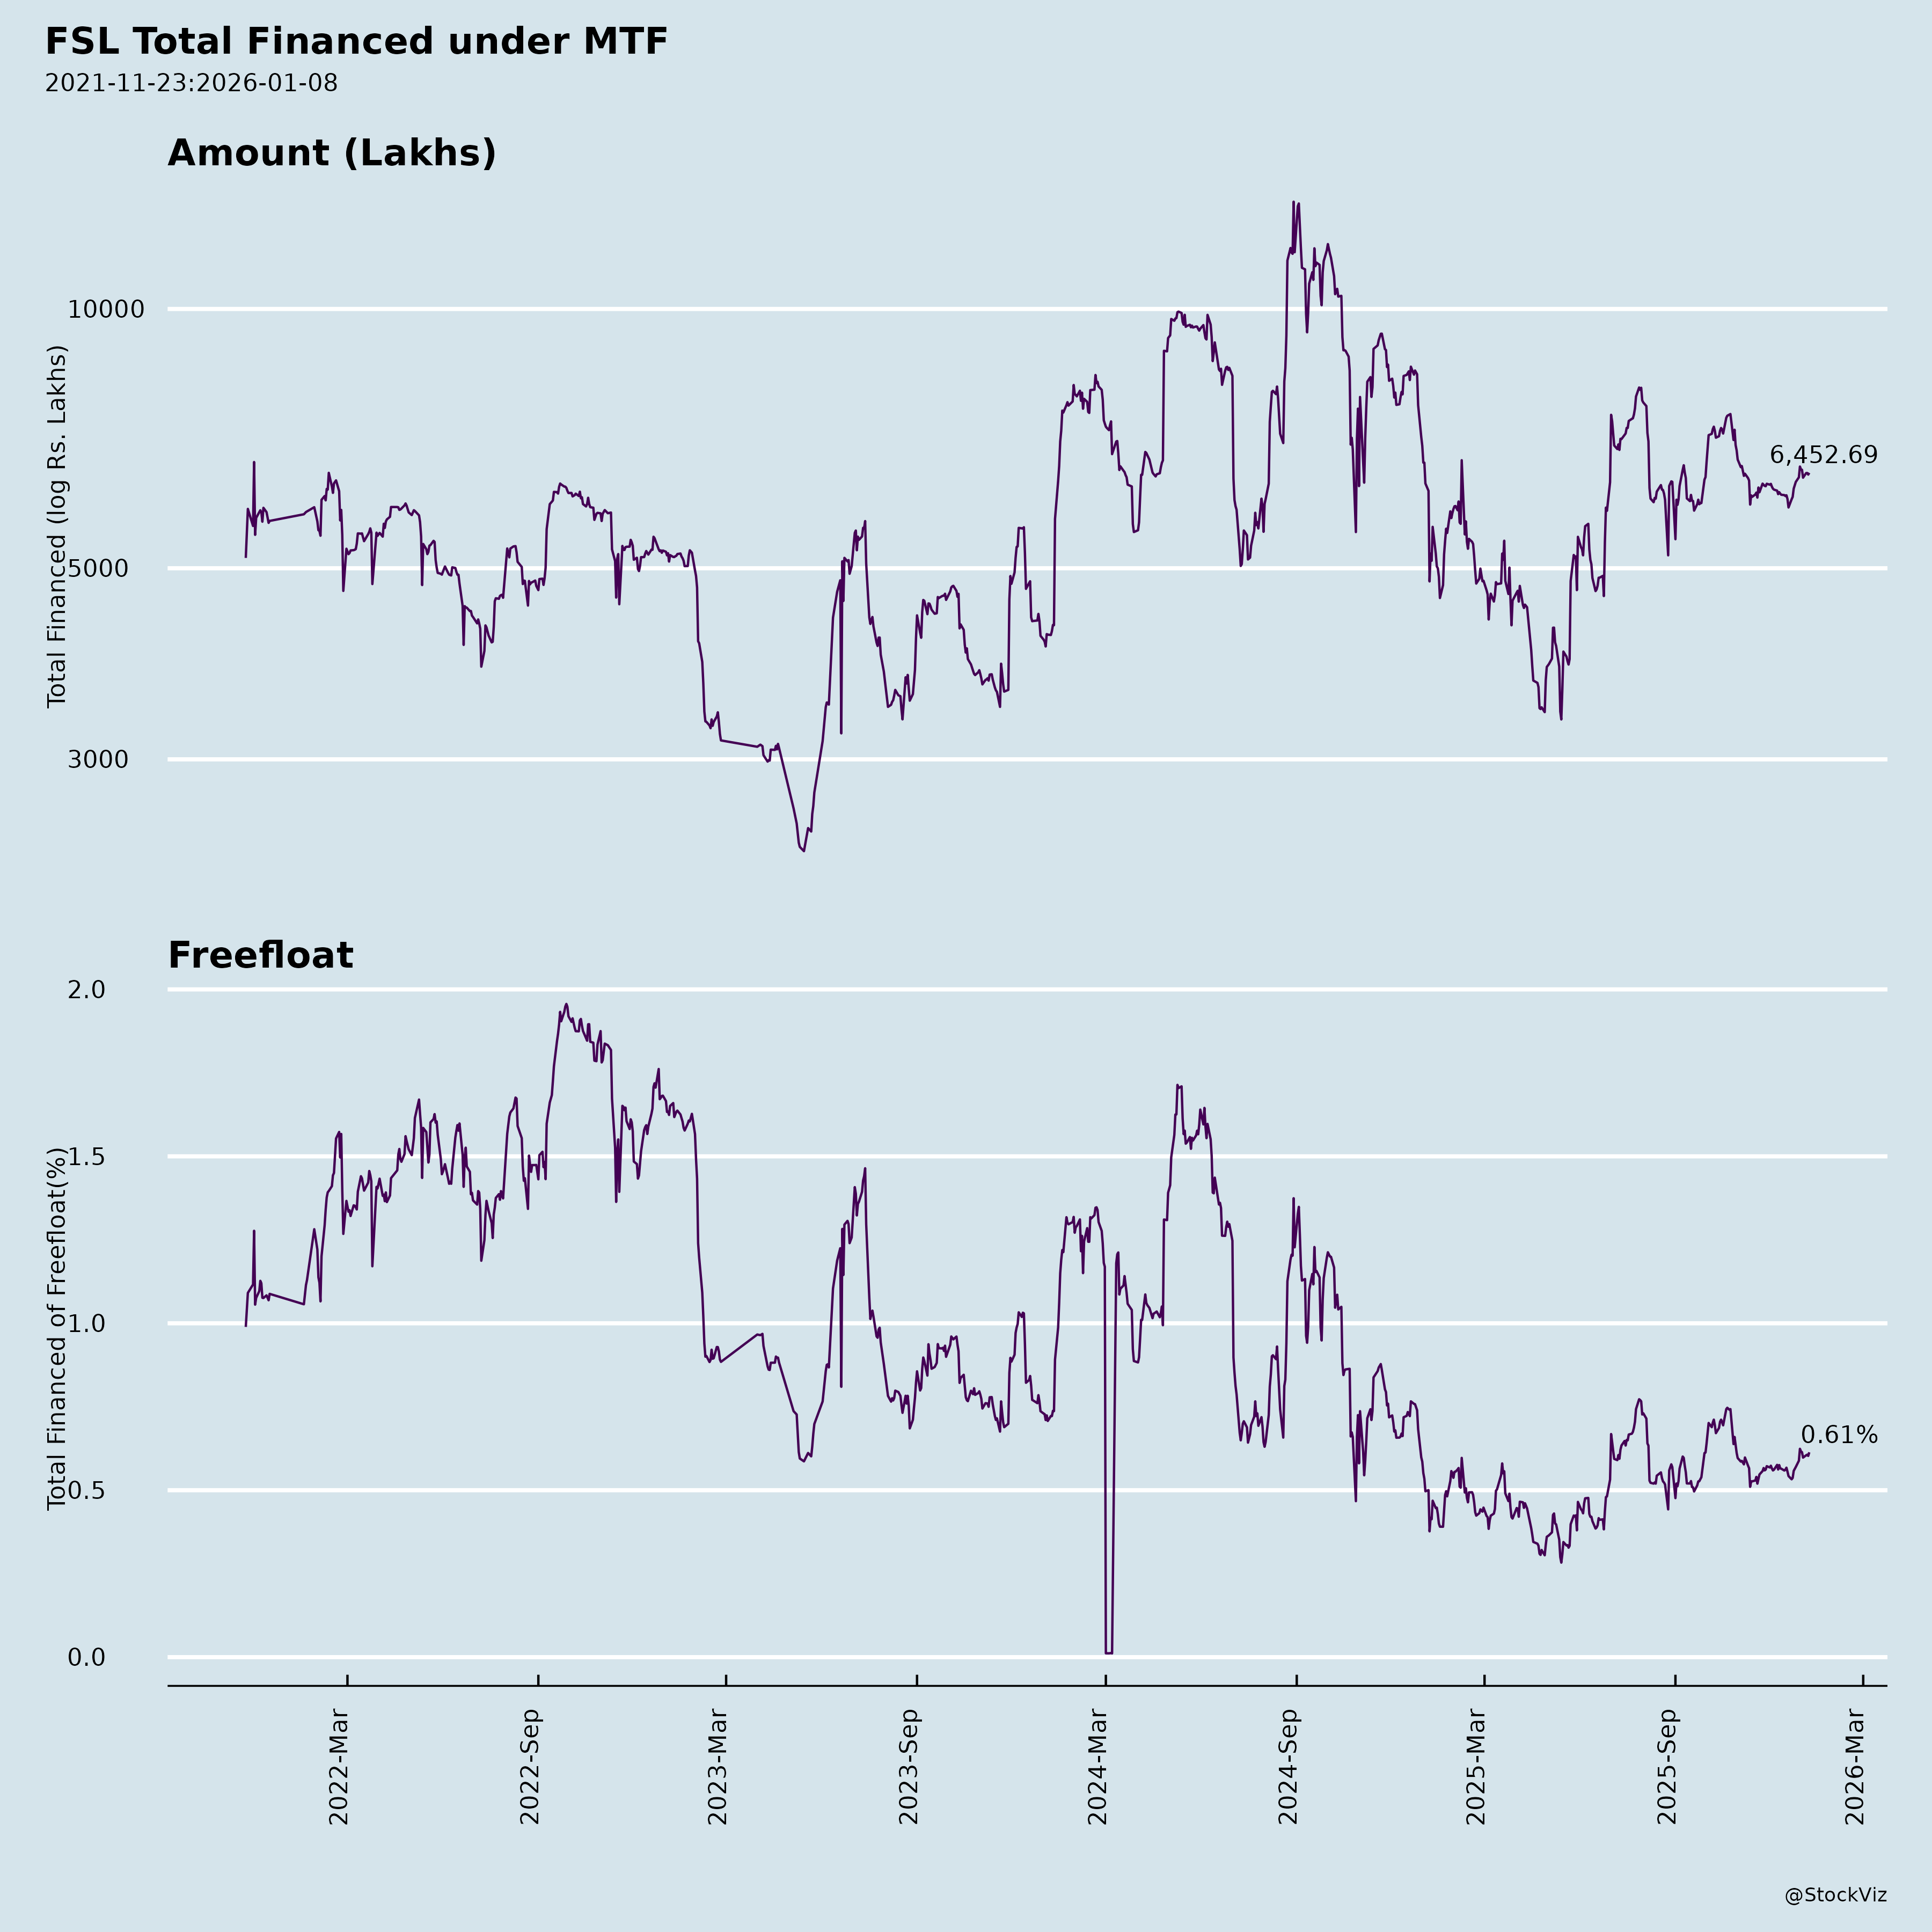
Margined
AI Summary
asof: 2025-12-03
Firstsource Solutions Limited (FSL) Analysis: Headwinds, Tailwinds, Growth Prospects, and Key Risks
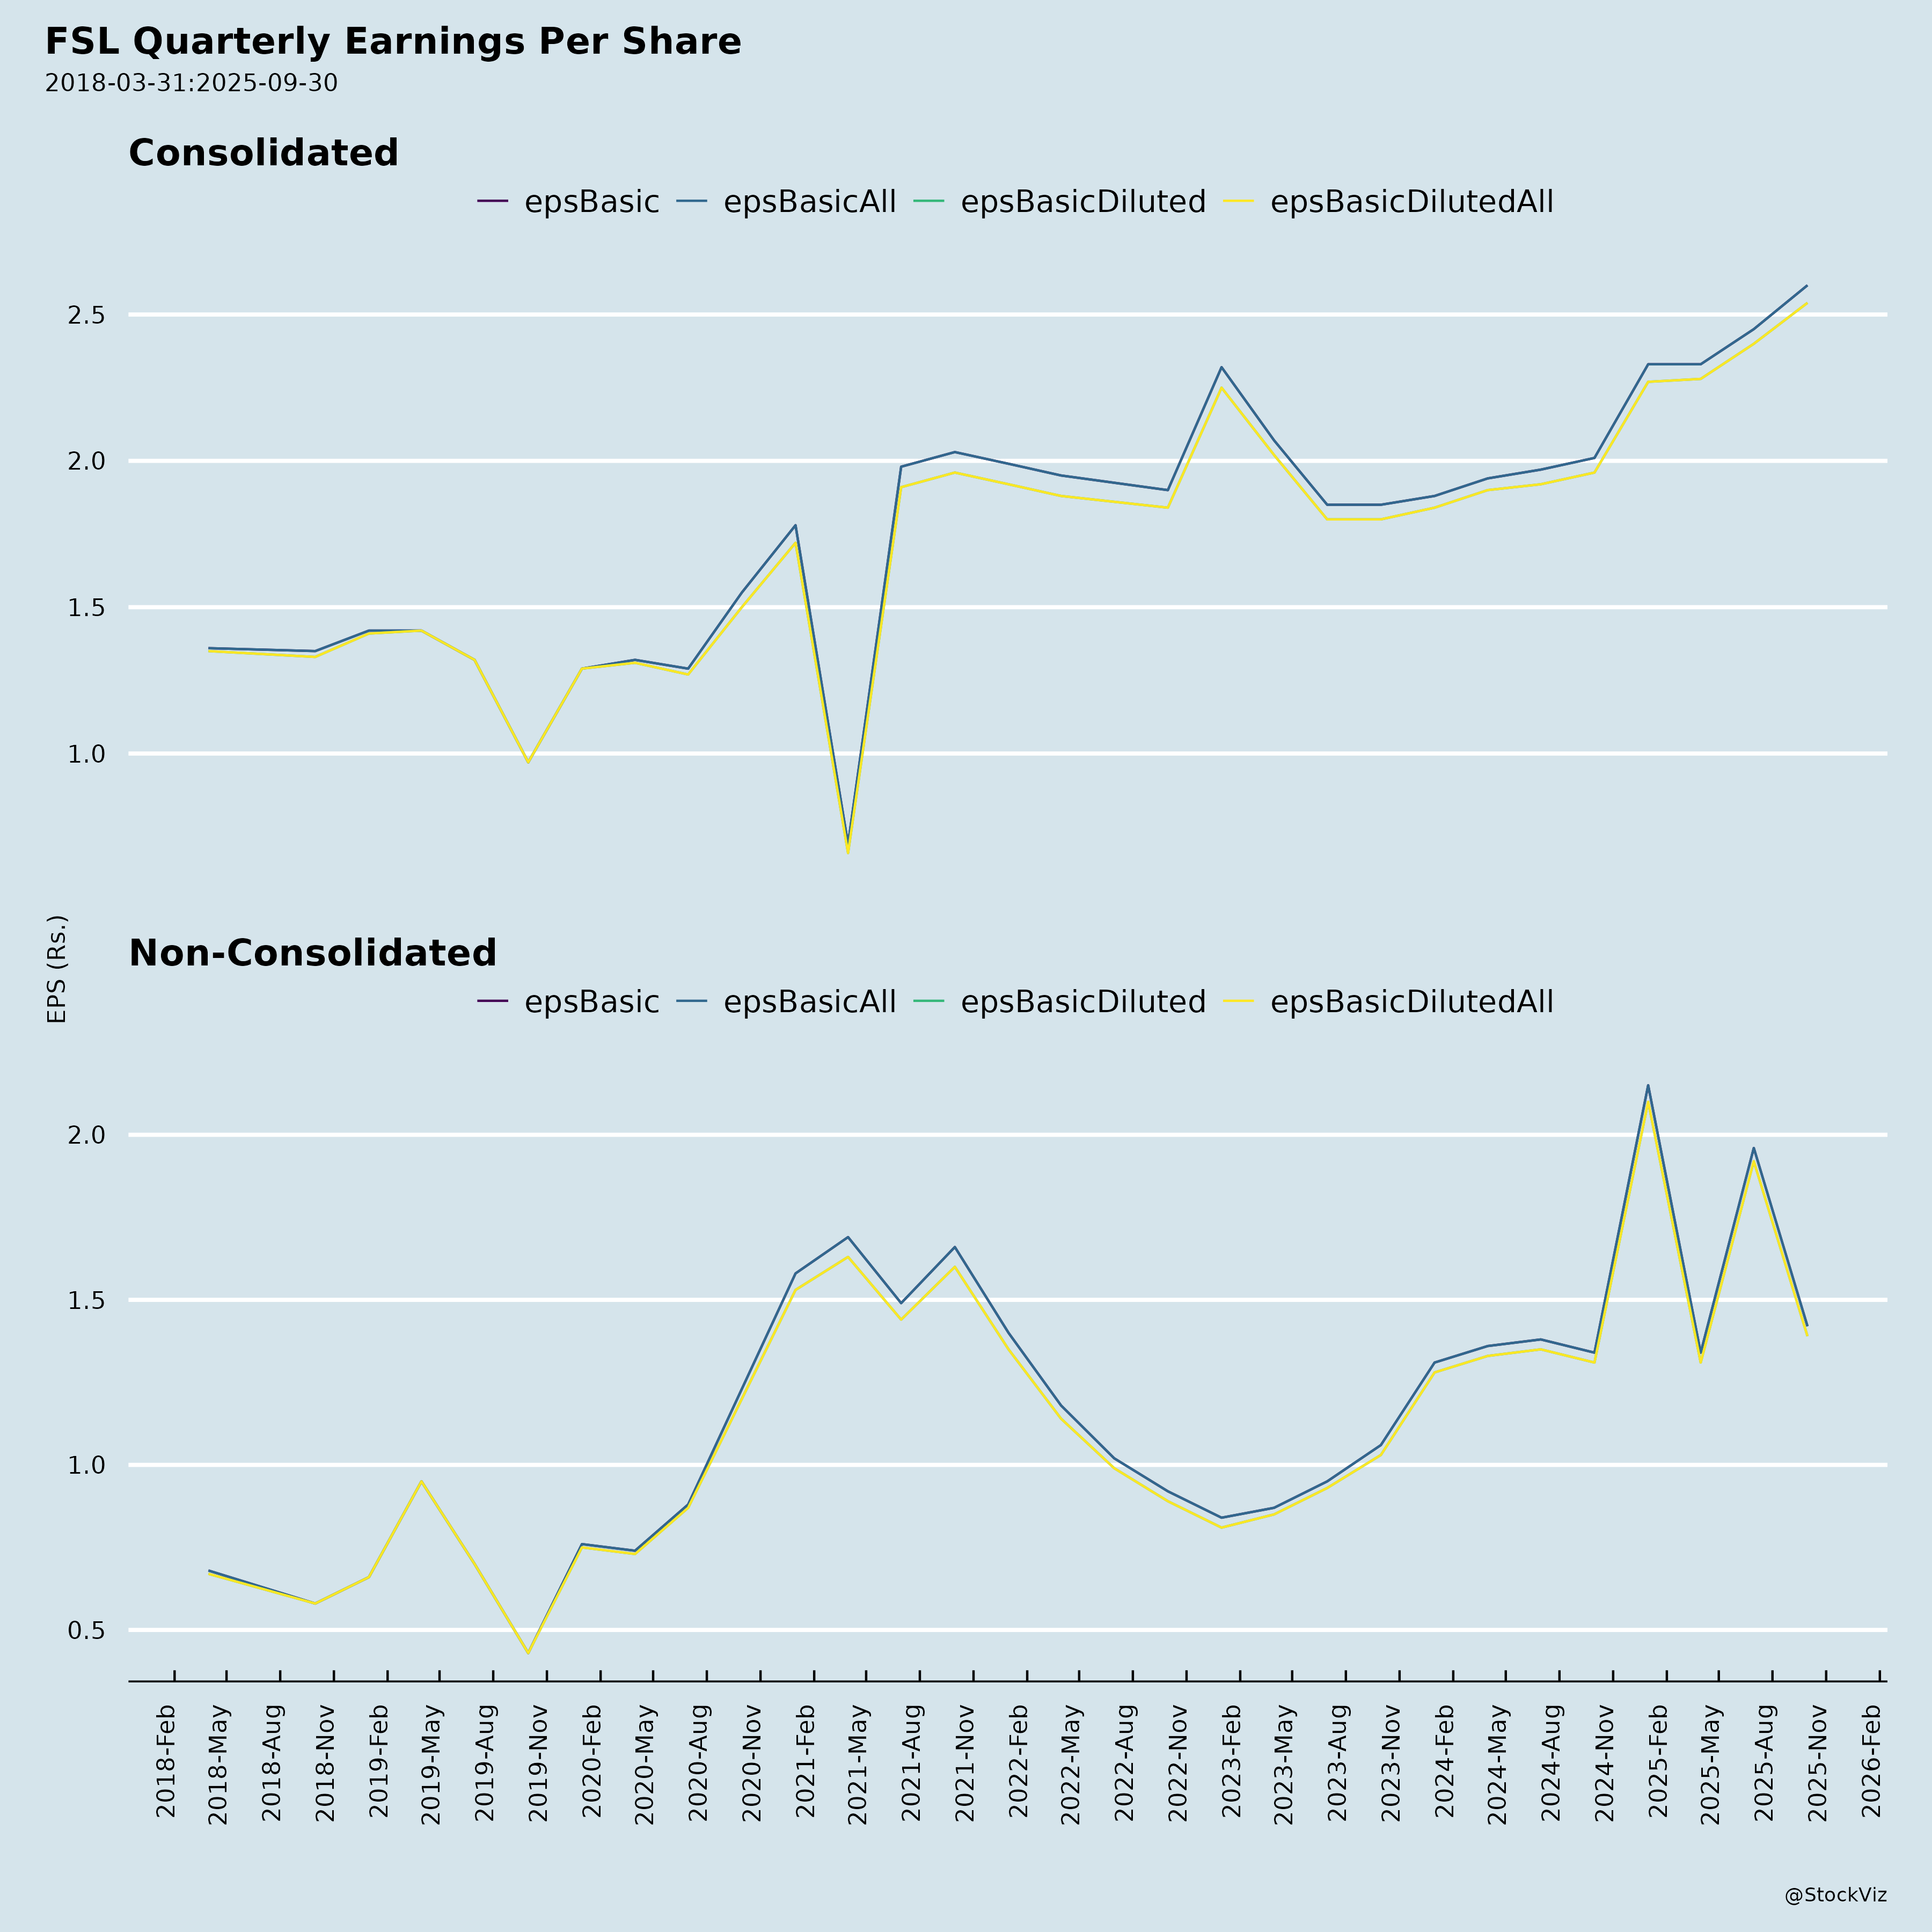
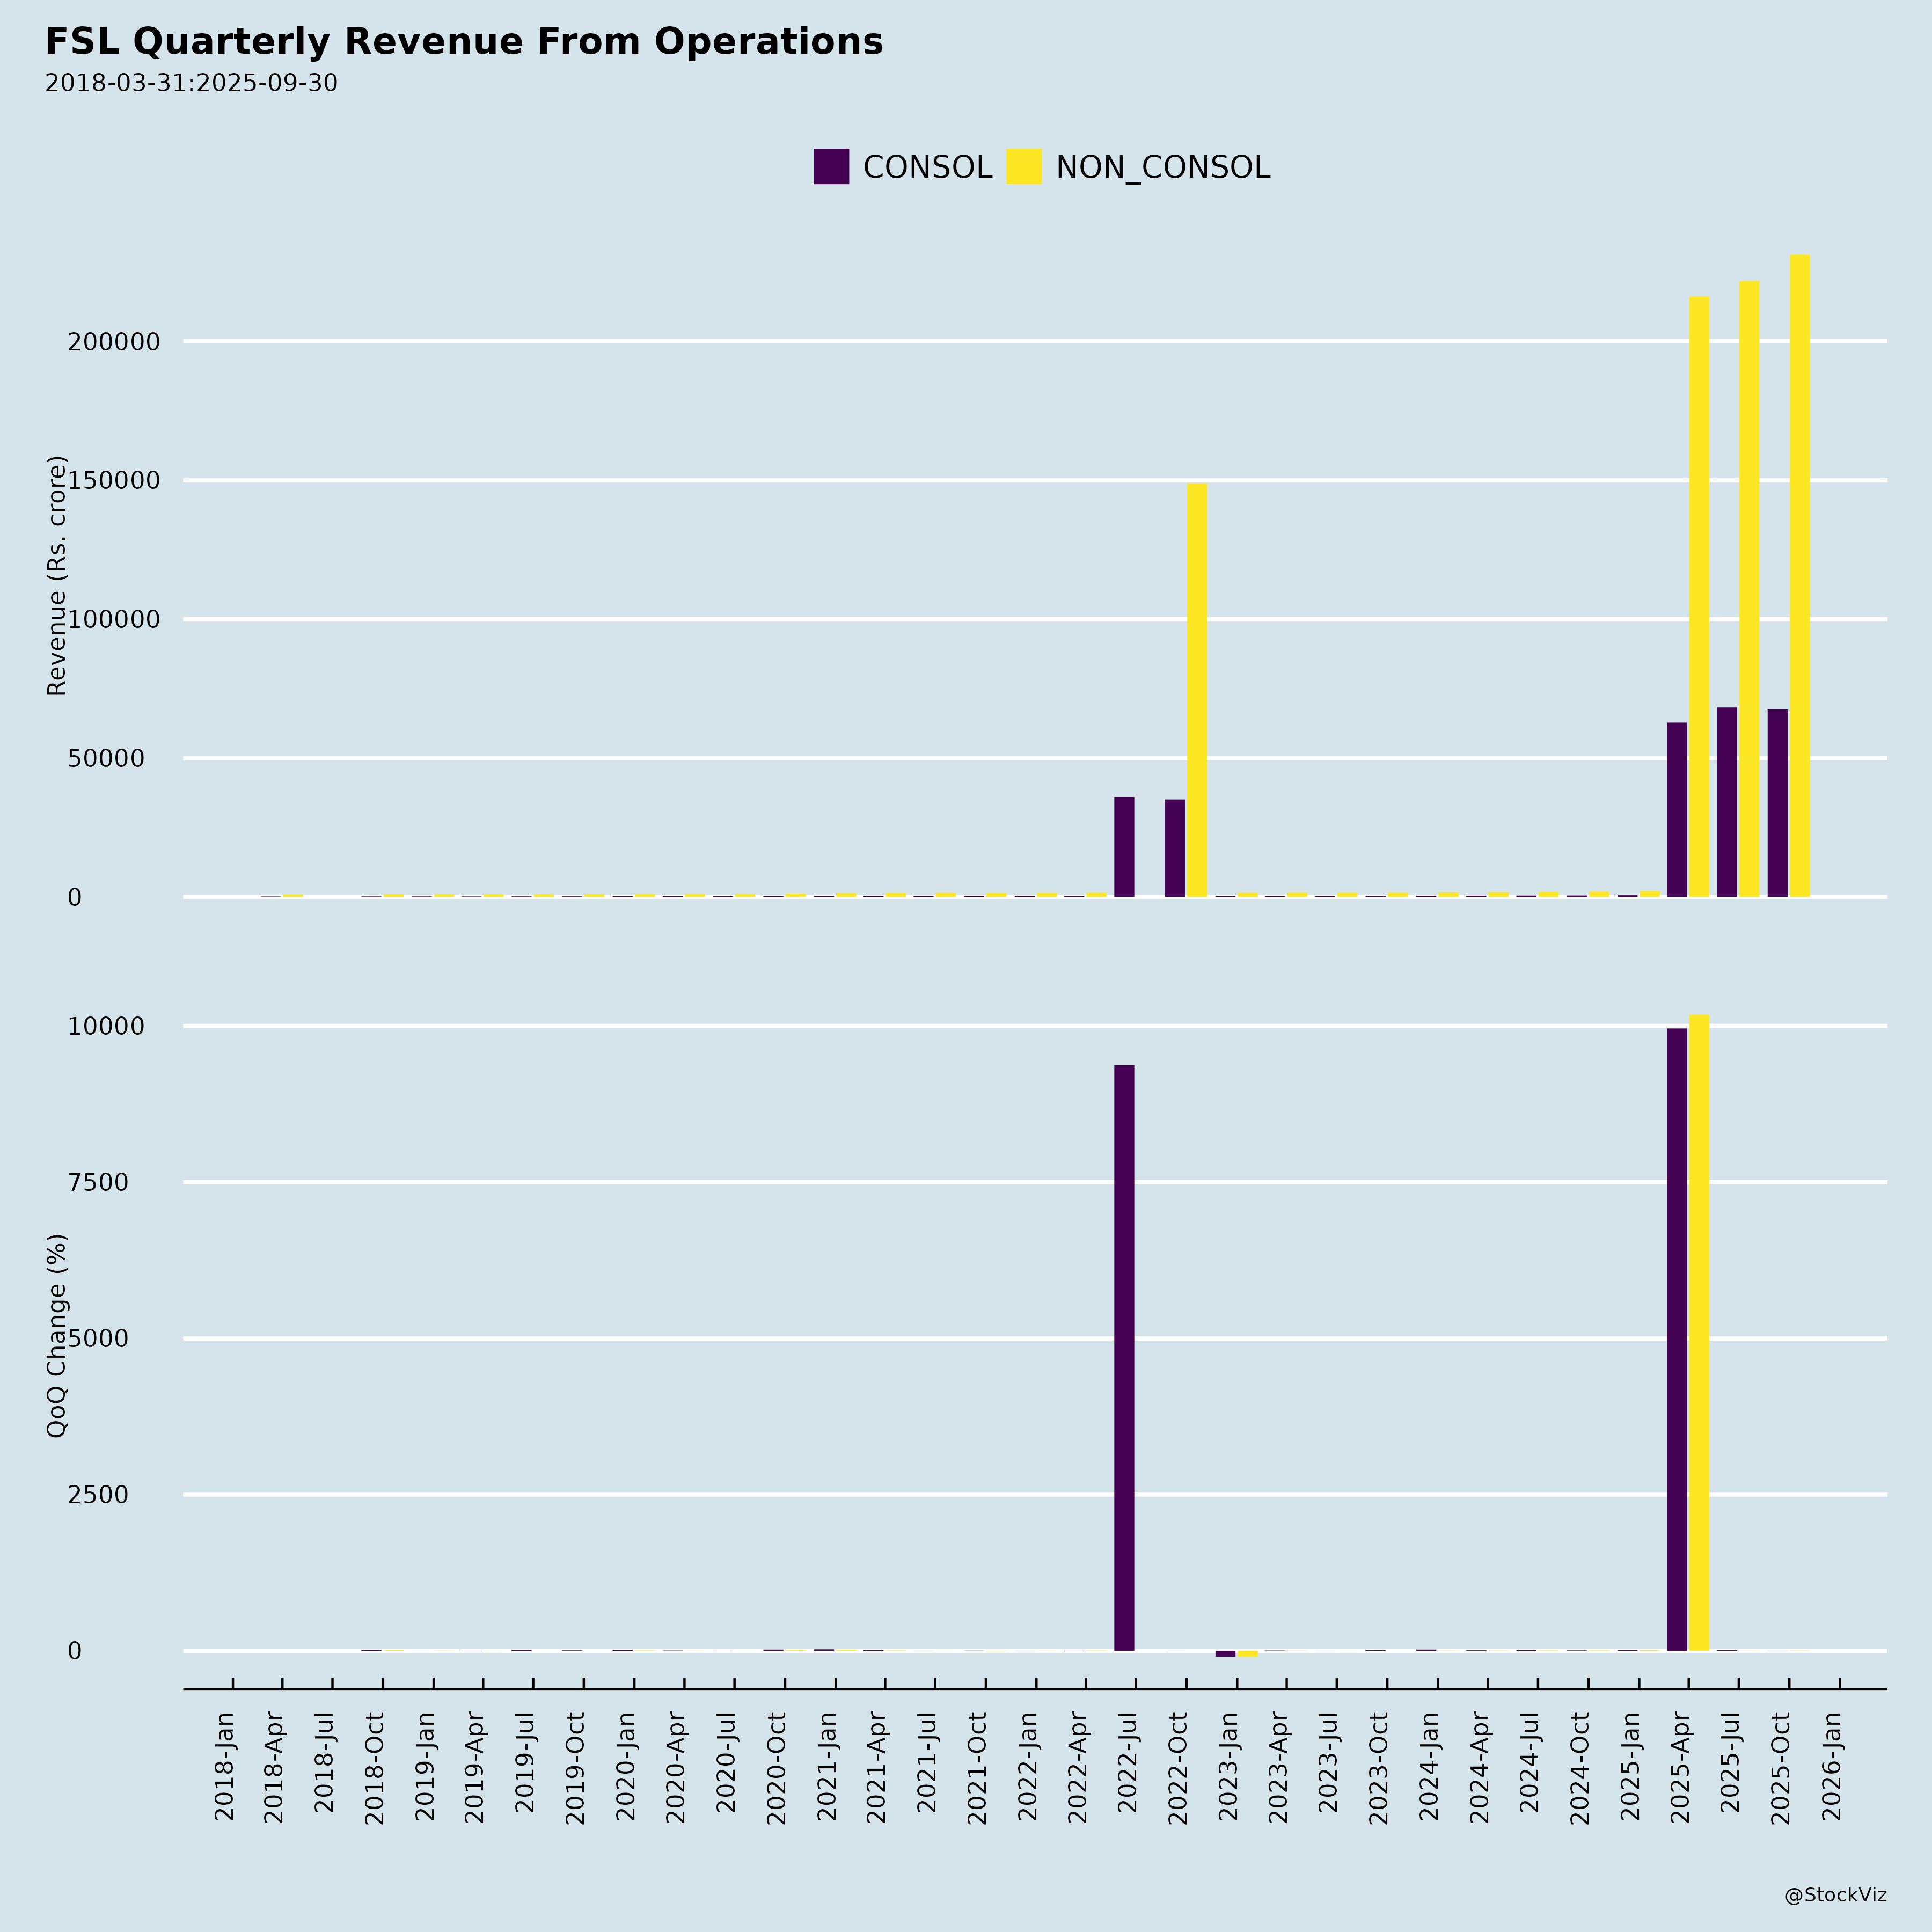
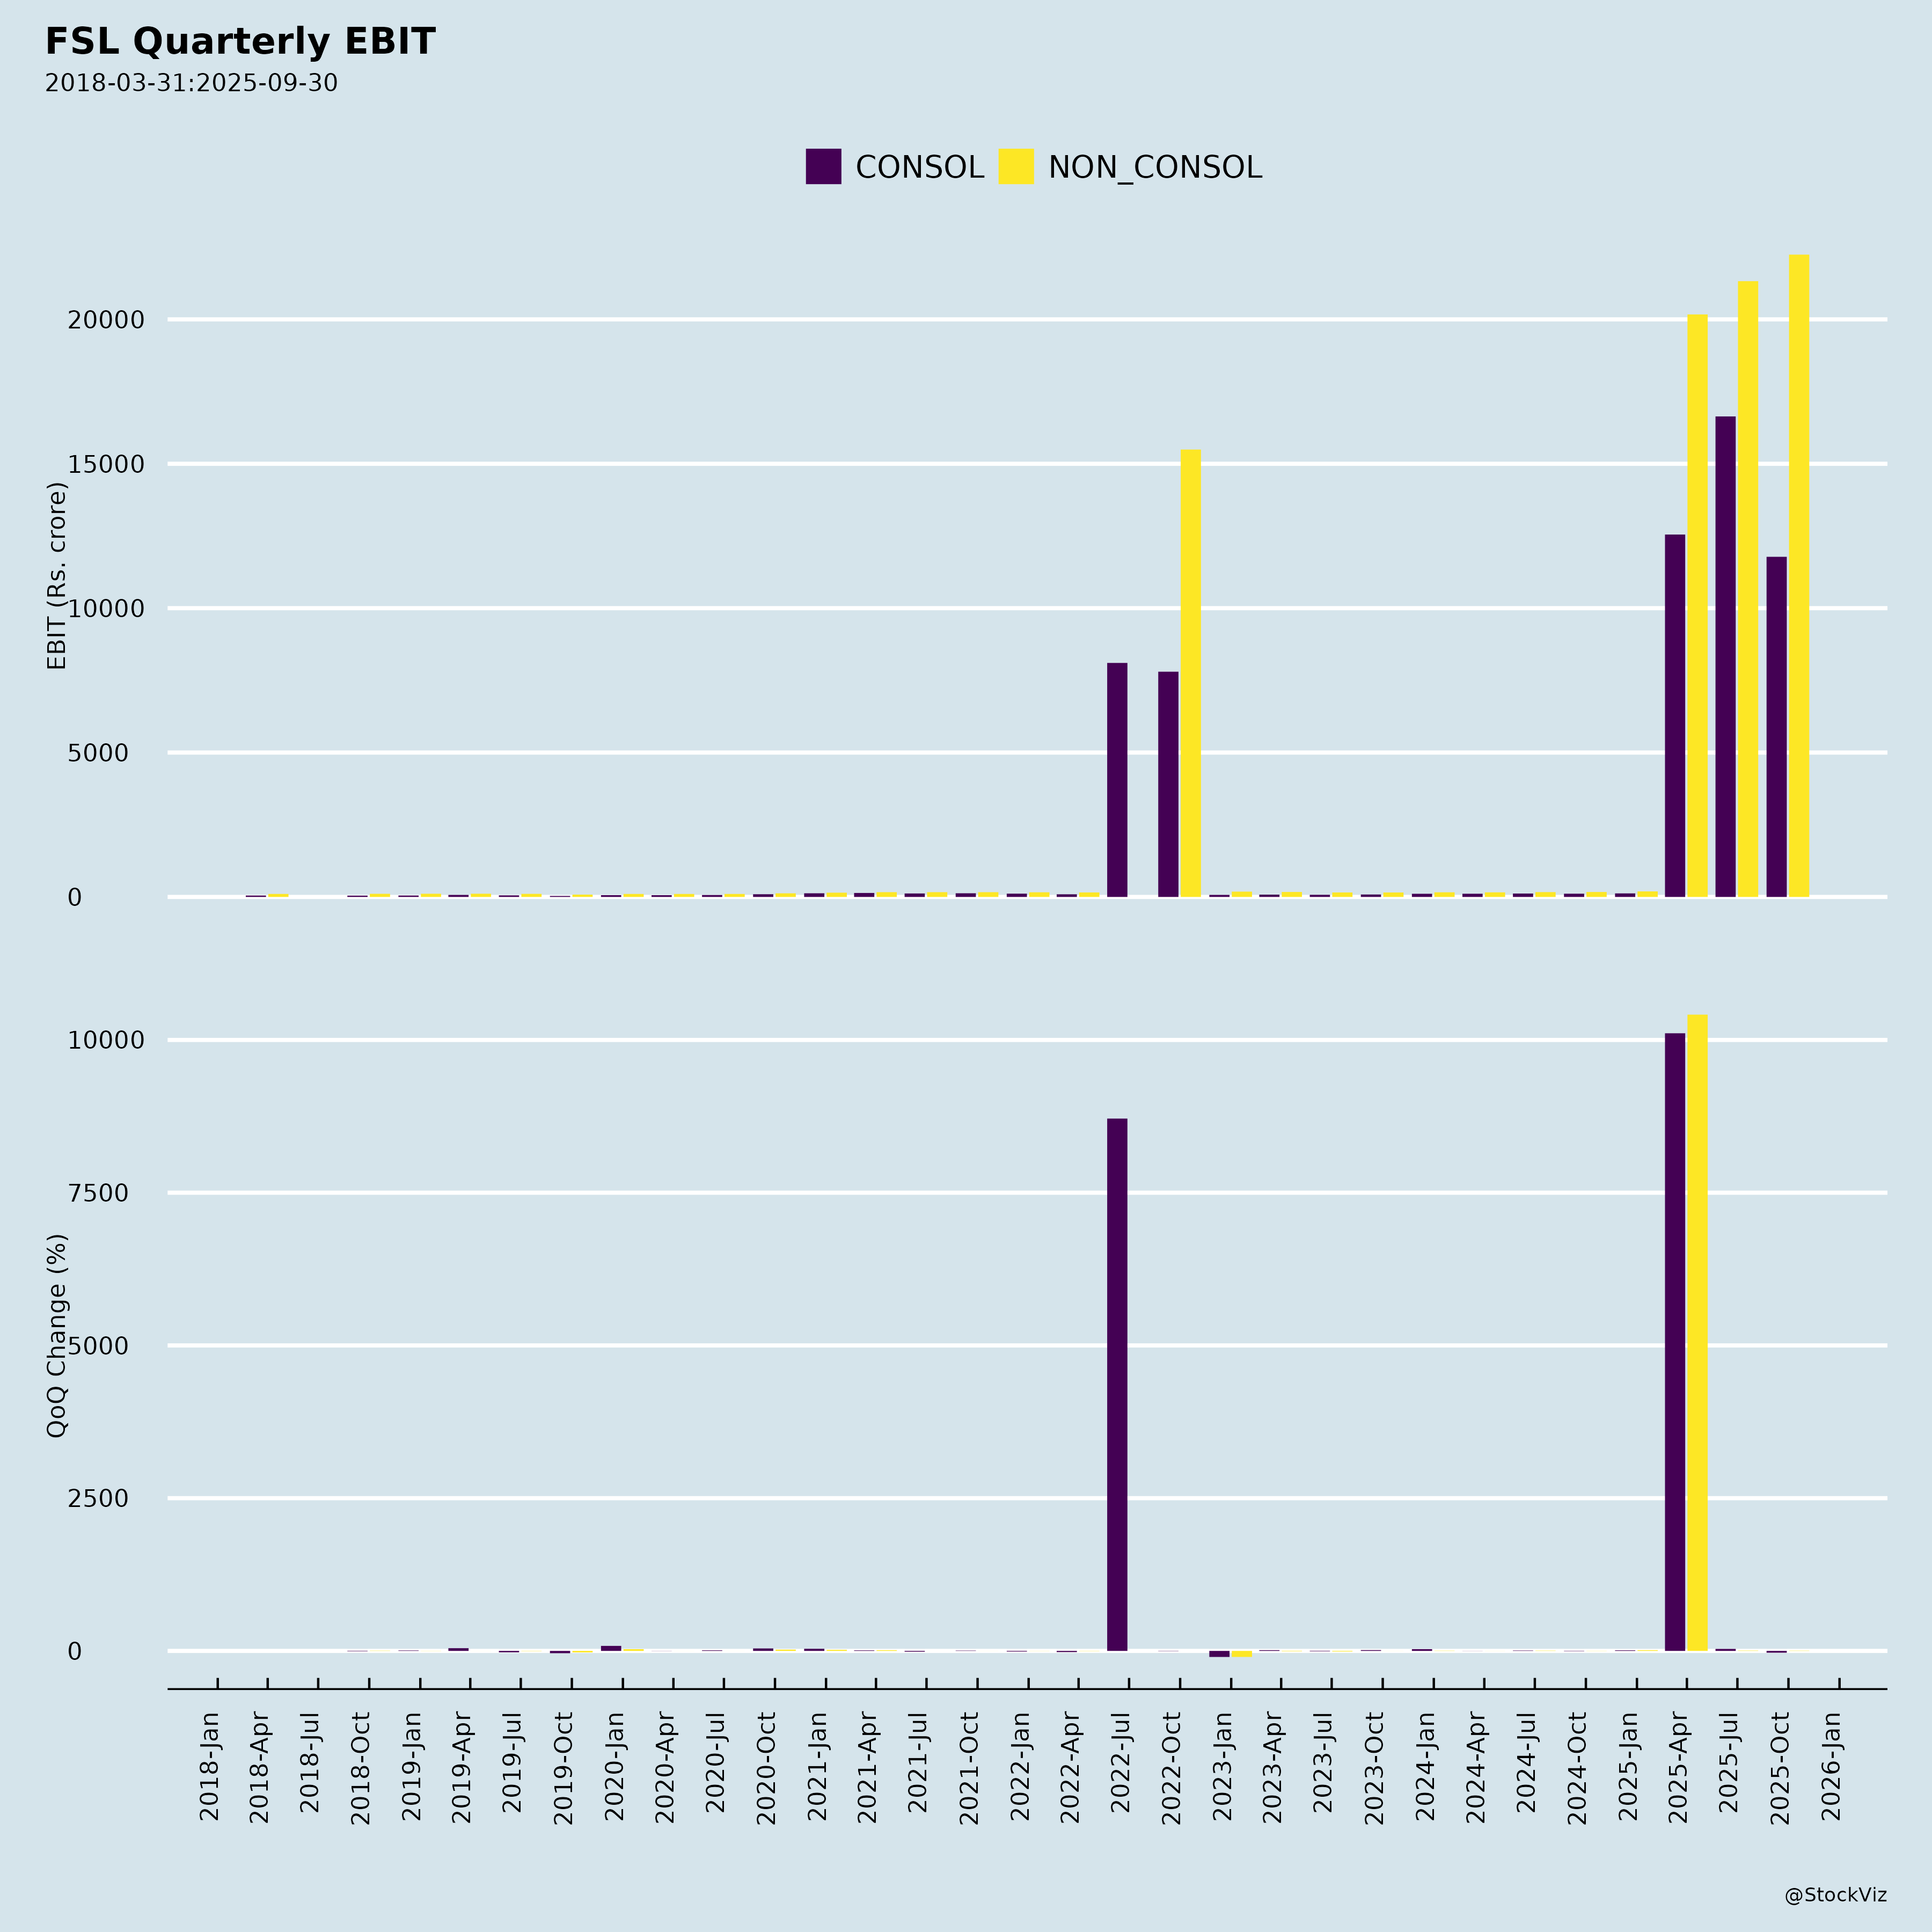
FSL, a leading domain-focused BPS provider (RP-Sanjiv Goenka Group), reported robust Q2FY26 results (ended Sep 30, 2025): Revenue ₹23,122 Mn (US$265 Mn, +20.1% YoY/+13.8% CC), EBIT margin 11.5% (+70bps YoY), PAT ₹1,795 Mn (+30% YoY). H1FY26: +16.4% CC revenue growth, 11.4% EBIT margin. FY26 guidance: 13-15% CC revenue growth (ex-Pastdue acquisition), EBIT 11.25-12%. TTM revenue crossed US$1Bn; deal pipeline hit historic US$1Bn. Strategy emphasizes UnBPO™ (AI/tech-led transformation), client diversification, and vertical depth. Overall, strong tailwinds from deal momentum and margins outweigh headwinds; growth trajectory intact amid macro caution.
Tailwinds (Positive Momentum Drivers)
- Deal Pipeline & Wins: US$1Bn pipeline (first-time milestone, +5-10% QoQ growth); 4 large deals (>US$5Mn ACV) in Q2 (3rd straight quarter of 4+ wins); 10 new logos (4 strategic). 13/19 strategic logos hit US$5Mn run-rate in 4 quarters. >50% of recent large deal ACV from non-Top-5 clients.
- Client Diversification: Top-5/Top-10 revenue share down 6.2%/9% over 8 quarters; US$5Mn+ clients up to 39 (from 26 YoY); FSL80 cohort (high-headroom accounts) driving cross-sell/upsell.
- Margin Discipline: 4th straight QoQ expansion (+20bps to 11.5%); H1 at 11.4% despite 90% wage coverage. Operational levers: Right-shoring, AI/automation, productivity gains.
- Vertical Strength: BFS +11% YoY CC (strong NA pipeline); Healthcare +6% YoY (2.5x pipeline YoY, payer traction); CMT +15% YoY (consumer tech demand).
- Operational Resilience: Headcount +1,502 QoQ (80% offshore/nearshore); attrition -12ppt over 8 quarters to 28%; FCF/PAT 155% H1; net debt down to ₹10.8Bn.
- Innovation & Recognition: UnBPO™ gaining traction (non-linear contracts, agentic AI via Lyzr/AppliedAI investments); 10+ awards (HFS Leader in Mortgage, Everest Star Performer in FCC, ISG Leader in Digital Ops CX).
- Geographic Expansion: NA +16% YoY CC; Australia/Middle East ramps; South Africa nearshore wins.
Headwinds (Challenges & Pressure Points)
- Europe Weakness: 29% of revenue; flat QoQ in diverse portfolio (UK utilities/retail sluggish); client shifts to offshore/nearshore; gradual recovery amid high labor costs/regulations.
- Macro/Volume Sensitivity: US mortgage subdued (high 6.25% rates, 88% sub-5% locked-in); no major refi uptick without further Fed cuts.
- Organic Moderation: H1 CC growth ~16% but organic ~8-10% (ex-Ascensos); staggered ramps in transformation deals (e.g., Healthcare BPaaS from Q3).
- Operational Metrics: DSOs at 69 days (+marginal QoQ); depreciation run-rate elevated (~4.7% of sales post-Mumbai facility shift).
- Forex & Costs: Rupee strength impacts USD growth (15.2% YoY reported vs. 13.8% CC); annual wage hikes absorbed but ongoing pressure.
Growth Prospects (High Potential, Industry-Leading Trajectory)
- Guided Acceleration: 13-15% FY26 CC growth (H2 stronger via ramps: Healthcare BPaaS, UK collections post-FCA); TTM US$1Bn revenue base.
- Pipeline Conversion: Sole-sourced/non-linear deals improving win rates; US$1Bn+ pipeline supports sustained double-digit growth.
- Strategic Levers: | Lever | Opportunity Size/Impact | |——-|————————-| | New Geos | Middle East (Dubai ops), Canada, Australia (Monash AI partnership). | | Acquisitions | Pastdue Credit (UK utilities, imminent FCA); builds on Ascensos/Quintessence. | | Verticals | Healthcare (regulatory tailwinds, 12/15 top US plans); Collections (largest UK deal); Tech (4/5 top consumer tech for frontier models). | | UnBPO™ | Tech arbitrage (AI agents, data-as-a-service); non-linear constructs rising (vs. industry 75% T&M). Revenue/headcount decoupling expected. |
- Medium-Term: Top-decile growth (0.5% market share gain vs. 15 peers); margins to peer levels (50-75bps annual expansion); FSL80 + strategic logos for wallet share.
- Catalysts: Rate cuts boosting mortgages; Europe stabilization; AI adoption (e.g., mortgage LLM, agent marketplaces).
Key Risks (Moderate, Manageable with Mitigants)
| Risk Category | Description | Mitigants |
|---|---|---|
| Macro/Geopolitical | Uncertainties delaying decisions (Europe gradual); US rates/mortgage volumes. | Diversified verticals (NA 69%, BFS/HC 67%); CC guidance excludes macro changes. |
| Execution | Staggered deal ramps; regulatory delays (Pastdue FCA, collections approvals). | Highest Q2 headcount add in 6Q; 82% OCF/EBITDA H1. |
| Competition | IT peers entering BPO; pure-plays vs. integrated players. | Domain depth (e.g., 14/20 US mortgage lenders); UnBPO™ moat (Everest: pure-plays > integrated). |
| Client/Concentration | Top-10 ~42% revenue; program shifts (UK onsite-to-offshore). | Dilution trend; 22 large deals past 6Q (>50% non-Top-5). |
| Operational | Attrition (28%), wage/forex inflation, DSO creep. | Offshore focus; hedge book (USD 86.6, GBP 112.7); productivity gains. |
| Regulatory/Execution | Acquisition/integration risks (e.g., Ascensos impairment ₹225Mn). | Strong cash (₹2.9Bn); proven M&A (19 strategic logos). |
Investment Thesis Summary: FSL’s execution under OneFirstsource (2-year refresh) positions it for sustainable 13-15%+ growth via UnBPO™ differentiation, deal momentum, and diversification. Tailwinds from AI/deal pipeline dominate; headwinds (Europe, macro) contained regionally. Risks tilted operational/macro but mitigated by balance sheet strength (net debt down, healthy FCF). Buy/Hold for growth investors; peers trading at premium multiples offer valuation catch-up potential. Monitor H2 ramps and Pastdue closure.
Copyright © 2023 SAS Data Analytics Pvt. Ltd. All rights reserved.