DIXON
Equity Metrics
January 13, 2026
Dixon Technologies (India) Limited
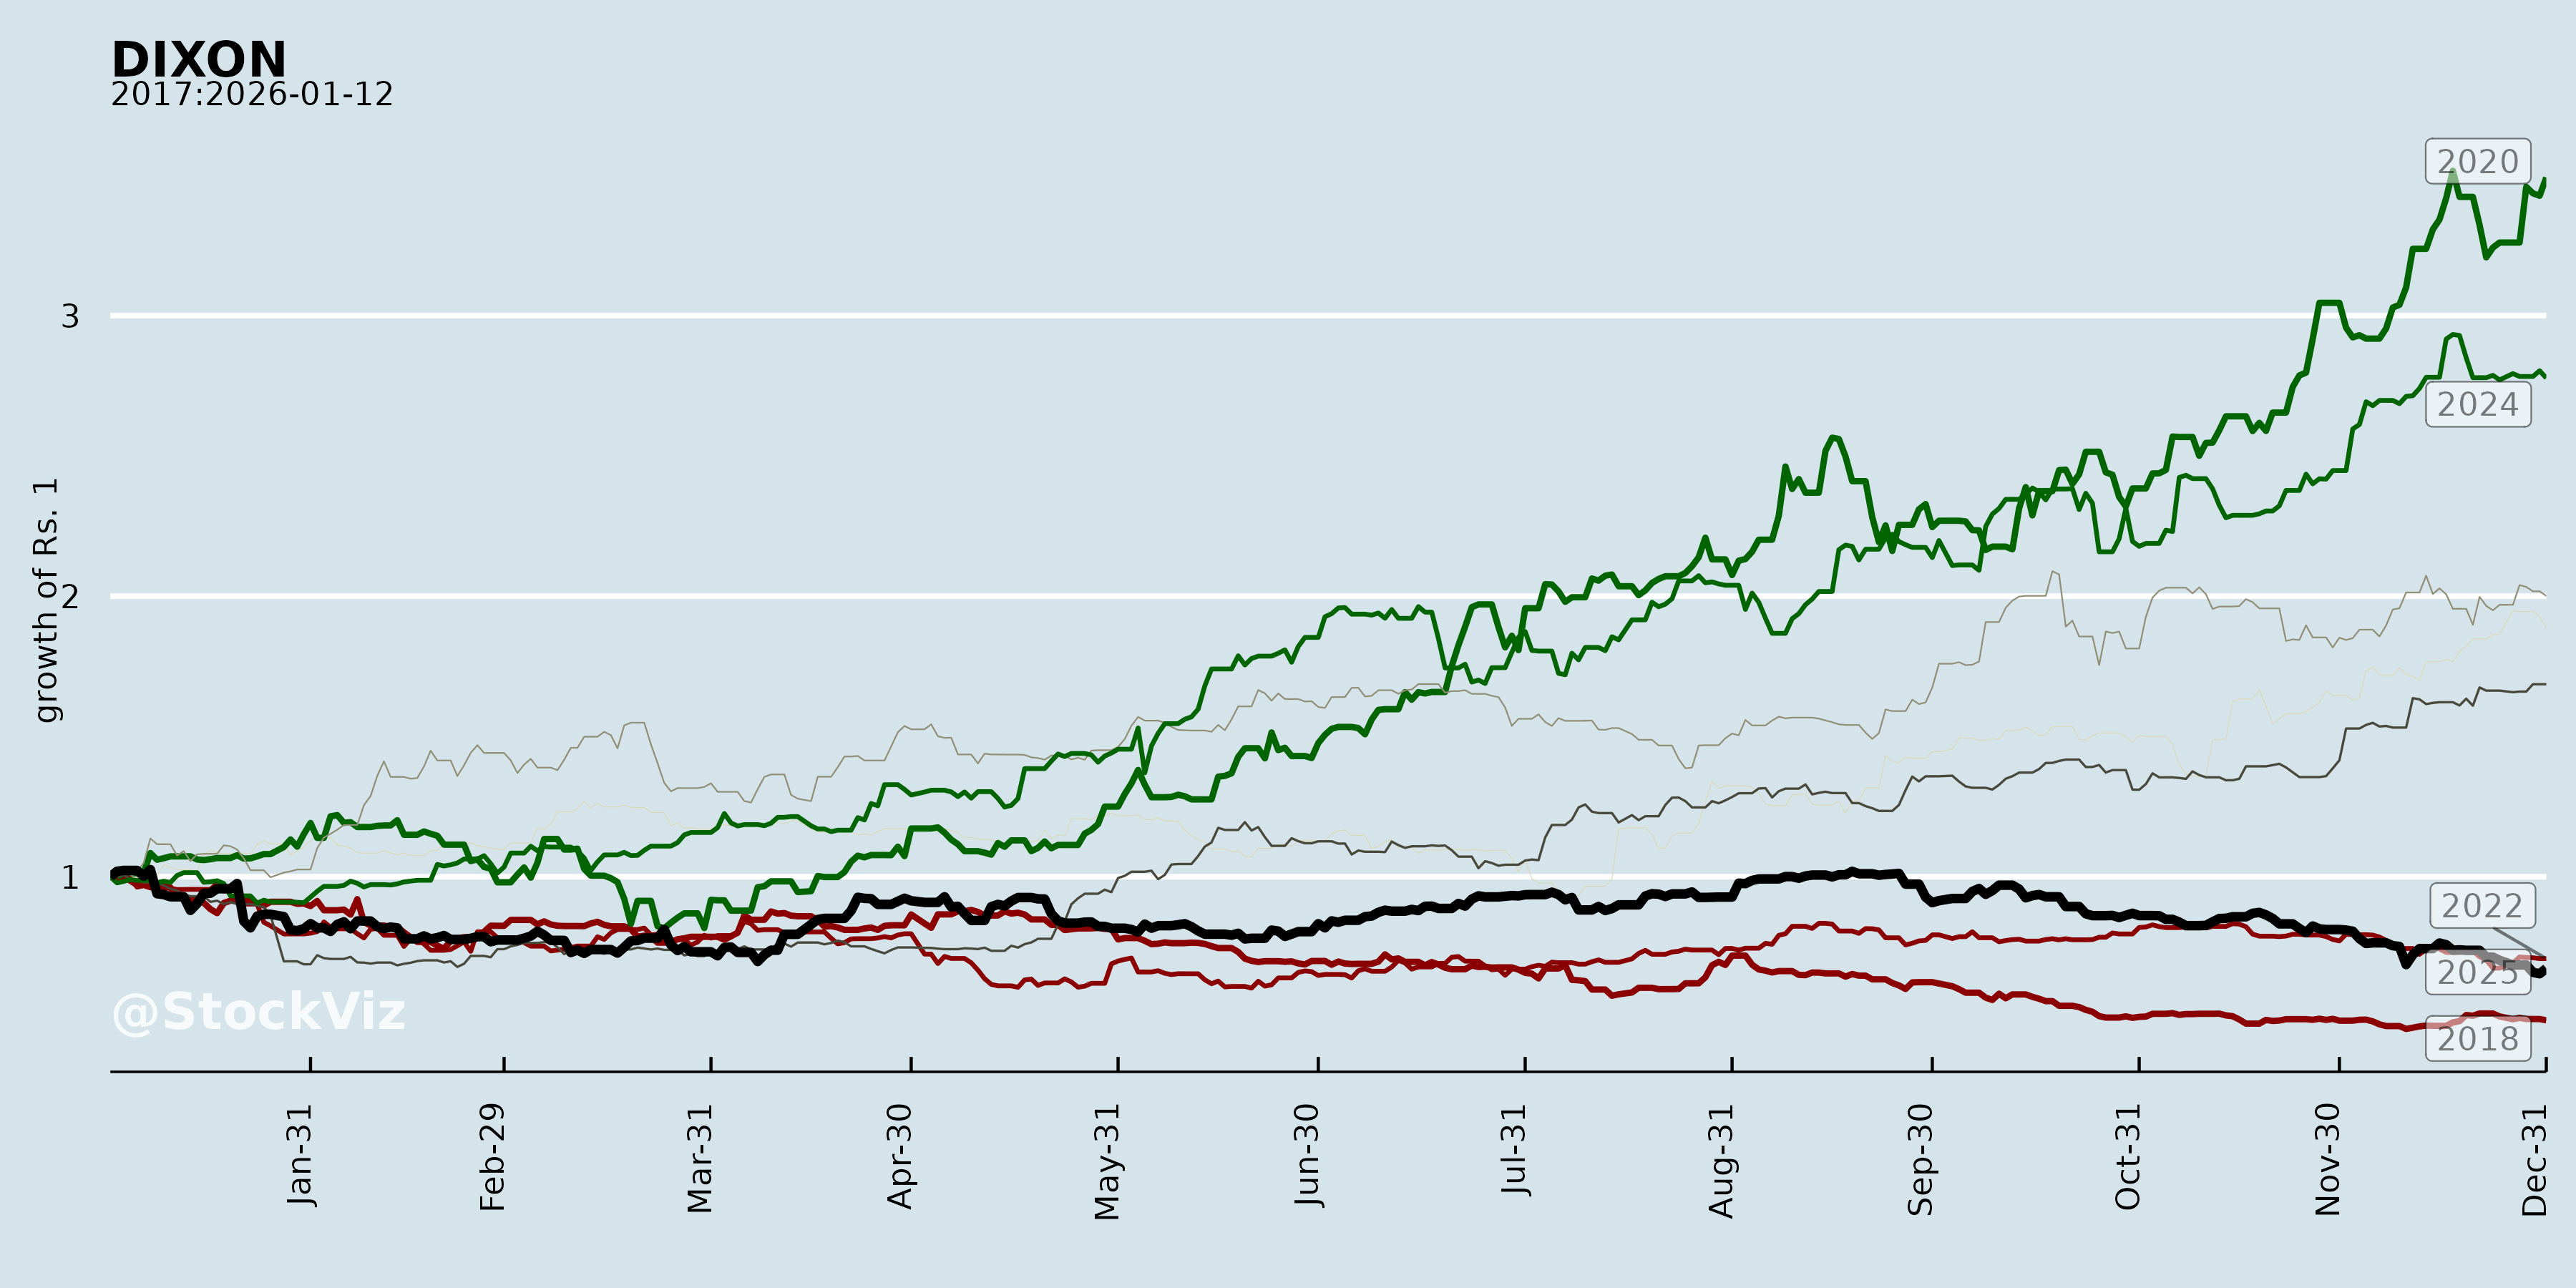
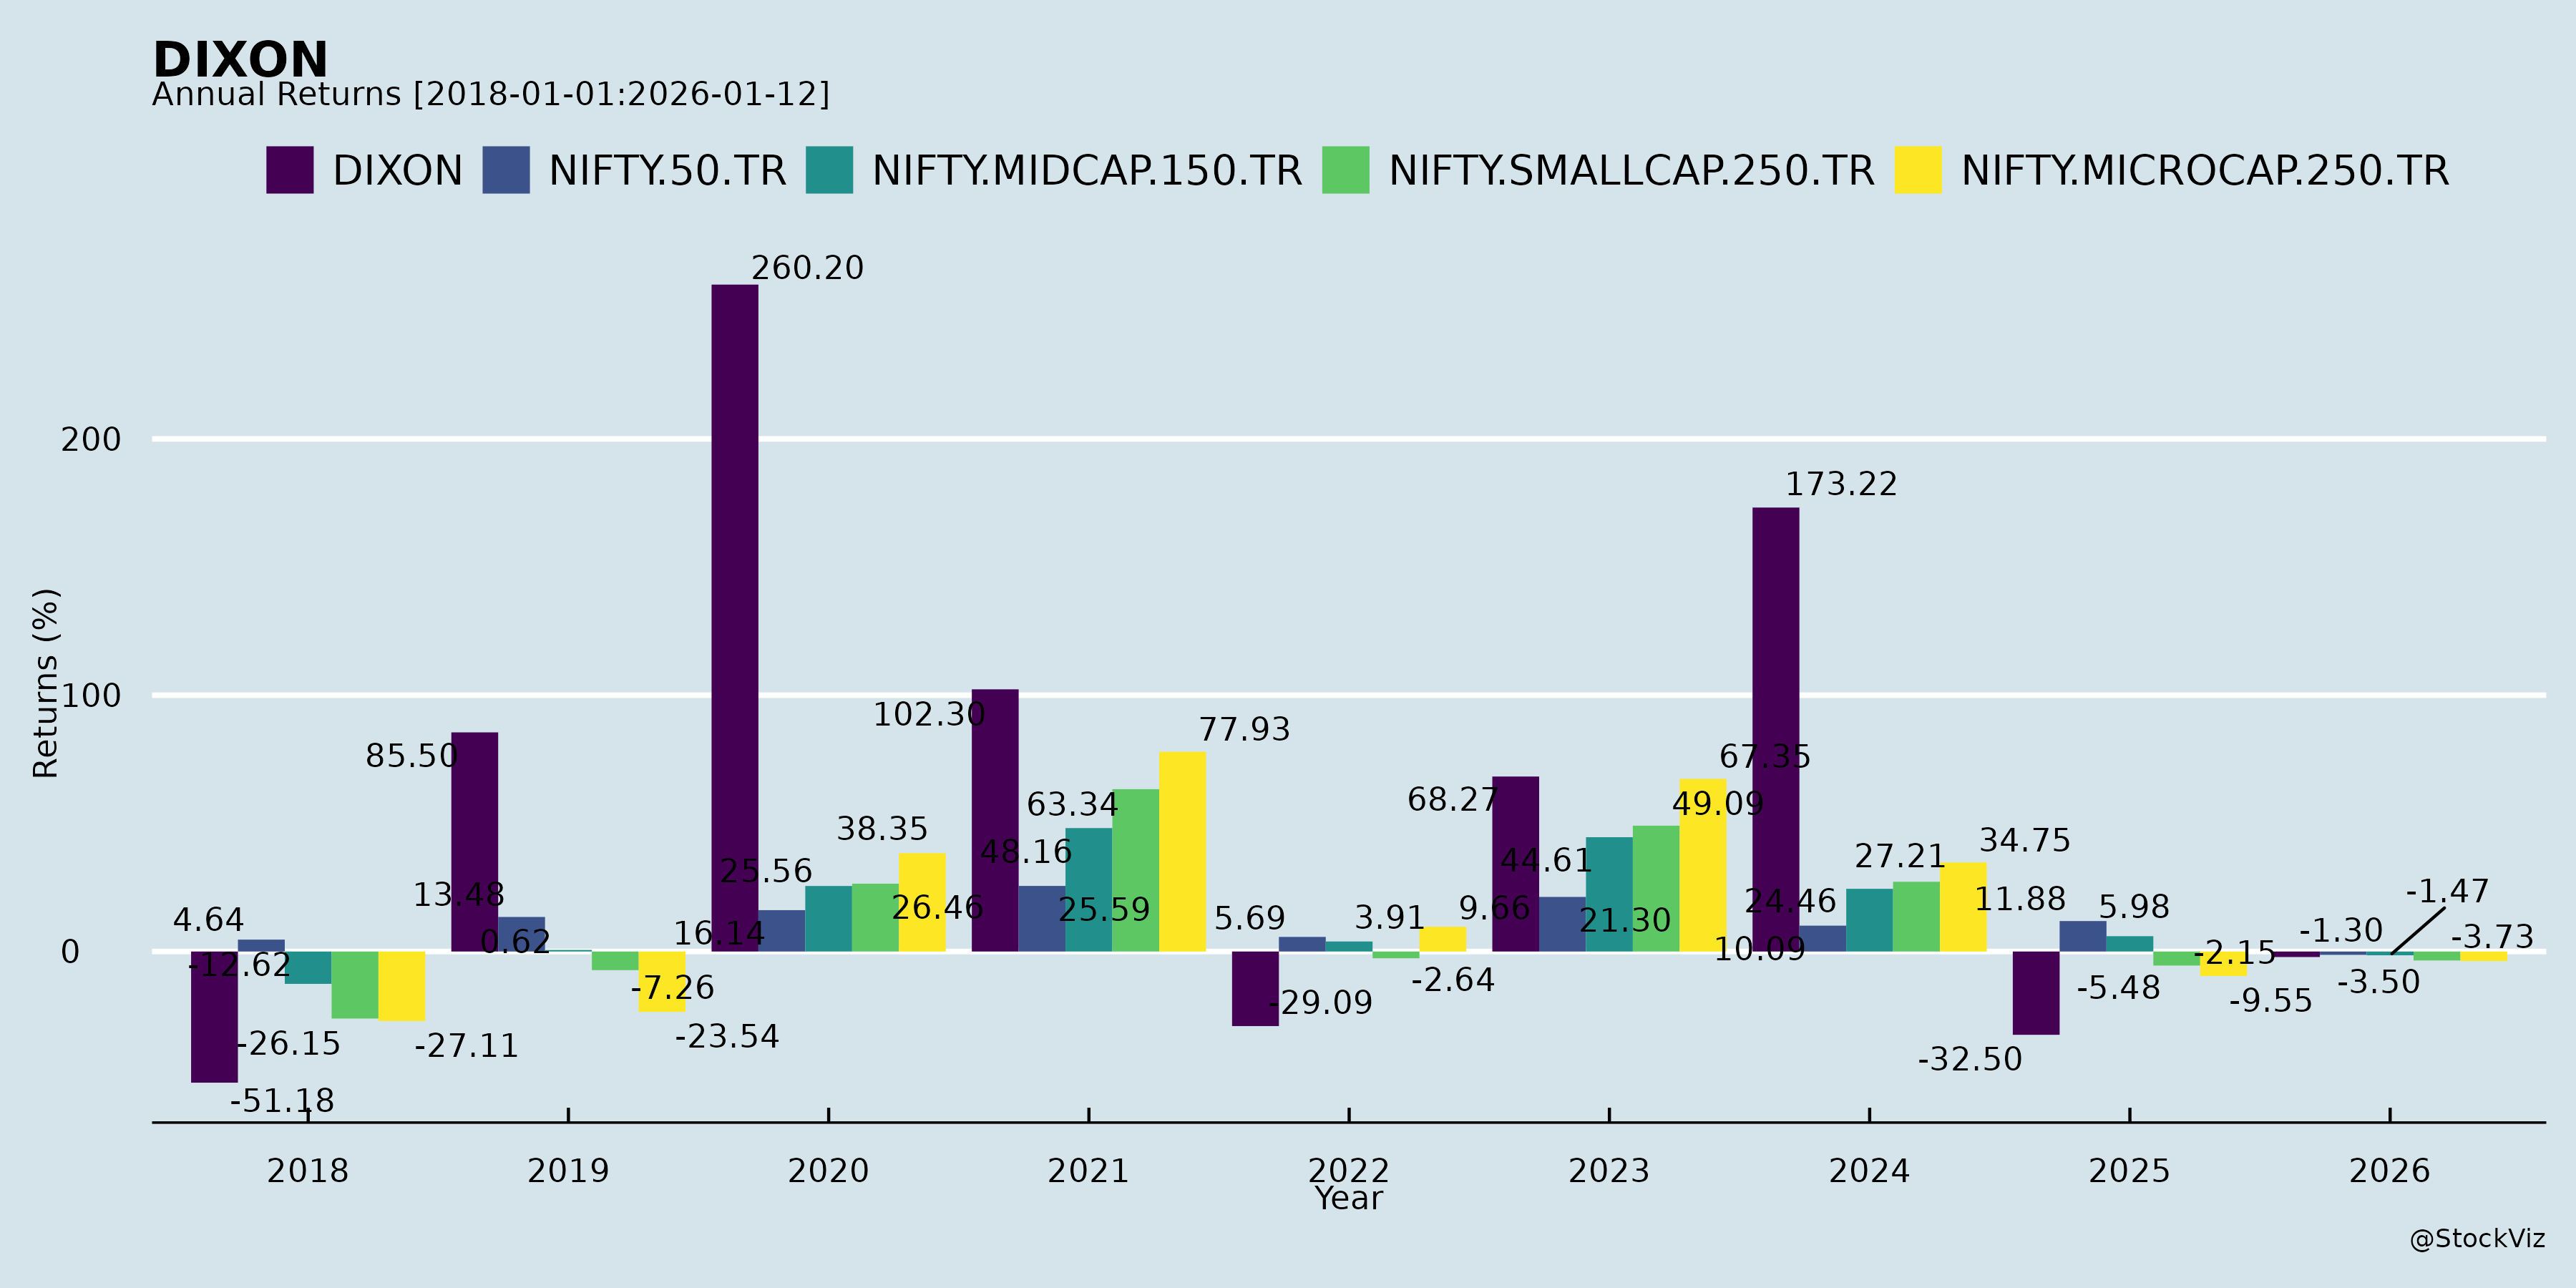
Annual Returns
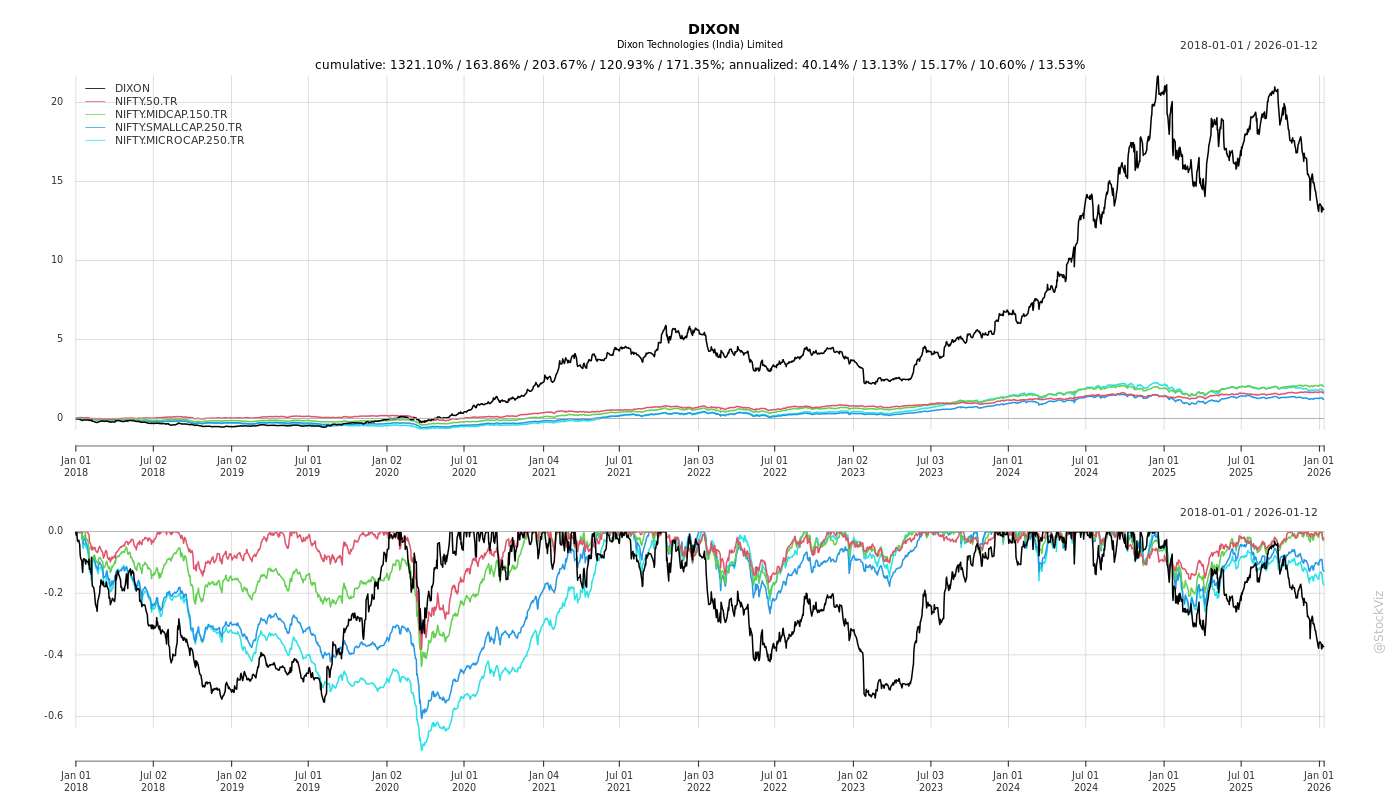
Cumulative Returns and Drawdowns
Fundamentals

Ownership
Margined
AI Summary
asof: 2025-12-03
Dixon Technologies (India) Ltd (DIXON) Analysis: Headwinds, Tailwinds, Growth Prospects, and Key Risks
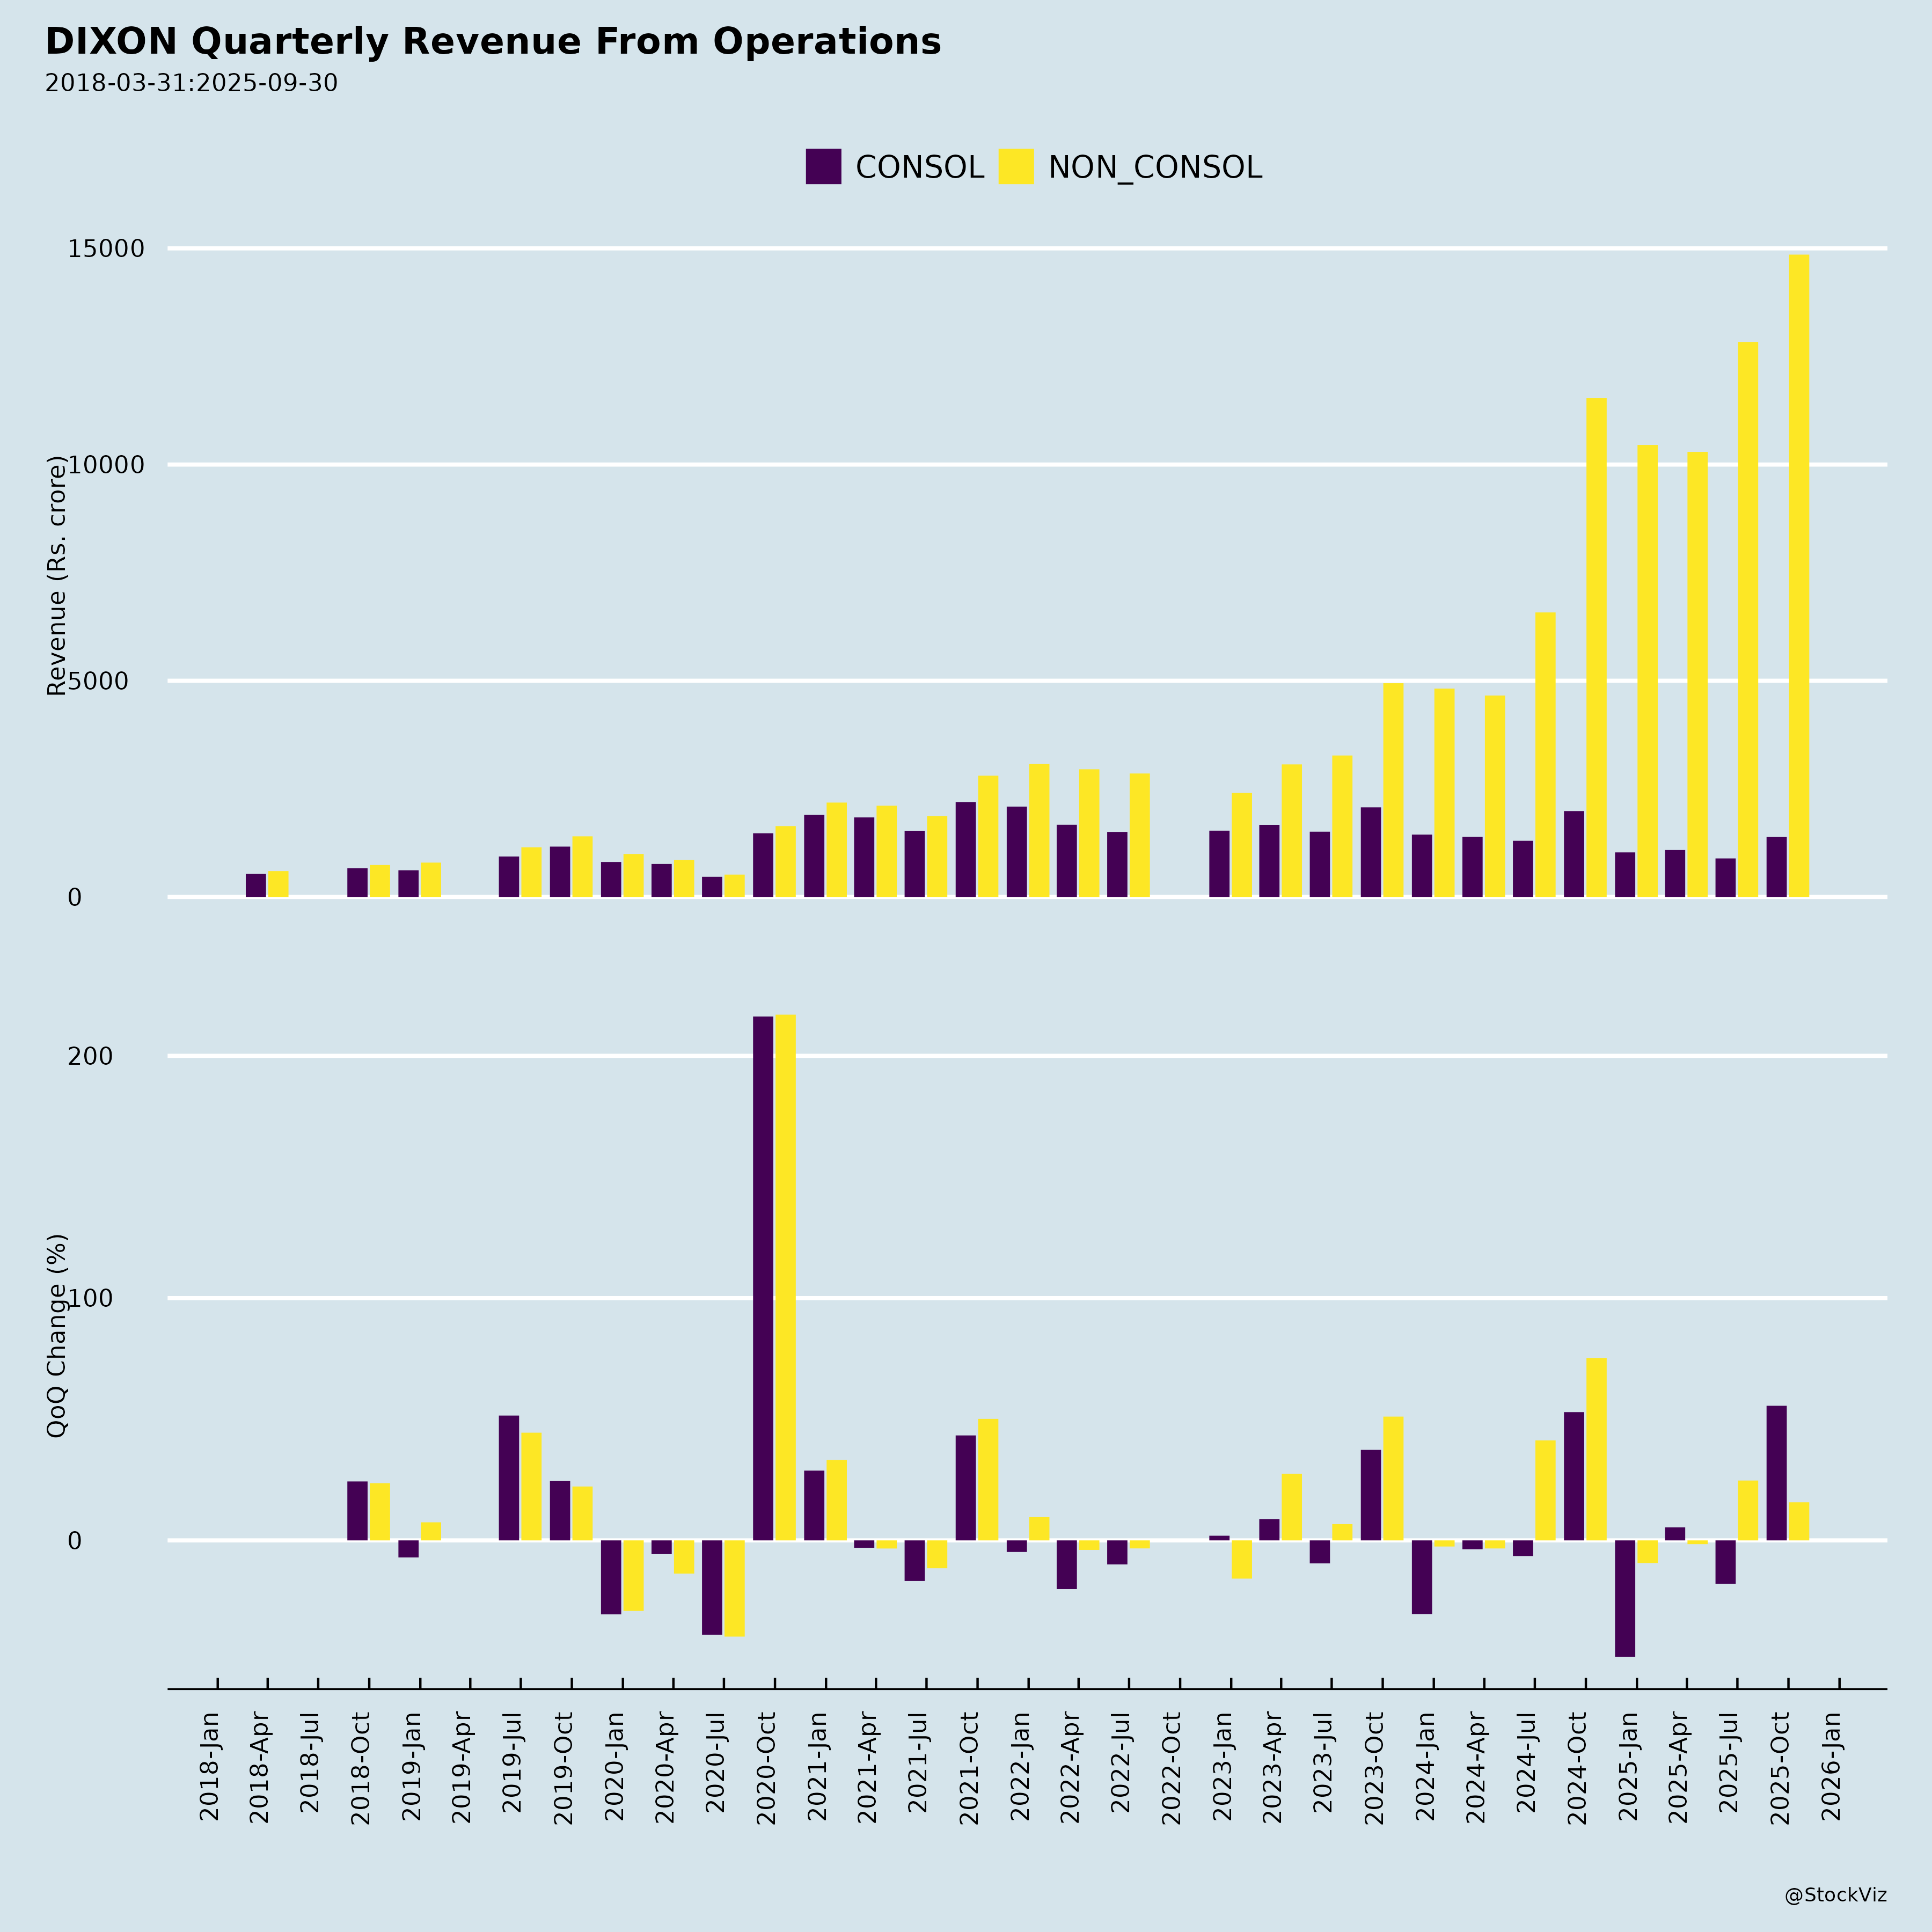
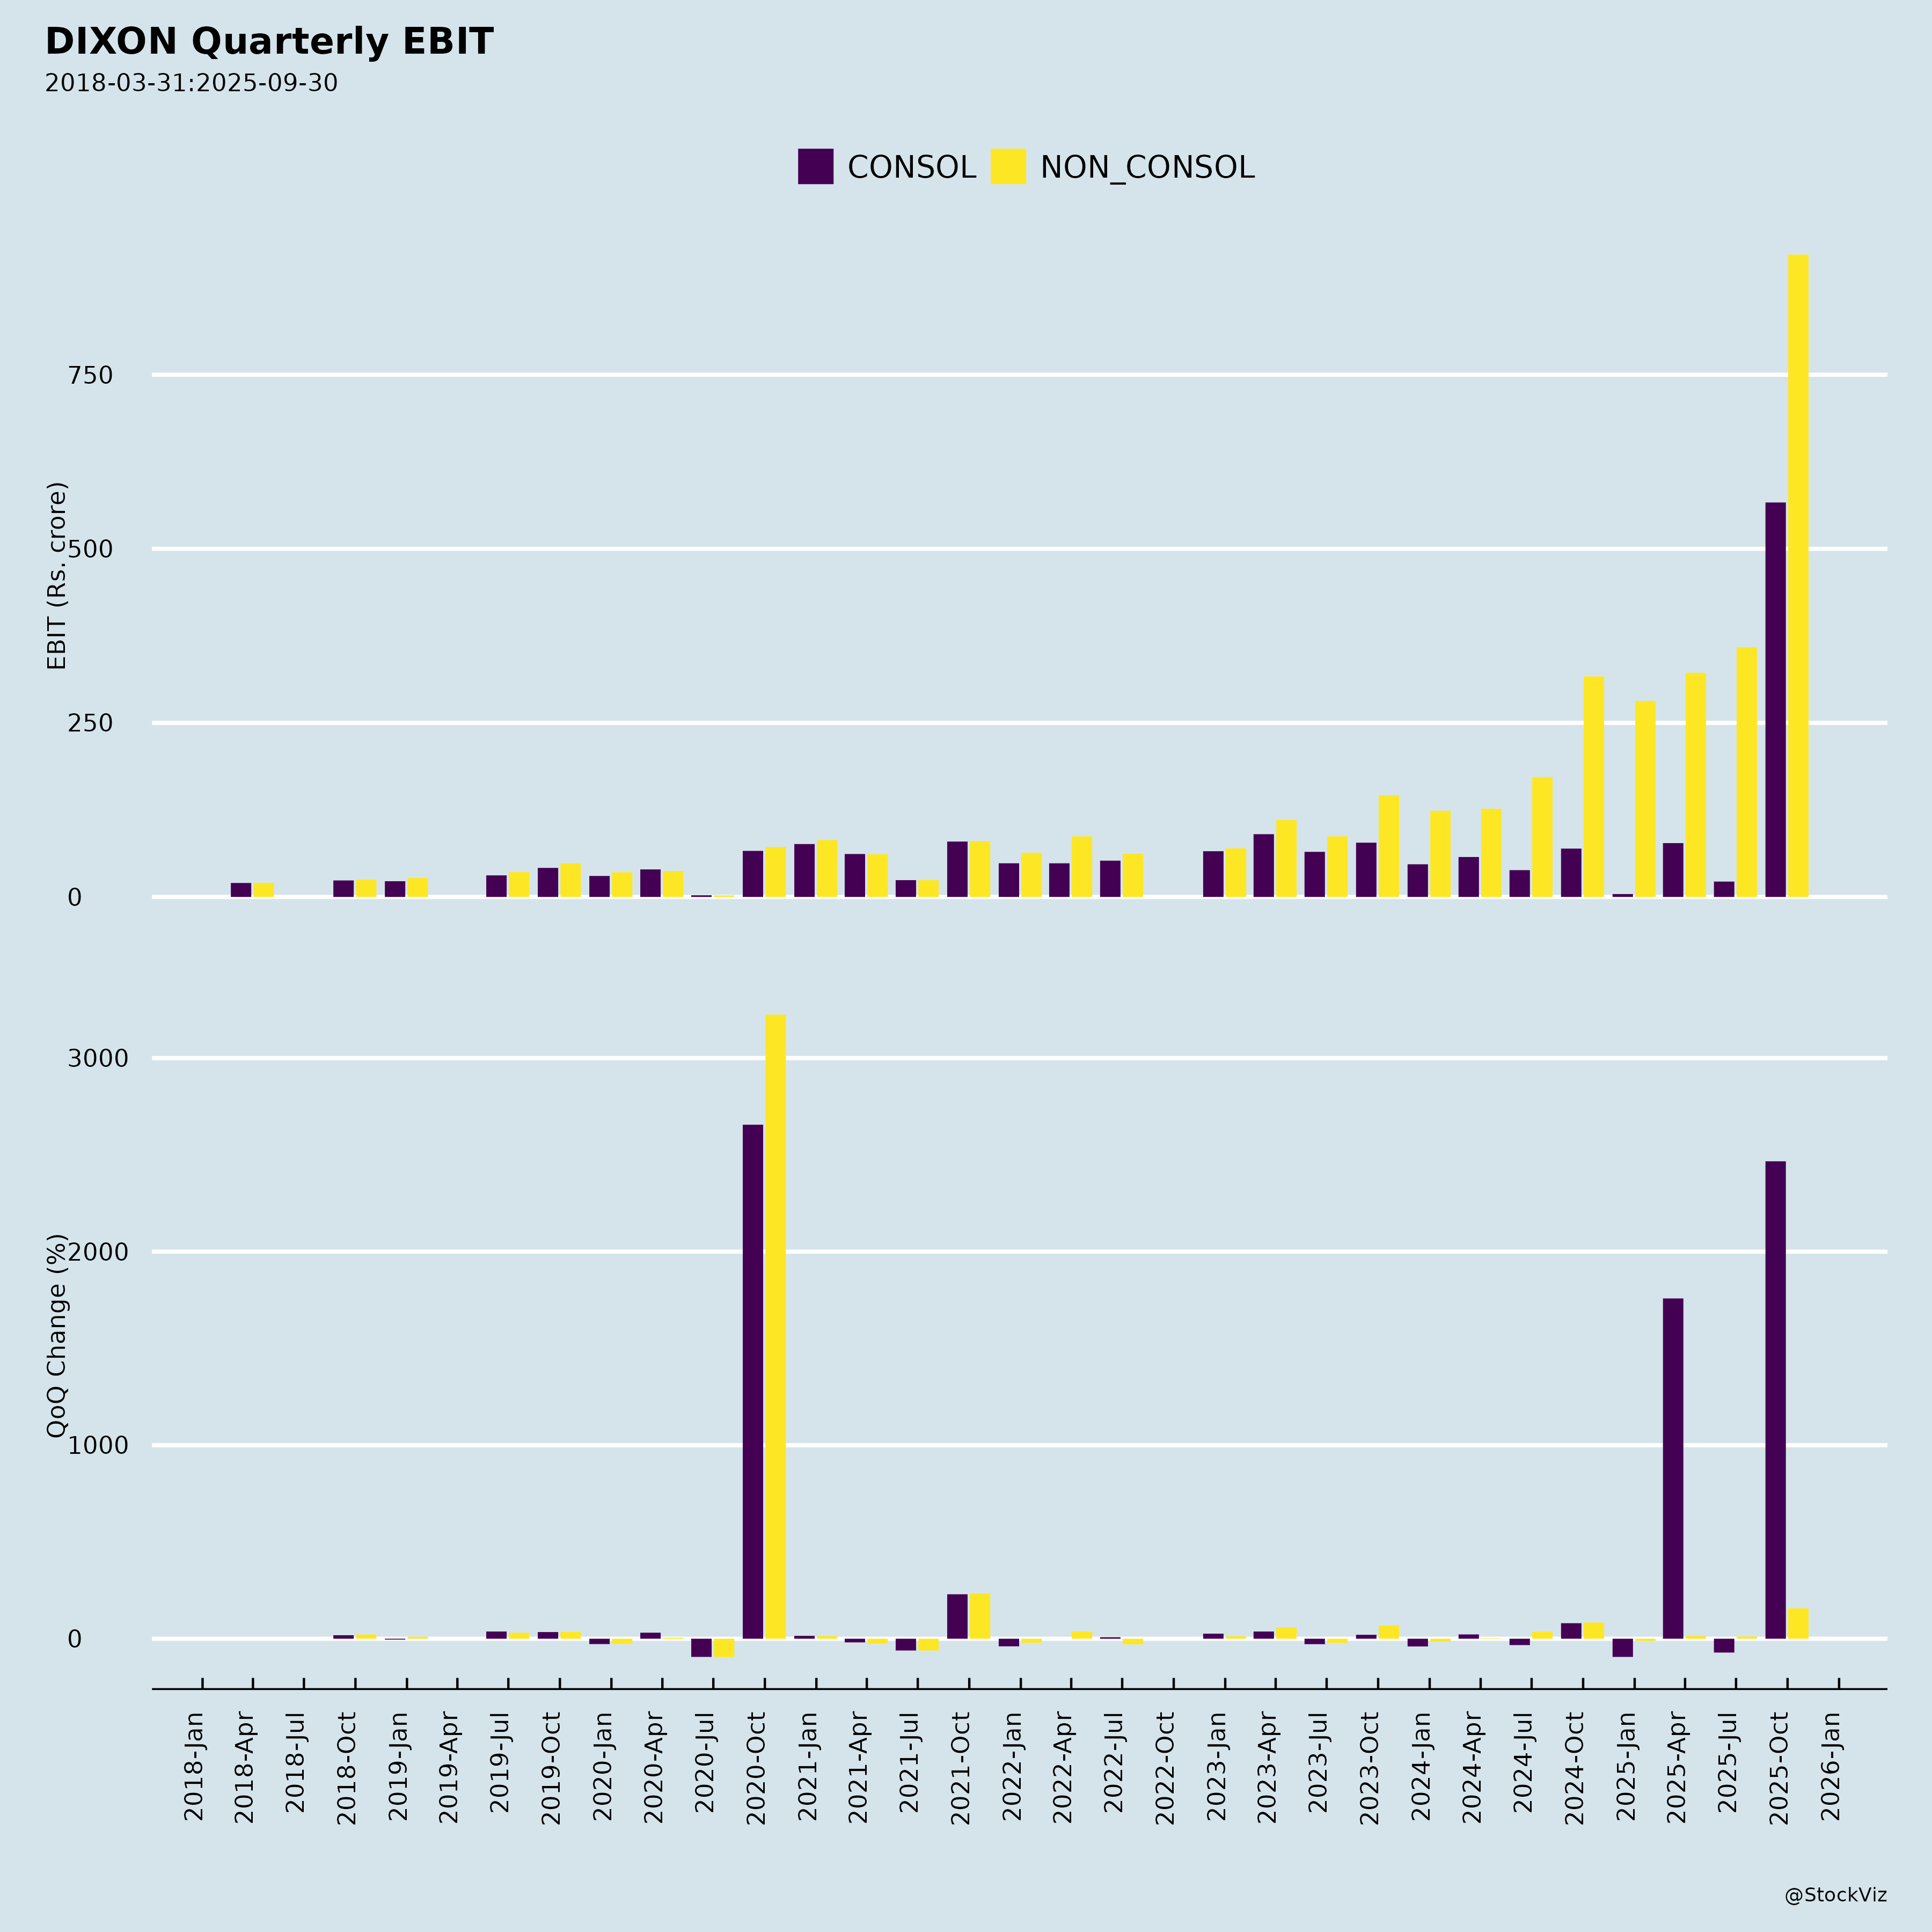
Dixon Technologies, a leading Indian EMS player, reported stellar Q2/H1 FY26 results (ended Sep 2025), with consolidated revenue of ₹15,351 Cr (+33% YoY) and ₹28,188 Cr (+56% YoY), driven by Mobile & EMS (71% share). Adjusted figures (excl. ₹465 Cr fair value gain on Aditya stake & ₹28 Cr lighting JV gain) show solid underlying growth (OP ₹564 Cr, +34% YoY; margins ~3.8%). Balance sheet remains strong (net cash ₹(62) Cr post short-term debt, negative WC days -6). Below is a structured summary based on the filings.
Tailwinds (Positive Drivers)
- Robust Demand & Execution: Mobile/EMS segment grew 15% QoQ (71% revenue mix), fueled by PLI/localization tailwinds. H1 revenue doubled YoY on scale.
- Operational Efficiency: Best-in-class WC cycle (-6 days vs. -5 FY25), high ROCE (49.1%, +60 bps), ROE (34.3%, +180 bps), FCF ₹324 Cr. Low net debt/equity (0.05x).
- Investor Appetite: 20+ institutional meetings (Dec 2025) with global funds (Invesco, JP Morgan, Fidelity). MSCI ESG ‘BB’ rating enhances appeal.
- Talent Retention: ESOP grants (7,000 options); remuneration hikes for key execs (Vachani/Lall to ₹15 Cr cap each) signal confidence.
- Capital Discipline: High capex (₹558 Cr H1) but funded internally; strong cash gen (ops ₹881 Cr).
Headwinds (Challenges)
- Margin Pressure: Reported EBITDA margin 7.1% inflated by one-offs; adjusted ~3.8% (flat YoY). Material costs at 92.9% (+50 bps YoY); other expenses down but dep’n/finance up on scale.
- Segment Concentration: Mobile/EMS dominates (71-80% rev/profit); Home Appliances/Consumer Elec stable but lower margins (e.g., Ref ROCE dragged by capex).
- Input Costs: High material intensity vulnerable to commodity/forex volatility (noted in cash flows).
- Scale-Up Costs: Capex/investments (₹559 Cr subs/JVs) strain short-term cash (investing outflow ₹1,011 Cr).
Growth Prospects
- High Visibility: FY26 guidance implicit via expansions (e.g., Q Tech India 51% acquisition for ₹553 Cr; Lightanium JV with Signify). Target sustained 50%+ rev CAGR (H1 +56%).
- Diversification: New verticals (microelectronics, lighting JV); 15+ subs/JVs for capacity (consol assets +17% to ₹19,650 Cr).
- Market Tailwinds: India EMS boom (PLI, China+1); Dixon’s leadership in mobiles/TVs positions for 20-30% industry growth.
- M&A/Partnerships: Recent deals (Aditya stake swap, Q Tech) unlock synergies; postal ballot for finance director elevates governance.
- Upside Potential: ROCE/ROE trajectory supports valuation; net cash enables bolt-ons.
Key Risks
| Risk Category | Description | Mitigation |
|---|---|---|
| Concentration | Revenue/client reliance (Mobile 71%; implied key OEMs like Samsung/Xiaomi). | Diversification via JVs/subs (15 entities). |
| Execution | Capex ramp-up (₹559 Cr H1); integration risks (Q Tech, Lightanium). | Proven track record; neg WC aids funding. |
| Macro/External | Commodity inflation, forex (gain/loss noted), US tariffs/China competition. | Hedging; localization focus. |
| Regulatory/Govt | PLI compliance, SEBI scrutiny (EPS clarification, remuneration approvals). | Strong compliance (unmodified audit). |
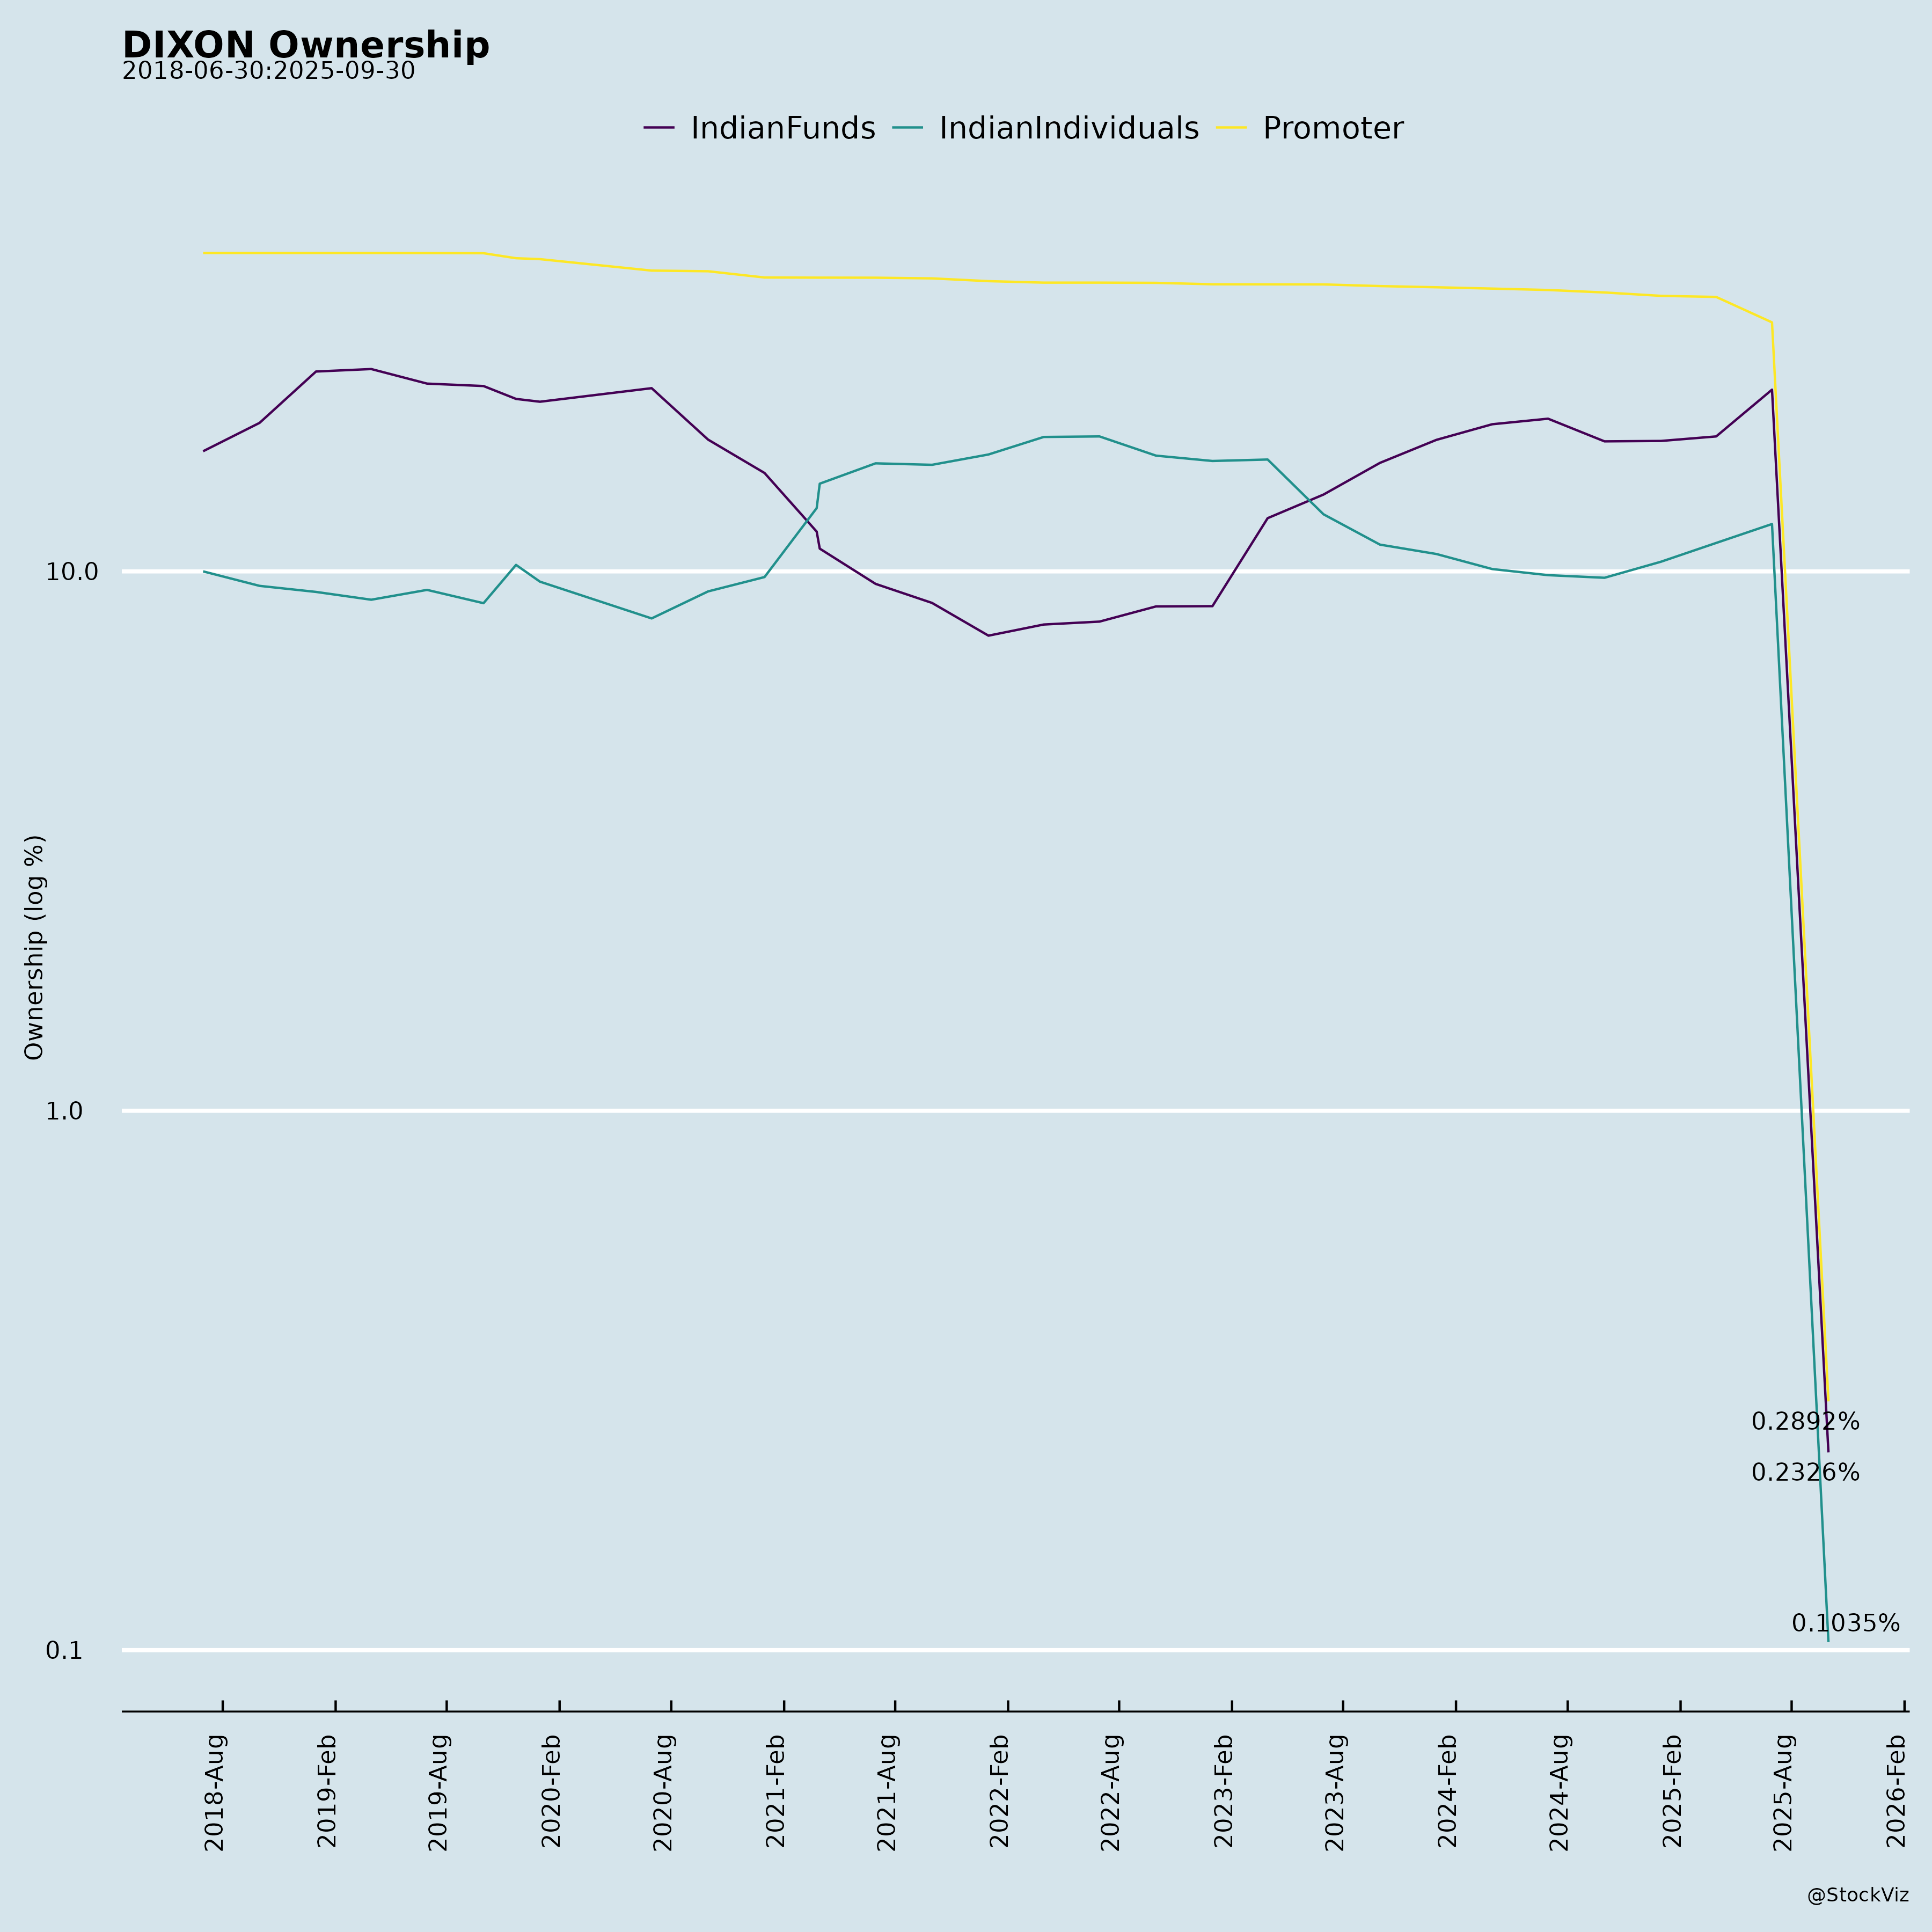
| Talent/Governance | Promoter-heavy (Vachani/Lall ~5% stake); ESOP dilution minor (7K options). | NRC oversight; indep directors. |
| Financial | Debt up (₹846 Cr gross); one-off dependency for margins. | Net cash positive; FCF strong. |
Overall Outlook: Strong tailwinds from EMS secular growth outweigh headwinds; 50%+ H1 growth sustainable into FY26. Risks manageable with balance sheet strength. Buy/Hold for growth investors; watch adjusted margins quarterly. (Valuation context: Not provided, but FY25 P/E ~50x implied strong momentum.)
Copyright © 2023 SAS Data Analytics Pvt. Ltd. All rights reserved.