DEEDEV
Equity Metrics
January 13, 2026
DEE Development Engineers Limited
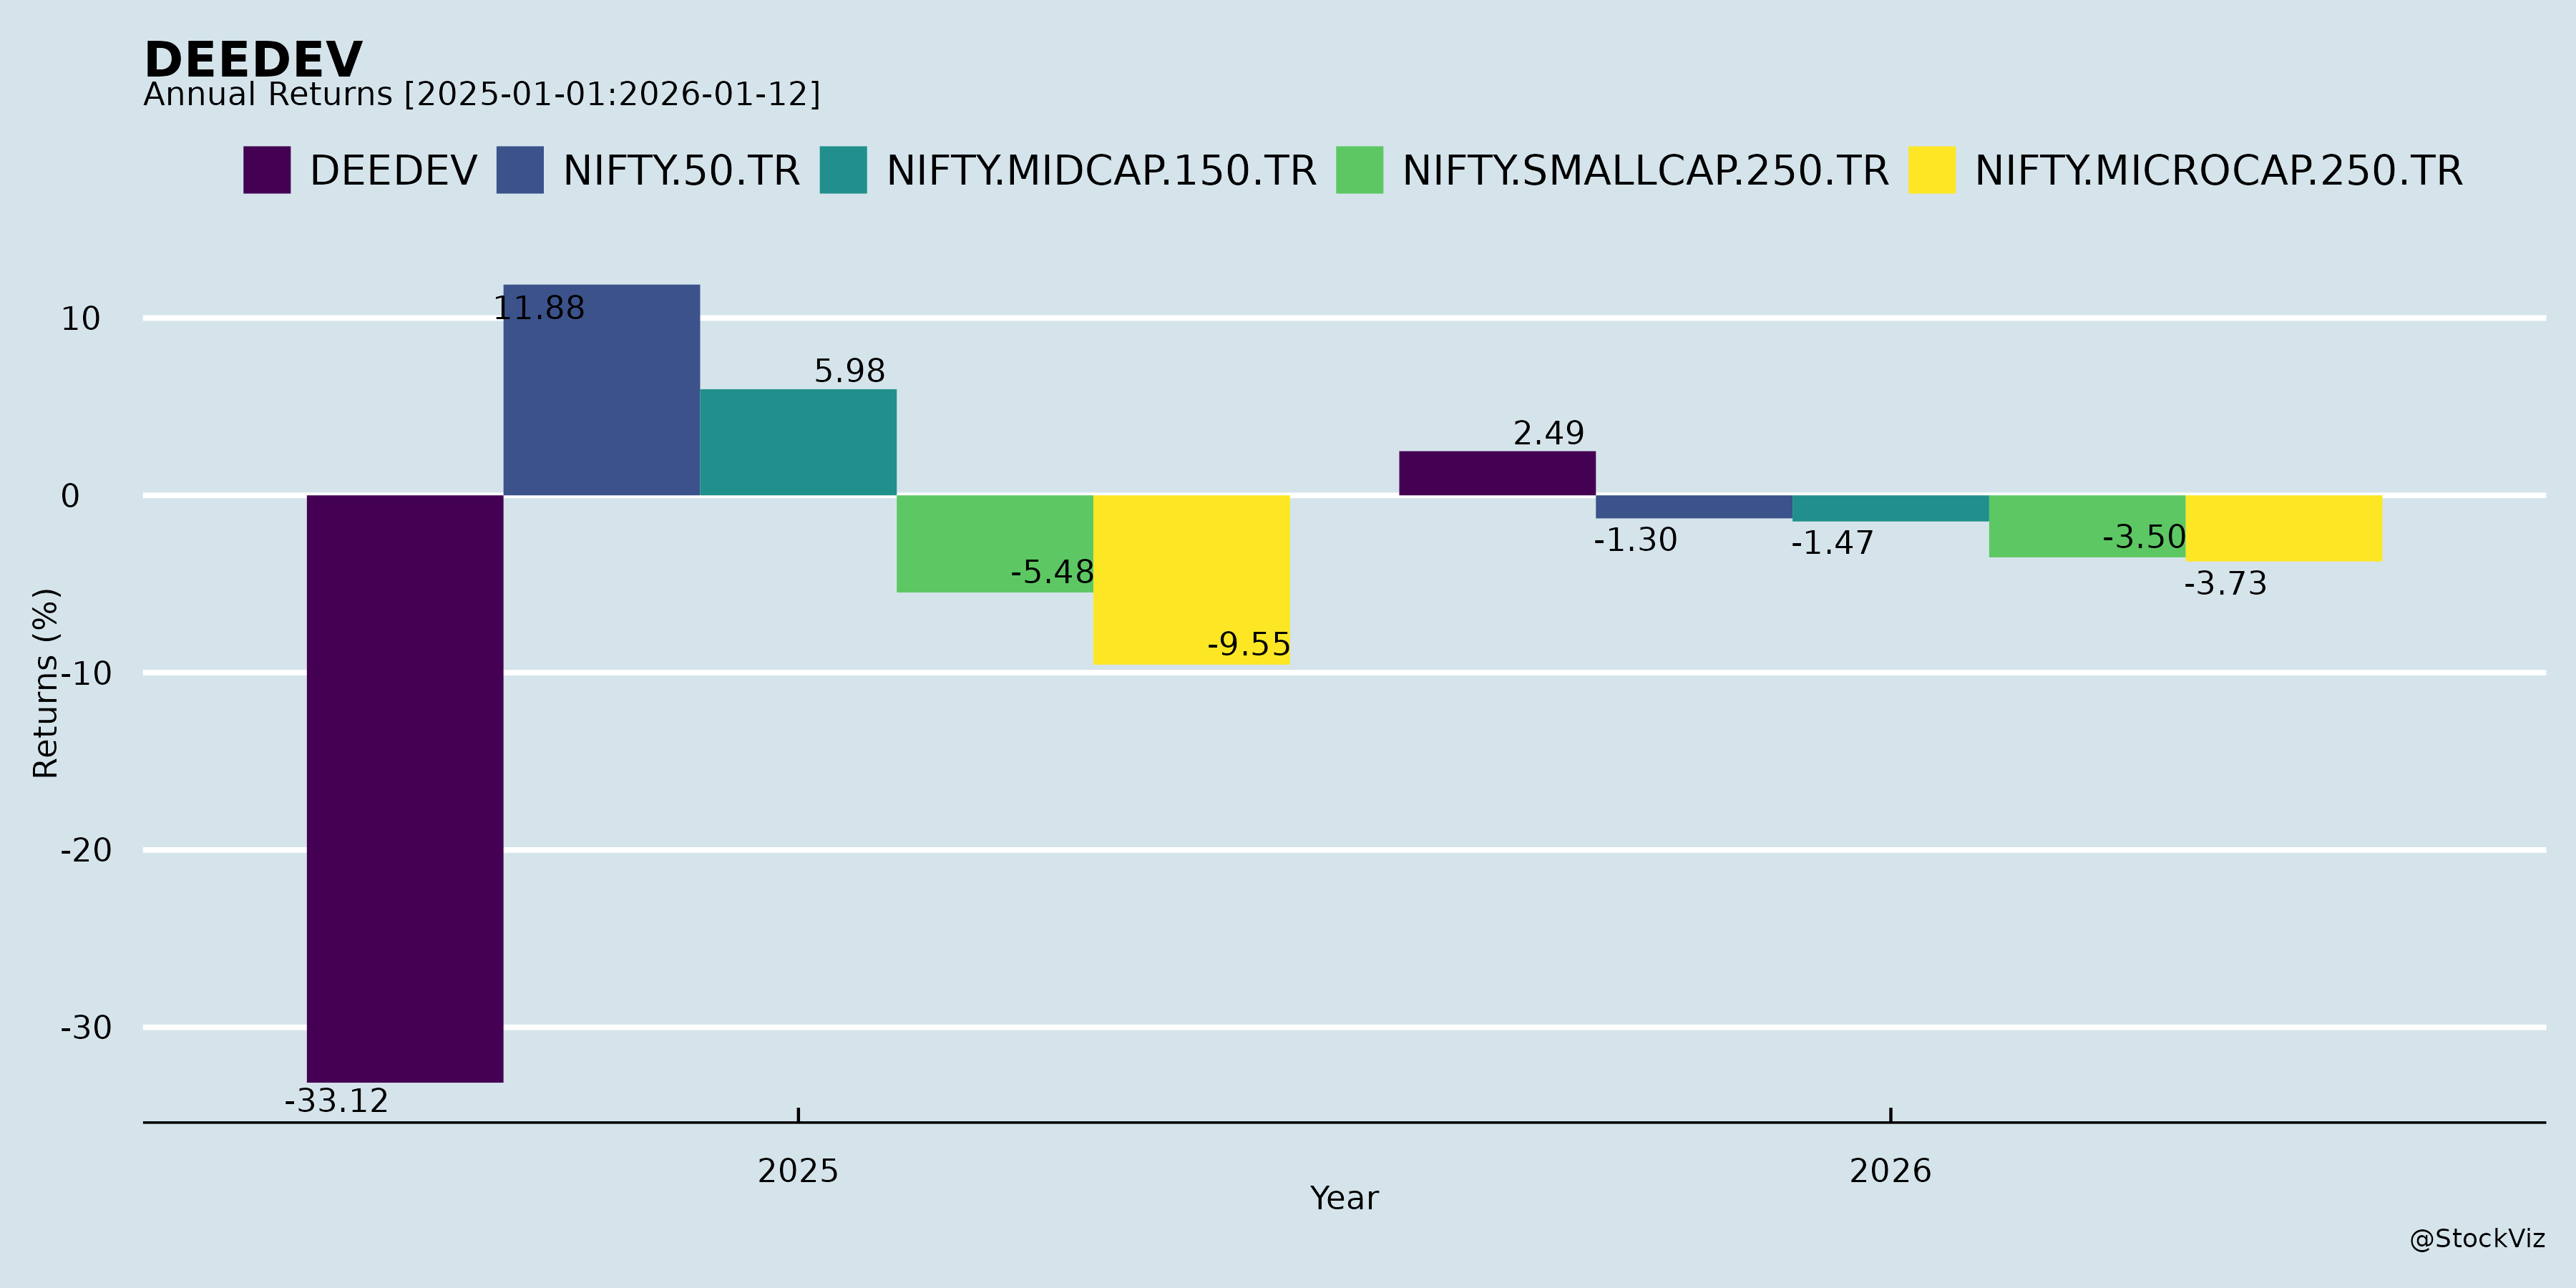
Annual Returns

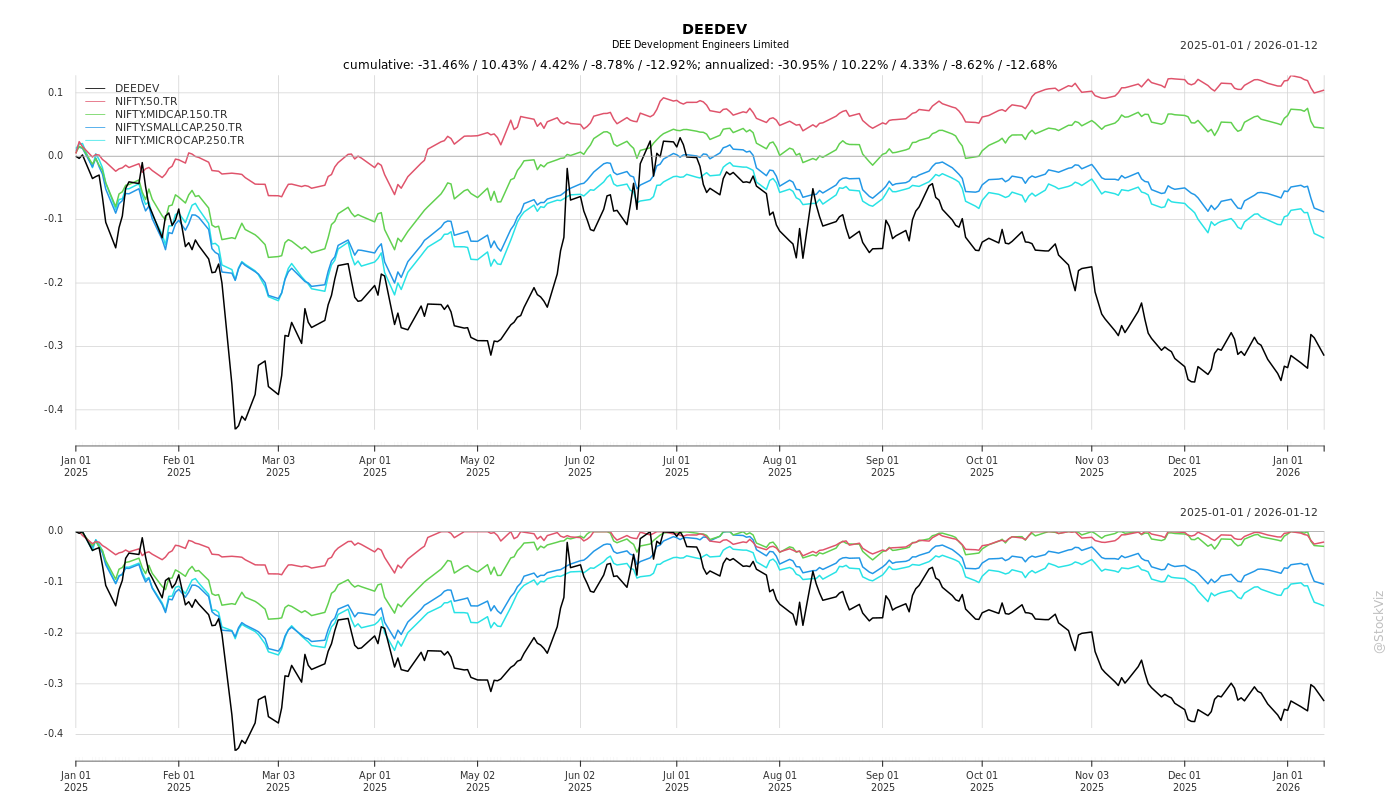
Cumulative Returns and Drawdowns
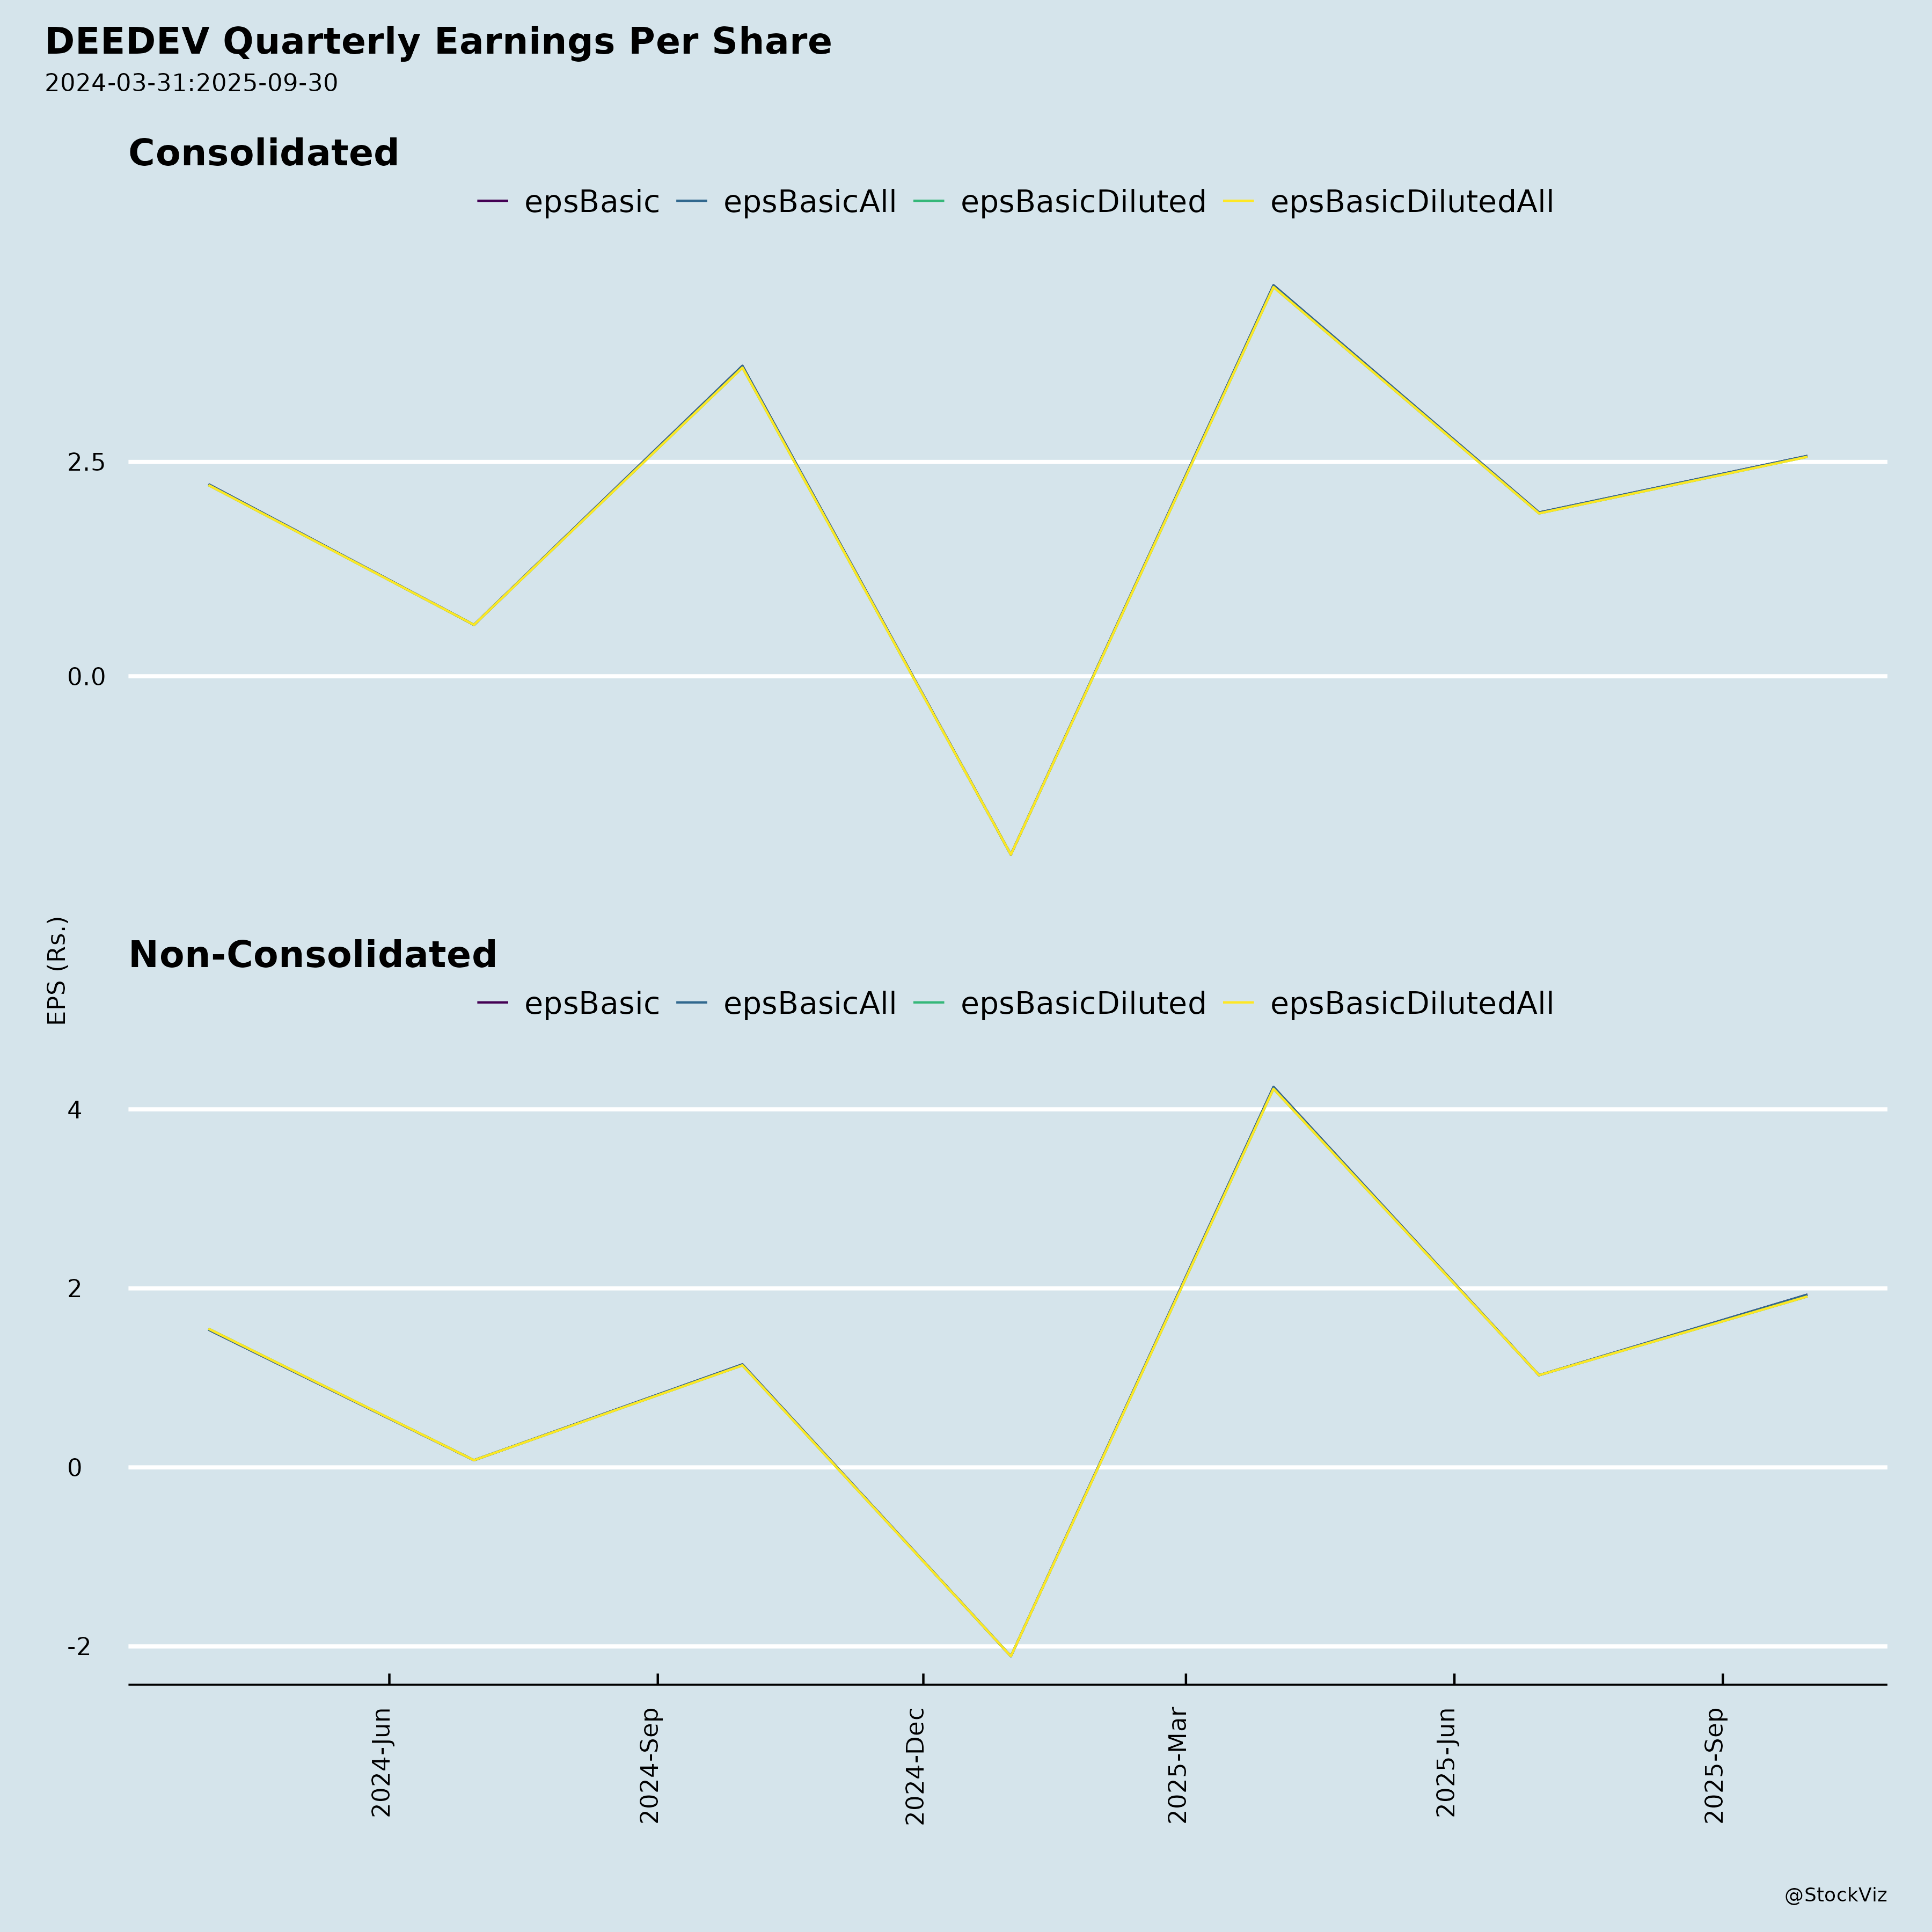
Fundamentals
Ownership

Margined
AI Summary
asof: 2025-12-08
Investment Analysis of DEE Development Engineers Limited (DEEDEV: 544198 | Symbol: DEEDEV)
As of November 2025
📌 Executive Summary
DEE Development Engineers Limited (DEEDEV) is India’s largest provider of specialized process piping solutions, with a strong international footprint, diversified industrial exposure, and deep vertical integration. The company has demonstrated robust operational and financial performance in Q2 and H1 FY26, driven by capacity expansion, rising demand in the power, oil & gas sectors, and strategic geographical positioning of its facilities.
Despite short-term volatility in headline PAT due to a non-recurring income spike in FY25, DEE’s underlying operational profitability has expanded sharply. Backed by powerful industry tailwinds, significant barriers to entry, and a resilient, experienced management team, DEE appears well-positioned for sustained growth.
This report analyzes the key growth tailwinds, headwinds, fundamental strengths, and major risks associated with DEEDEV.
✅ Key Tailwinds (Catalysts for Growth)
1. Strong Industry Tailwinds across Core Sectors
DEE operates in high-growth, capital-intensive industries with long-term investment cycles: - Power Sector: Indian government plans to add 80 GW of coal-based capacity by 2031–32, requiring ~₹6.67 lakh crore investment, driving demand for process piping. - Oil & Gas / Refining: India is the 2nd-largest refiner in Asia, with refining capacity expected to grow from 249 MTPA (FY23) to 450 MTPA by FY30 (CAGR: ~9%). - Chemicals & Pharmaceuticals: Installed chemical production expected to scale to 29 MTPA by FY30, requiring new plants and process infrastructure. - Nuclear & Specialized Industries: DEE supplies to nuclear projects and is expanding into pilot plants, a high-margin niche R&D segment.
Market Outlook:
- Global process piping market to reach USD 54.5 Bn by 2030 (CAGR: 4.8%)
- Indian process piping market expected to grow to INR 38,400 Cr by 2030 (CAGR: ~6.1%)
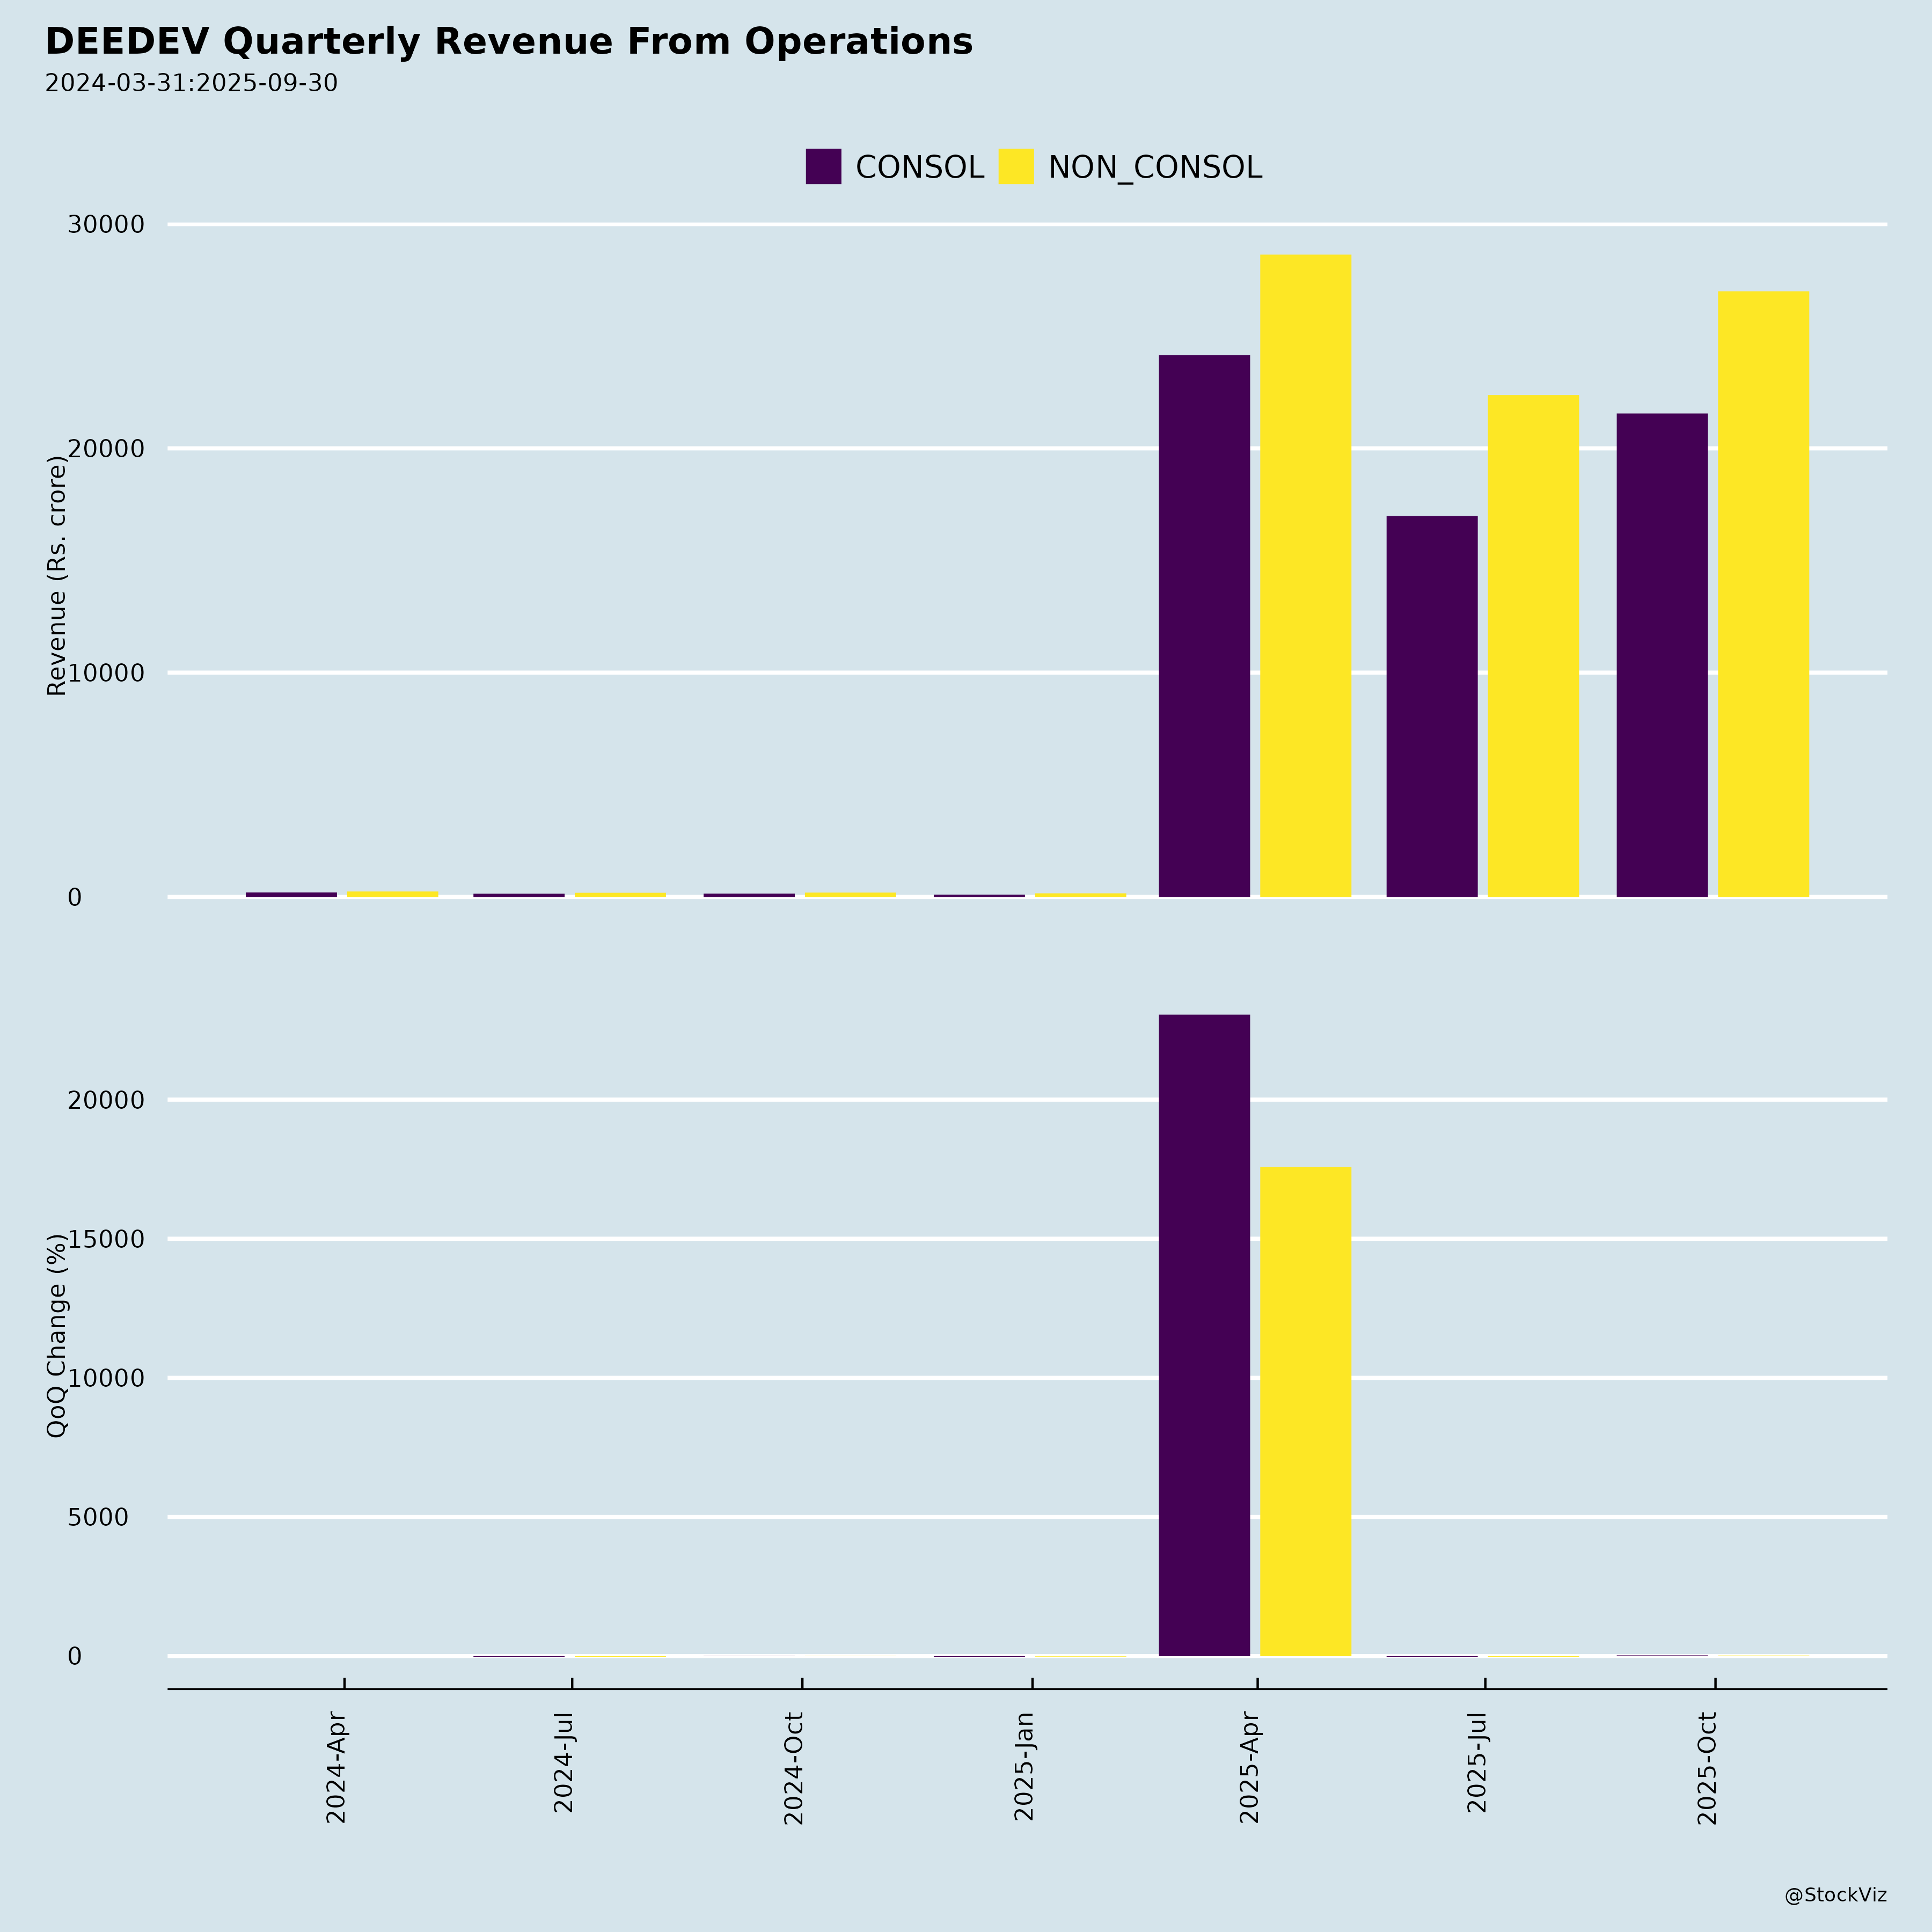
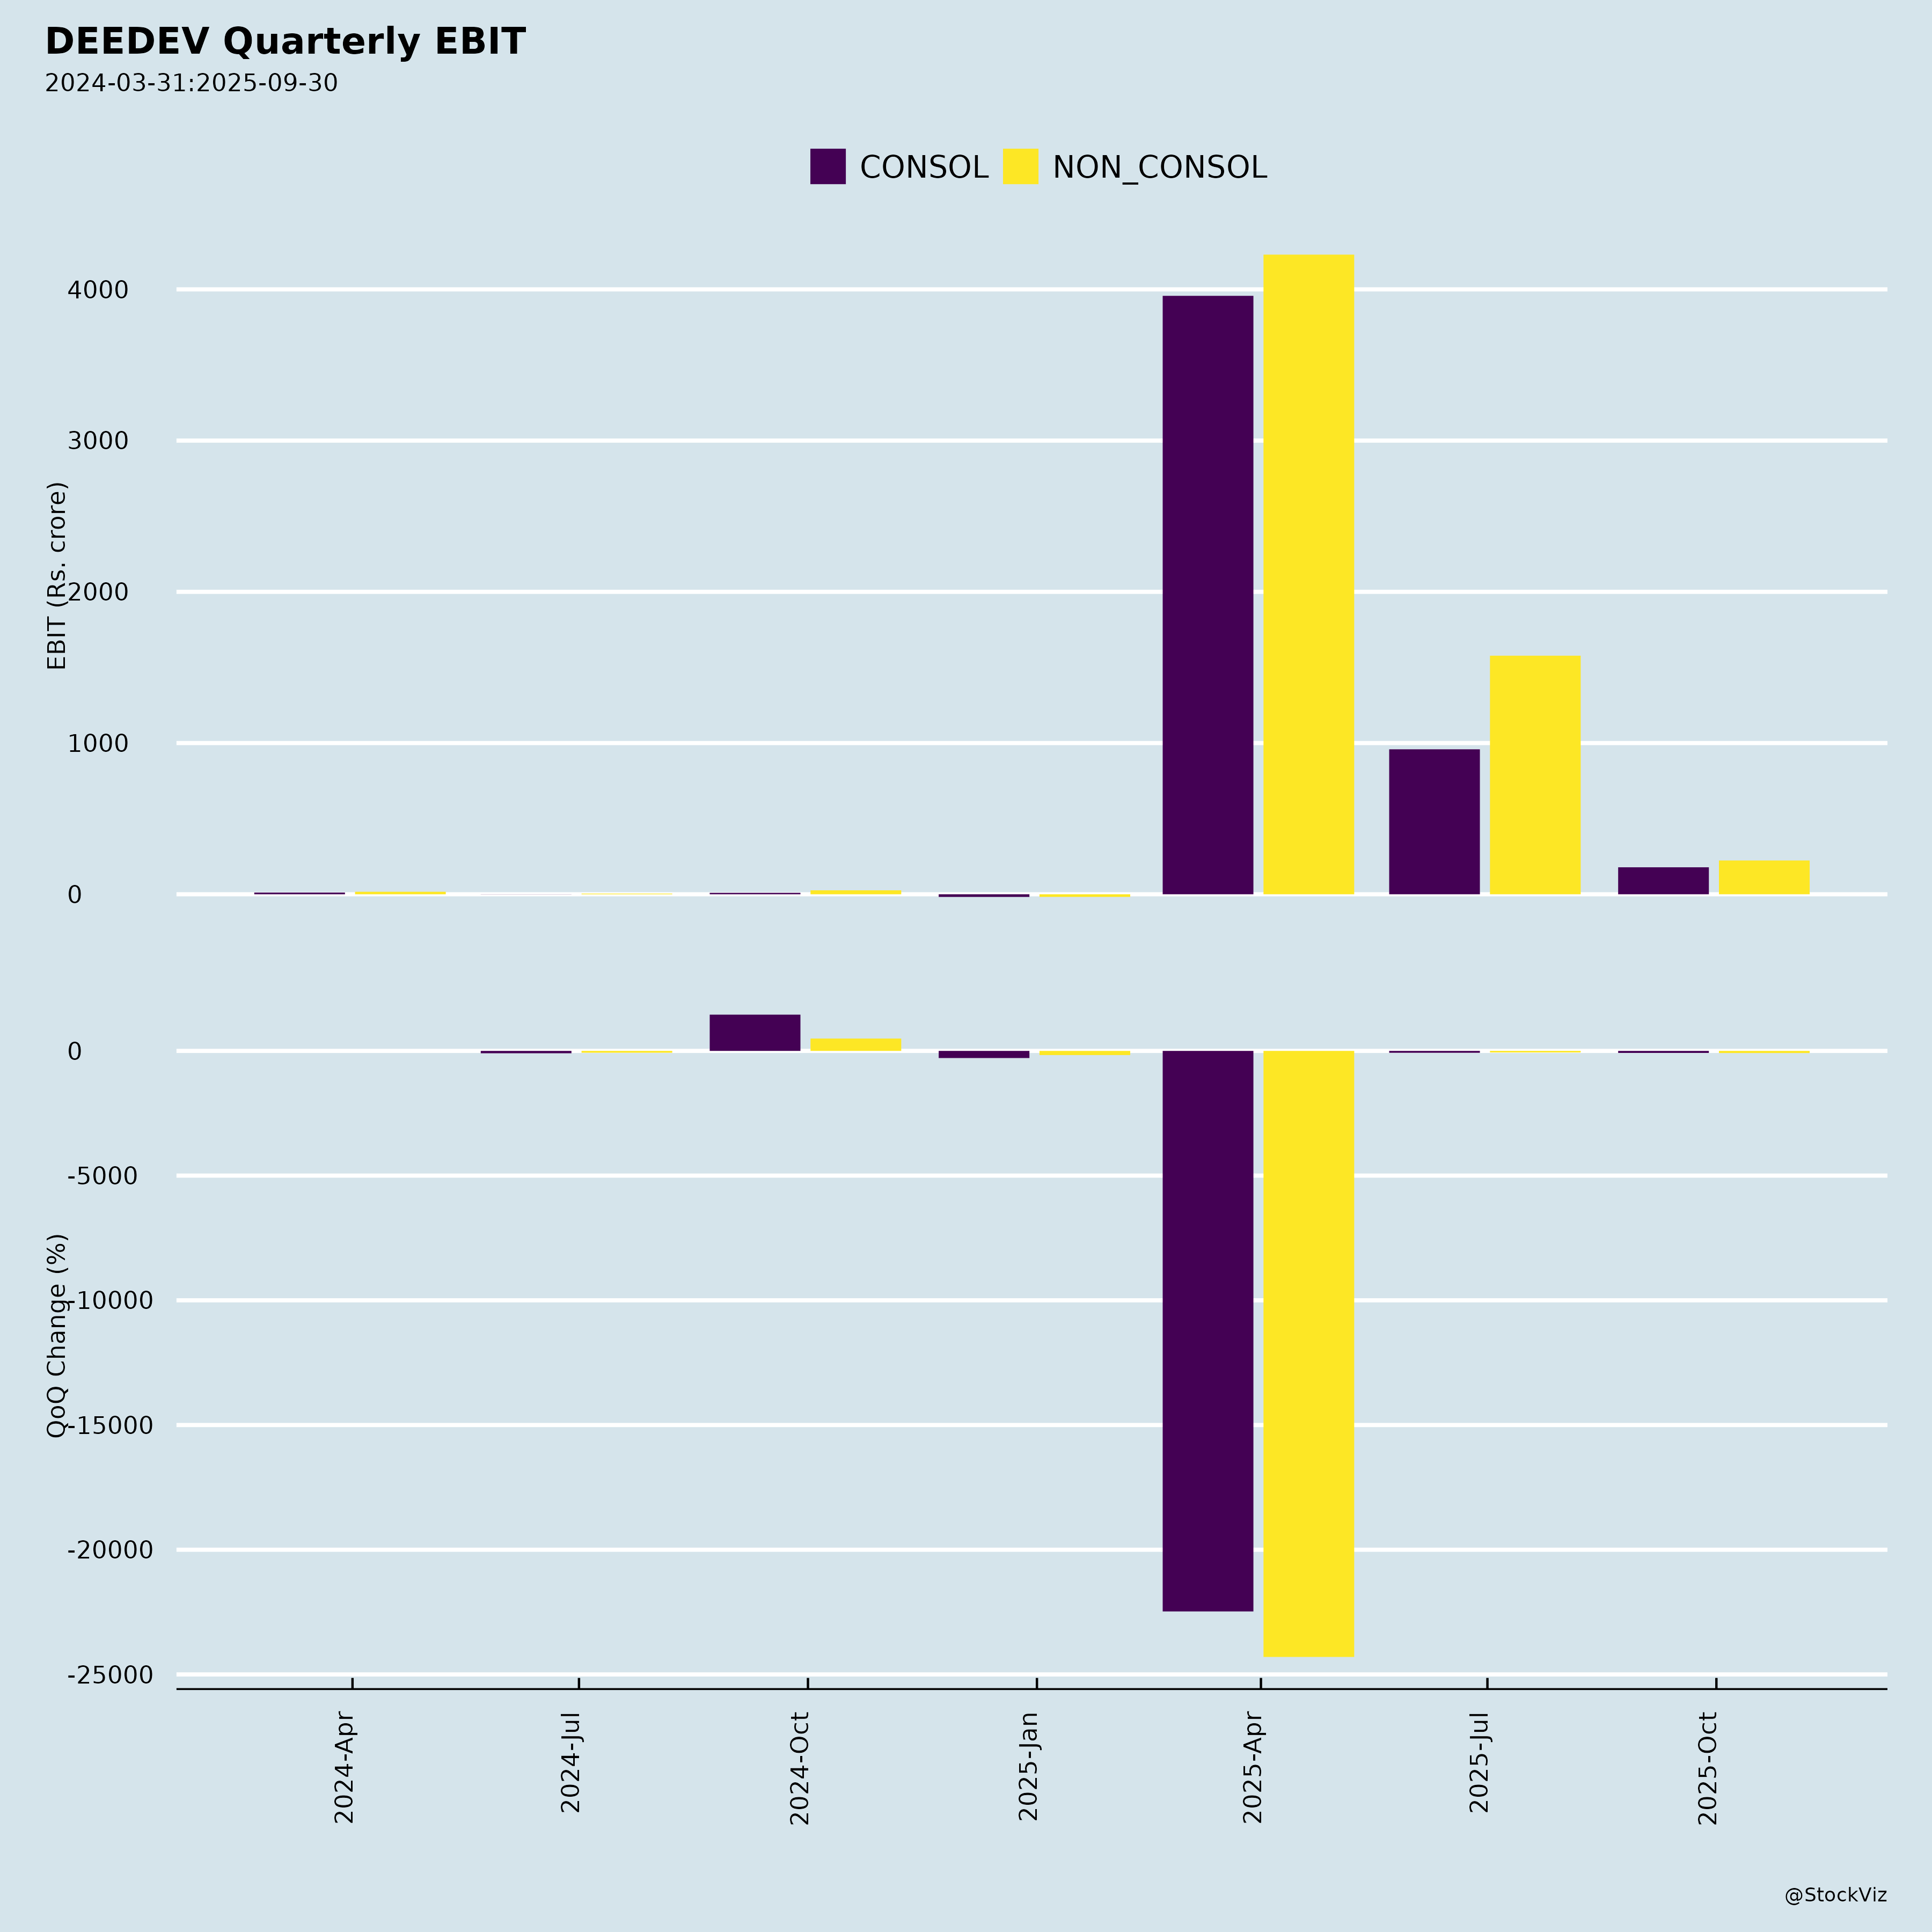
2. Robust Financial & Operational Performance (H1 FY26)
- Revenue from Operations: ₹4,938 Cr (+30.3% YoY)
- Operating EBITDA: ₹799 Cr (+46.4% YoY), margin expanded to 16.2% (+179 bps)
- PAT: ₹311 Cr (+22.1% YoY) — excluding prior-year non-recurring income, underlying PAT growth was ~154%
- Sequential Growth: Q2 FY26 EBITDA up 47.9% YoY, revenue up 39.2% YoY
This reflects strong operational leverage and execution efficiency.
3. Capacity Expansion & Strategic Integration
- Anjar Facility II (Sept 2025): Commissioned 15,000 MT capacity, increasing Anjar’s total piping capacity to 30,000 MTPA.
- Seamless Pipe Plant (7,000 MT): On track for commercial production by January 2026, enhancing backward integration and cost control.
- Numaligarh (Assam) and Barmer/Rajasthan facilities support regional and project-specific demand, improving logistics efficiency.
These expansions align with anticipated capex cycles, mirroring DEE’s strategy of anticipating demand and pre-positioning capacity, as successfully done during FY13–16.
4. Diversified, Global Customer Base
- Operates in 27 countries, serving clients in USA, Canada, Nigeria, Germany, Thailand, Japan, etc.
- Diversified across end-sectors: Power, Oil & Gas, Chemicals, Pharmaceuticals, and Nuclear.
- Long-standing customer relationships ensure order visibility and lower churn.
5. Expansion into Adjacent High-Growth Business Verticals
- Pilot Plant Development: New vertical for R&D-scale industrial plants, targeting:
- Oil & gas, petrochemicals, refineries
- Specialty chemicals, pharmaceuticals
- Research institutions
- One-stop solution from design, process simulation, fabrication, to commissioning, creating recurring relationship models.
This diversifies revenue and taps into early-stage value chain with strong margins.
6. Operational & Financial Resilience
- Net Debt / Equity: 0.64x (H1 FY26) – manageable leverage
- Net Debt / EBITDA: 3.36x (annualized) – high but justifiable due to ongoing capex and revenue ramp-up
- Strong order book of ₹1,308 Crores (as of Sept 2025)
- Strategic decision to pause equity fundraise due to improving cash flow and access to bank limits
Indicates financial flexibility and confidence in cash generation.
7. Promoter-Driven, Deep-Tech Leadership
- Promoter CMD Mr. K.L. Bansal has led since 1988, with extensive domain expertise.
- Experienced CFO (Sameer Agarwal), COO (Pankaj Agarwal), and independent board members from EIL, Ordnance Board, Sita Singh & Sons.
- Management owns significant stake and has long-term incentives aligned with stockholders.
❌ Key Headwinds & Challenges
1. Rising Finance Cost & Leverage
- Finance Costs: ₹252 Cr (H1 FY26) up 38.4% YoY — the fastest-growing expense item
- Net Debt rose to ₹5,369 Cr (from ₹4,248 Cr in Mar 2025) due to capex and working capital
- Net Debt / EBITDA of 3.36x is on the higher side; although expected to decline with EBITDA growth, it remains a near-term concern
Requires continued deleveraging and strong operating cash flow to reduce risk.
2. Capital Intensity & Capex Pressure
- DEE is highly capital-intensive (7 facilities, automation, seamless pipe plant)
- Strategic capex: ₹1,398 Cr during FY23-FY24, with more planned
- While returns are visible, delay in revenue ramp-up or project delays could pressure margins.
High cash conversion cycle of ~243 days indicates working capital pressure and inventory/sales timing risks.
3. Dependence on Cyclical Capex Cycles
- DEE’s growth is tied to government and private sector capex in power, refining, and chemicals.
- Slower-than-expected capex release (due to policy or macro reasons) can lead to order book delays.
- The company expanded capacity before demand surge, so utilization depends on execution of announced projects.
Requires close monitoring of fiscal policy and industrial execution.
4. Regulatory & Legal Risks – Abohar Biomass Tariff Dispute
- Litigation with PSPCL: Challenging a reduction in variable tariff from ₹5.89 to ₹3.897/kWh, with retrospective recovery demands.
- The matter is sub judice at Punjab & Haryana High Court.
- Resolution may lead to revenue adjustments or receivable disputes.
Financial impact is limited (8 MW plant), but revenue risk / cash flow uncertainty persists.
5. Lower Power Division Revenue Mix
- Power Division contribution fell from 11.2% (H1 FY25) to 5.2% (H1 FY26)
- While this may reflect shifting focus to higher-margin oil & gas/pilot projects, it indicates volatility in demand cycles.
Needs balanced portfolio strategy to mitigate sectoral downturn risks.
6. Capacity Utilization Constraints
- Overall capacity utilization: 39% (H1 FY26),
- Barmer, Anjar Facility I, New Anjar I: Near-zero utilization
- Full benefit of capex will only be realized upon order absorption and sustained production.
Lag between capex and meaningful utilization poses margin dilution risk in the short term.
🔮 Growth Prospects
Short-Term (FY26–FY27)
- Strong H1 performance suggests annual revenue ~₹10,000 Cr, EBITDA ~₹1,600 Cr, PAT ~₹630 Cr (normalized).
- Seamless pipe plant coming online by Q4 FY26/April 2026 will improve value-added product mix.
- Pilot plants to contribute initial revenue and high-margin engineering services.
- Continued traction in thermal power with new orders of ₹170 Cr.
Medium-Term (FY27–FY29)
- Target 65–70% capacity utilization across facilities as orders scale.
- Expand market share in export markets (Africa, Southeast Asia, Middle East).
- Leverage Modular Skids & Induction Bends — higher-margin specialized products.
- Explore technology partnerships with global OEMs for integrated projects.
Long-Term (FY30 and Beyond)
- Positioned to capitalize on India’s industrial modernization, energy security, and greenfield projects.
- Could become a pan-Asian process piping champion with modular skid and pilot plant leadership.
- Potential for international M&A or JV partnerships in high-growth markets.
⚠️ Key Investment Risks (Ranked)
| Risk | Impact | Mitigation |
|---|---|---|
| 1. Delay in Capex-to-Order Conversion | High | Close alignment with project pipelines; strong order book |
| 2. High Leverage & Interest Cost Pressure | High | Deleveraging plan; improving cash flow; strong bank support |
| 3. Regulatory Dispute (PSPCL Tariff) | Medium | Legal recourse; isolated to 8 MW plant |
| 4. Prolonged Low Capacity Utilization | Medium | Gradual order absorption; demand visibility in pipeline sectors |
| 5. Macro Capex Slowdown | Medium | Diversification; export expansion |
| 6. Commodity Price Volatility (Steel) | Medium | Long-term pricing contracts; embedded in project margins |
📊 Valuation & Investor Positioning
DEE’s PAT growth of 22% YoY, operational EBITDA growth of 46%, and expansion in EBITDA margins indicate strong earnings quality. The temporary dip in PAT margin (6.5% vs 10.6% FY25 Q2) is misleading — adjustment for prior-year non-recurring income reveals 70% underlying profit growth.
The company: - Is not over-levered for its growth profile - Has high barriers to entry (technology, scale, certifications) - Operates in large, growing markets - Is actively deleveraging - Has a transparent, promoter-led governance structure
✅ Conclusion: Recommendation Outlook
Growth Outlook: Strong | Risk Profile: Moderately High | Moat: Strong Niche Leadership
Verdict: 🟢 Positive / Accumulate
DEEDEV is a compelling investment for growth-oriented investors seeking exposure to India’s industrial capex revival, especially in power, refining, and chemical sectors. The company has demonstrated consistent execution, capacity leadership, and strategic foresight.
While leverage and short-term regulatory risks exist, the strong order book, diversified end markets, and expansion into pilot plants provide a robust foundation for sustained outperformance.
Key to Monitor Going Forward:
- Seamless pipe plant ramp-up (Q3–Q4 FY26)
- EBITDA margin trajectory (target: 16.5%+)
- Net debt trend and interest cost control
- Resolution of PSPCL tariff dispute
- Pilot plant order conversions and margins
With sound fundamentals and favorable macro winds, DEEDEV can re-rate as a leader in India’s industrial engineering space.
For detailed financials, visit: www.deepiping.com
Note: All data based on unaudited financials for Q2 and H1 FY26 (Quarter ended 30-Sep-2025).
Copyright © 2023 SAS Data Analytics Pvt. Ltd. All rights reserved.