BANDHANBNK
Equity Metrics
January 13, 2026
Bandhan Bank Limited
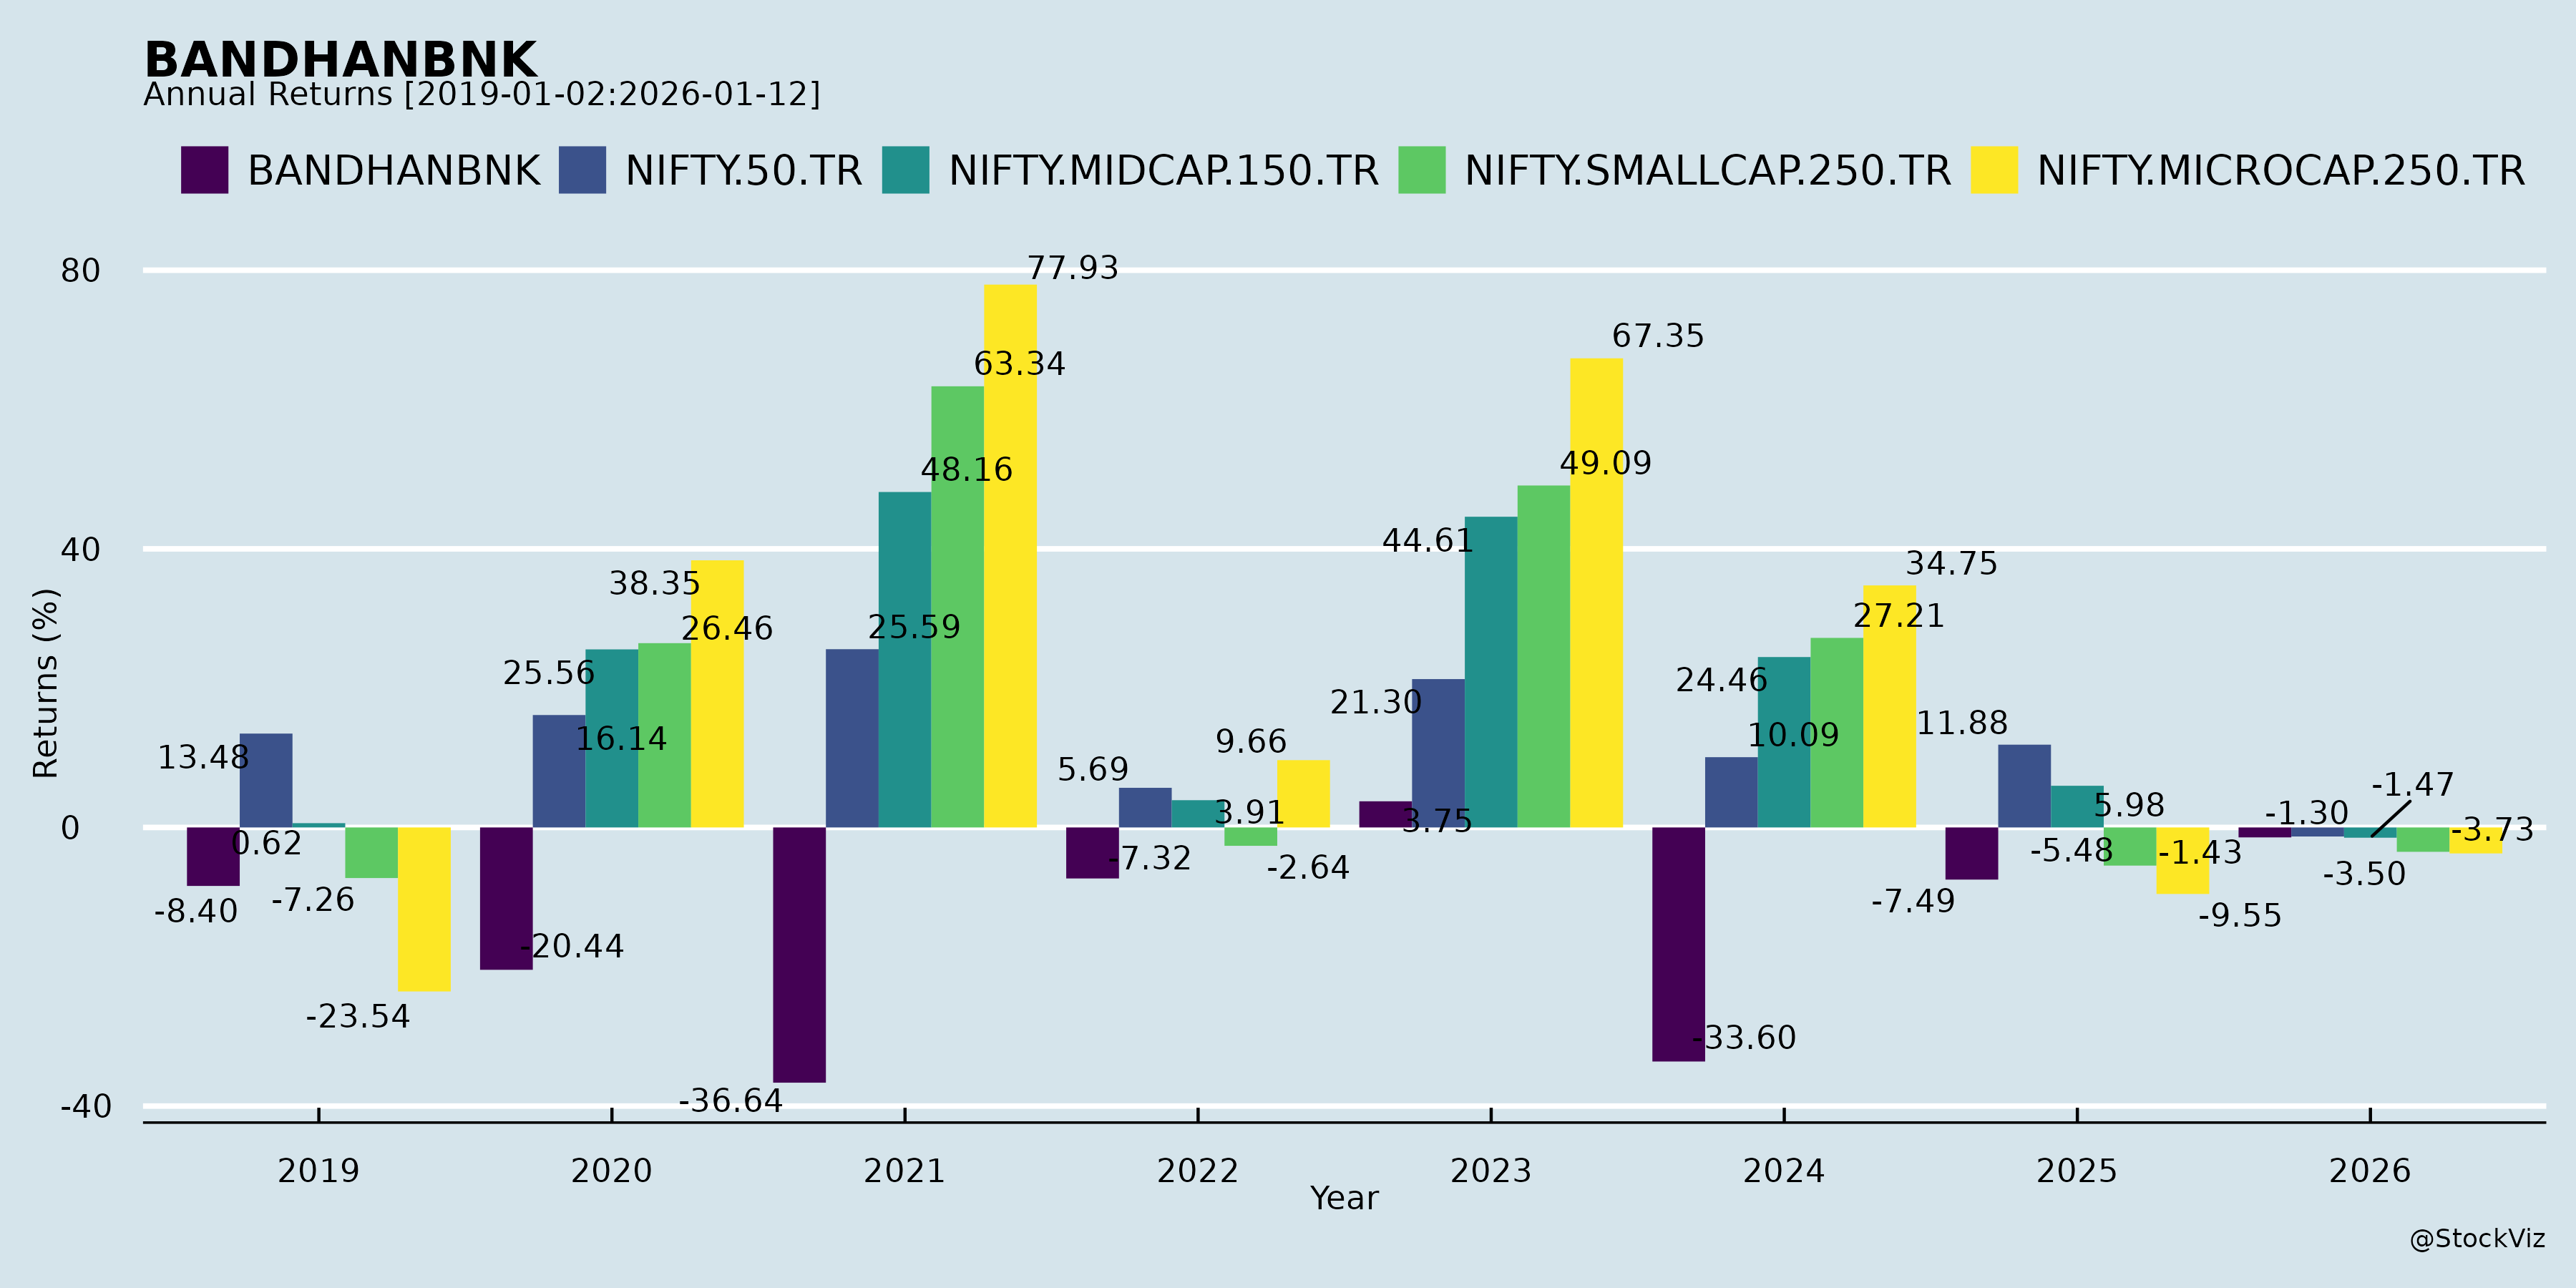
Annual Returns
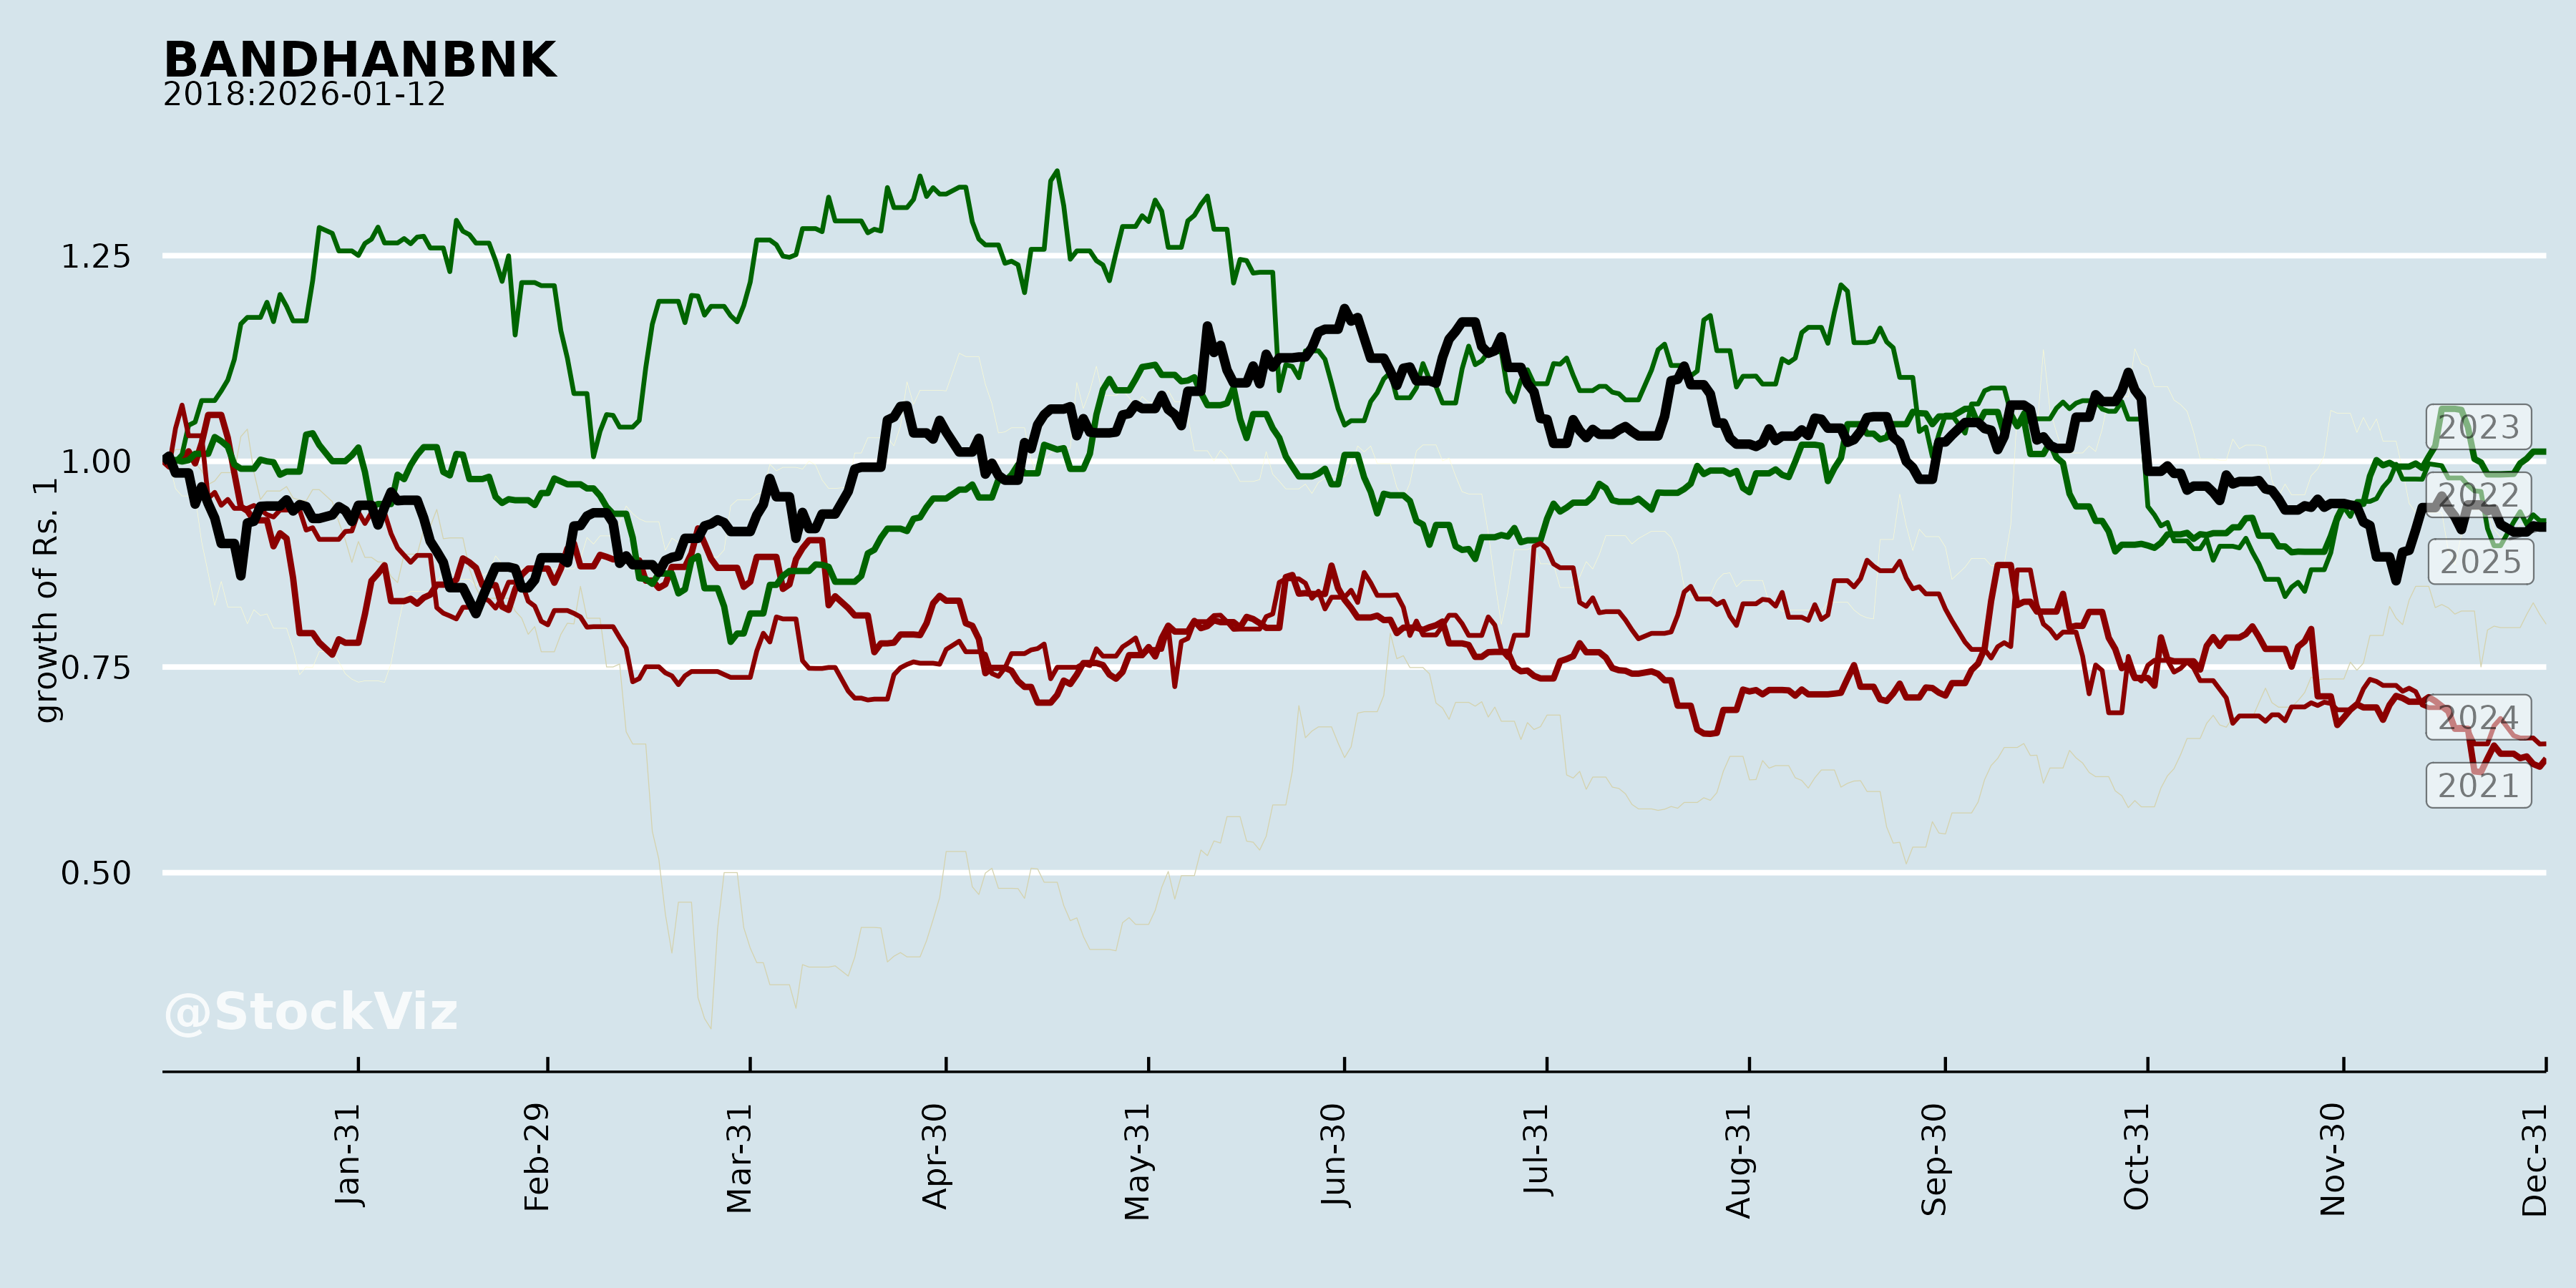
Cumulative Returns and Drawdowns


Fundamentals

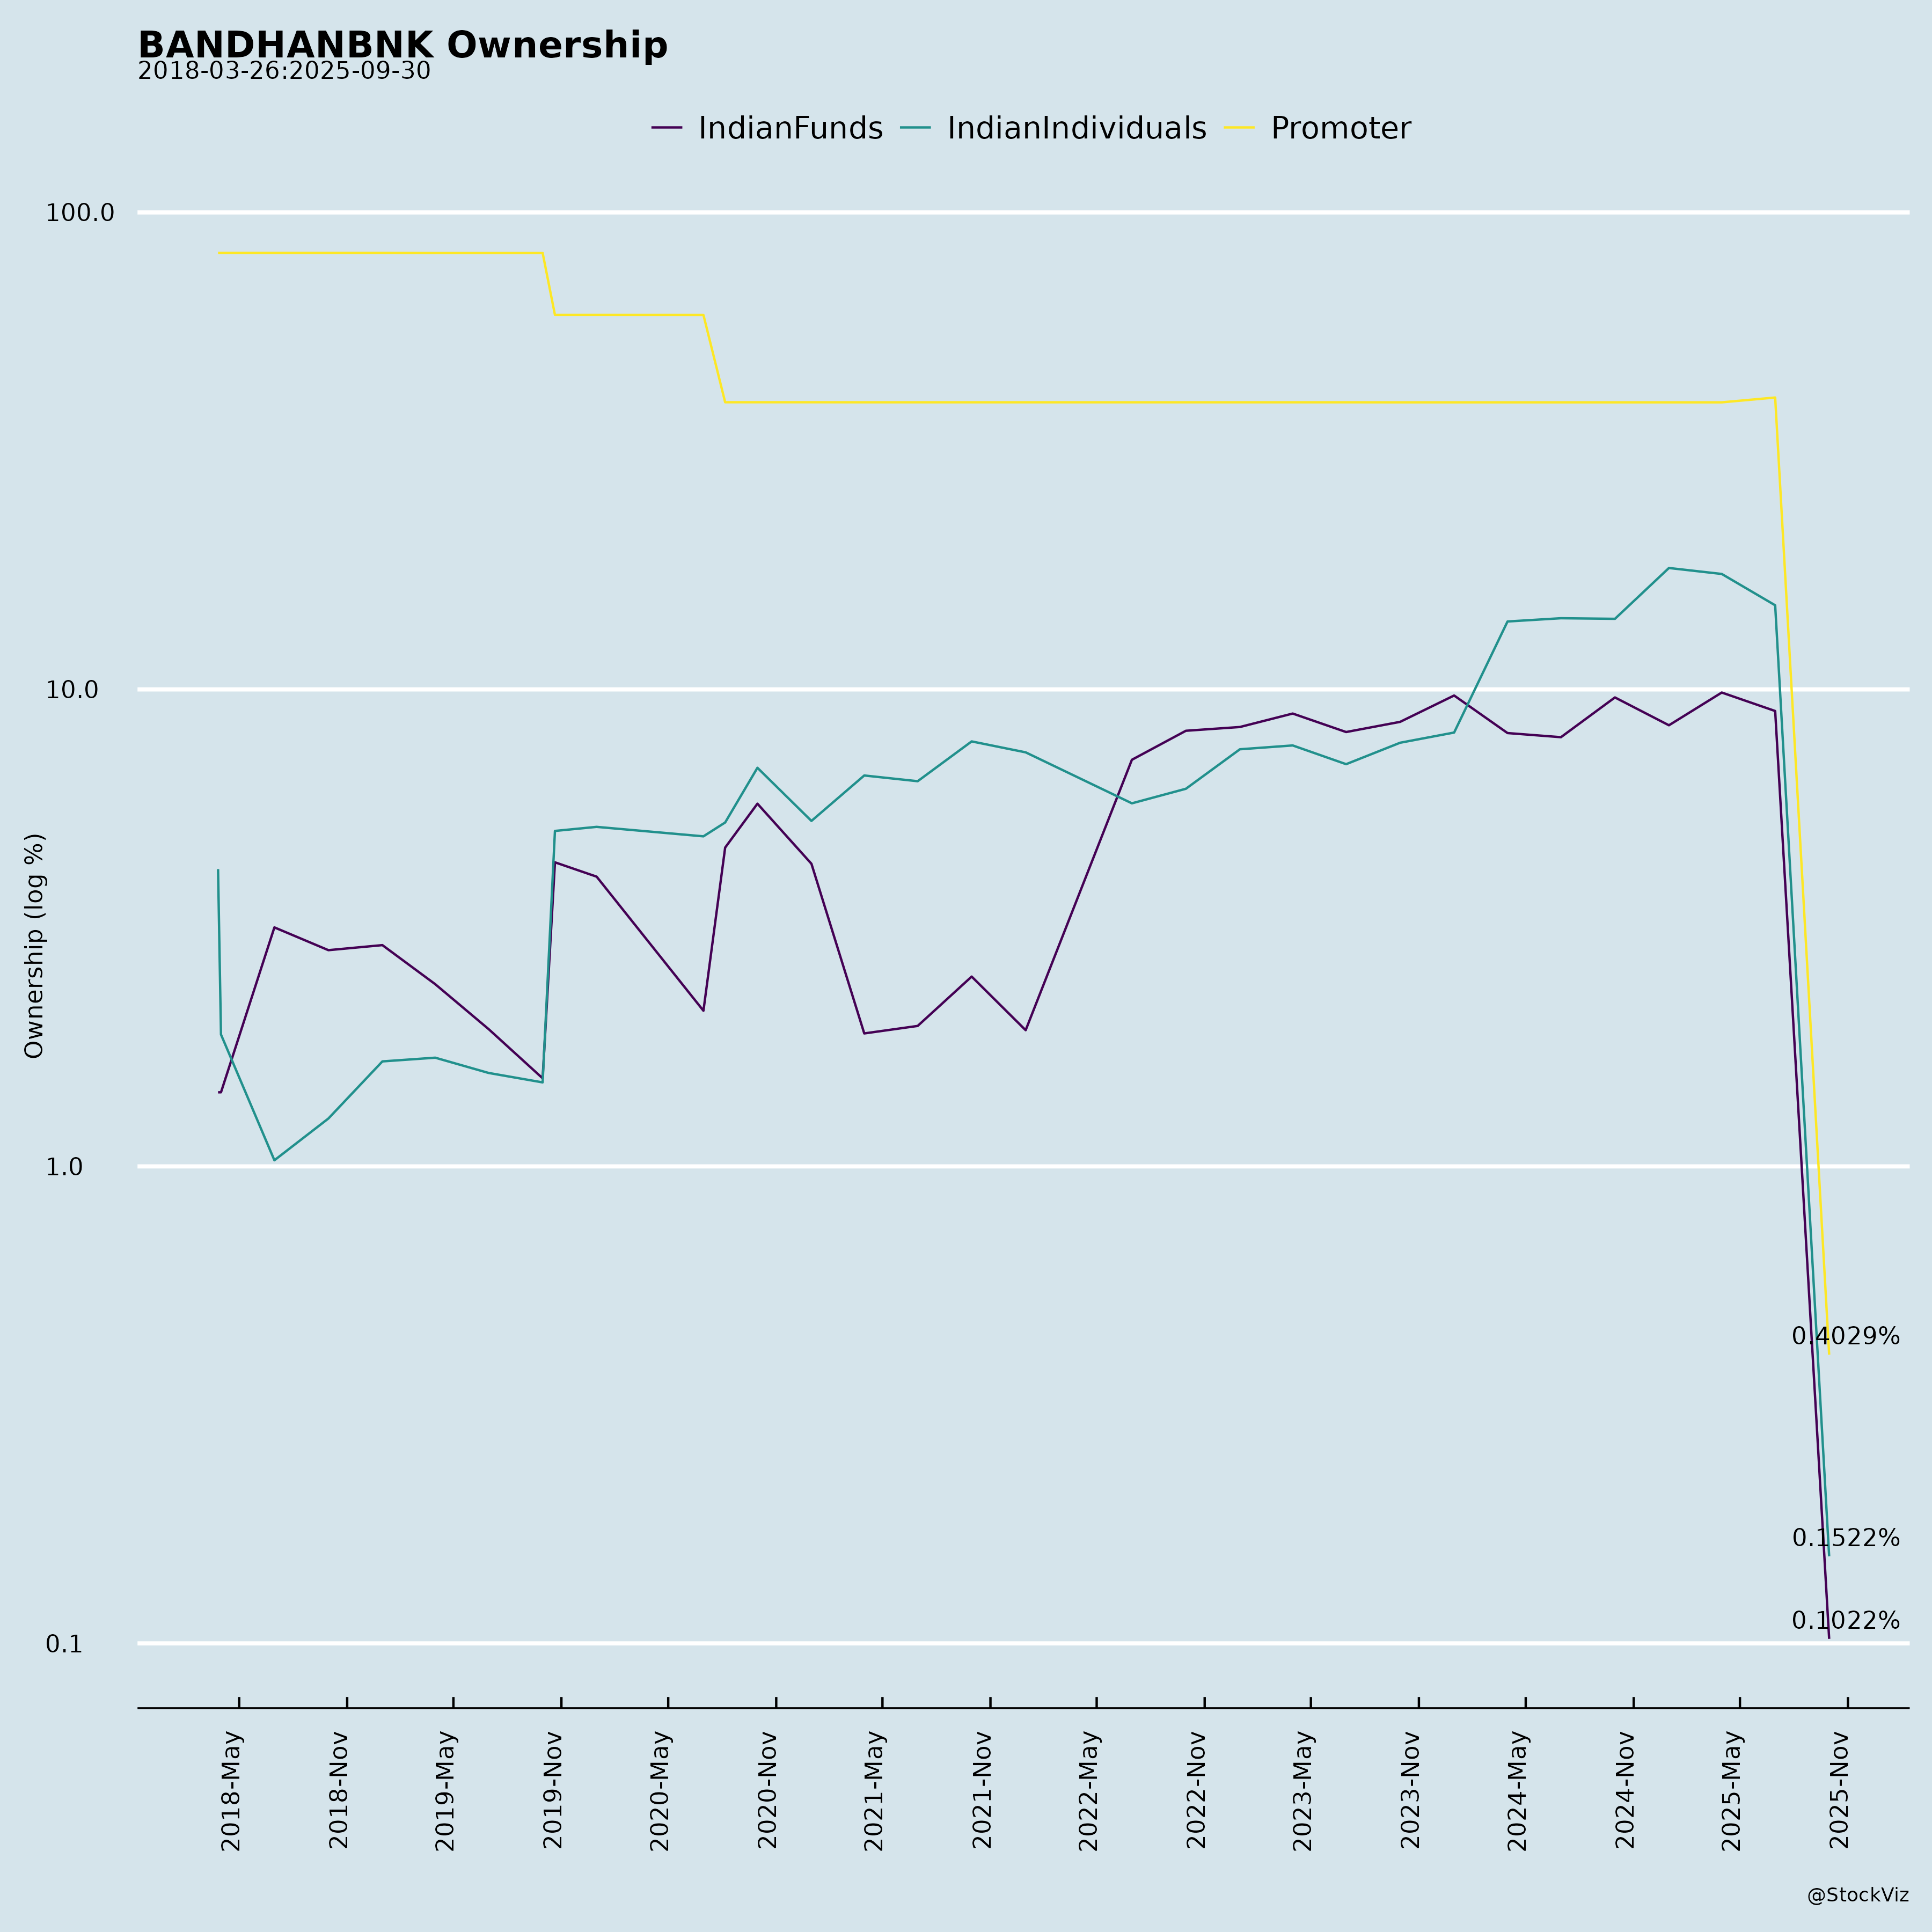
Ownership
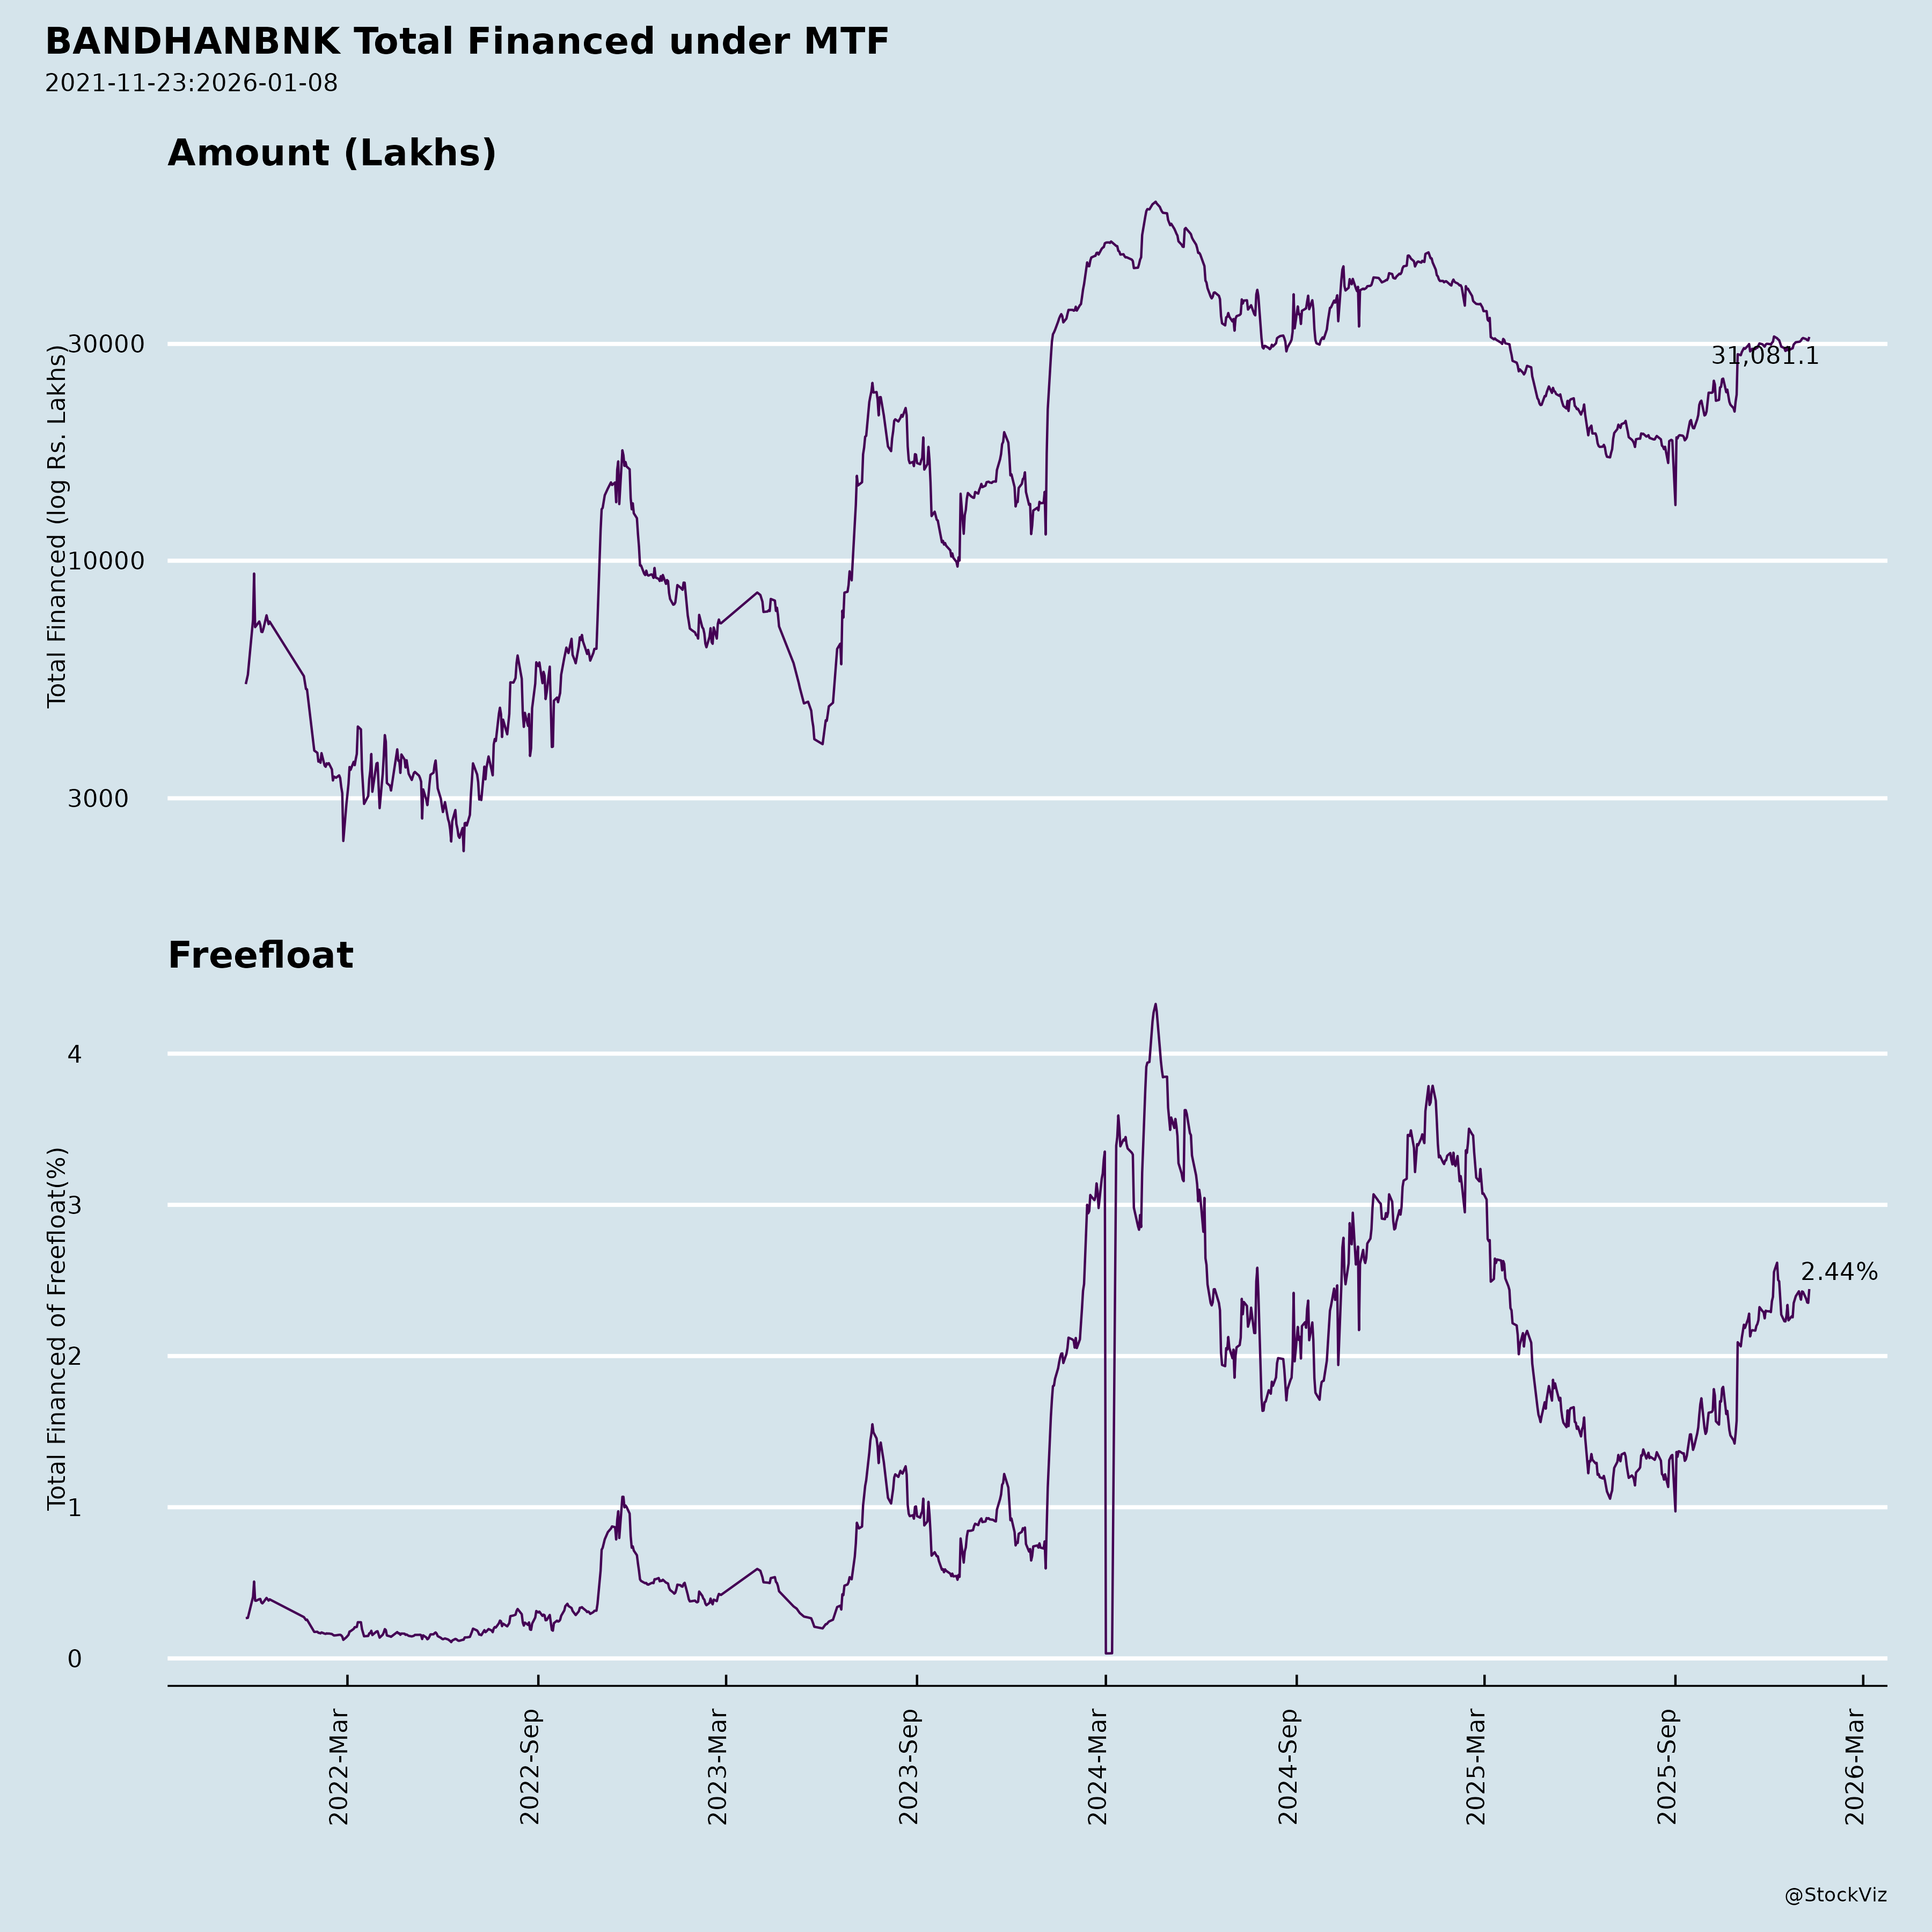
Margined
AI Summary
asof: 2025-12-03
Bandhan Bank (BANDHANBNK) Analysis: Headwinds, Tailwinds, Growth Prospects, and Key Risks
Bandhan Bank, a mid-sized private sector bank with roots in microfinance (EEB segment), is undergoing portfolio diversification amid asset quality challenges. Q2FY26 results (ended Sep 2025) show muted growth and profitability, but improving mix and balance sheet strength. Total assets ~₹1,950 bn, advances ₹1,400 bn (7% YoY), deposits ₹1,581 bn (11% YoY). Below is a structured summary based on disclosures (earnings presentation, GST order, NPA sale, etc.).
Tailwinds (Positive Catalysts)
- Portfolio Diversification & De-risking: EEB share down to 37% (from higher legacy levels); secured book at 55% (+790 bps YoY). Non-EEB advances up 24% YoY (₹883 bn), wholesale (29% share, + strong ratings: 95% FIG/H&E A-/above). Housing/retail growing steadily.
- Deposit Franchise Strength: 11% YoY growth; retail deposits 71% of mix (+16% YoY); CASA 28%; low-cost sticky base supports liquidity (CASH ratio 28%).
- Capital & Liquidity Buffer: CRAR 18.6% (CET1 17.8%), well above regulatory norms; enables growth/investments.
- Digital & Outreach Momentum: 98% retail txns digital; 92% savings accounts opened digitally; expanding WhatsApp banking, UPI, QR collections. 1,754 branches + 4,593 banking units across 35 states; non-East loan share 62%.
- Improving Collections: EEB efficiency ~98%; customer paying profile strong (95% full payers).
- Awards & Governance: Gallup Exceptional Workplace (2x winner); strong board additions (e.g., IT/banking experts).
Headwinds (Challenges)
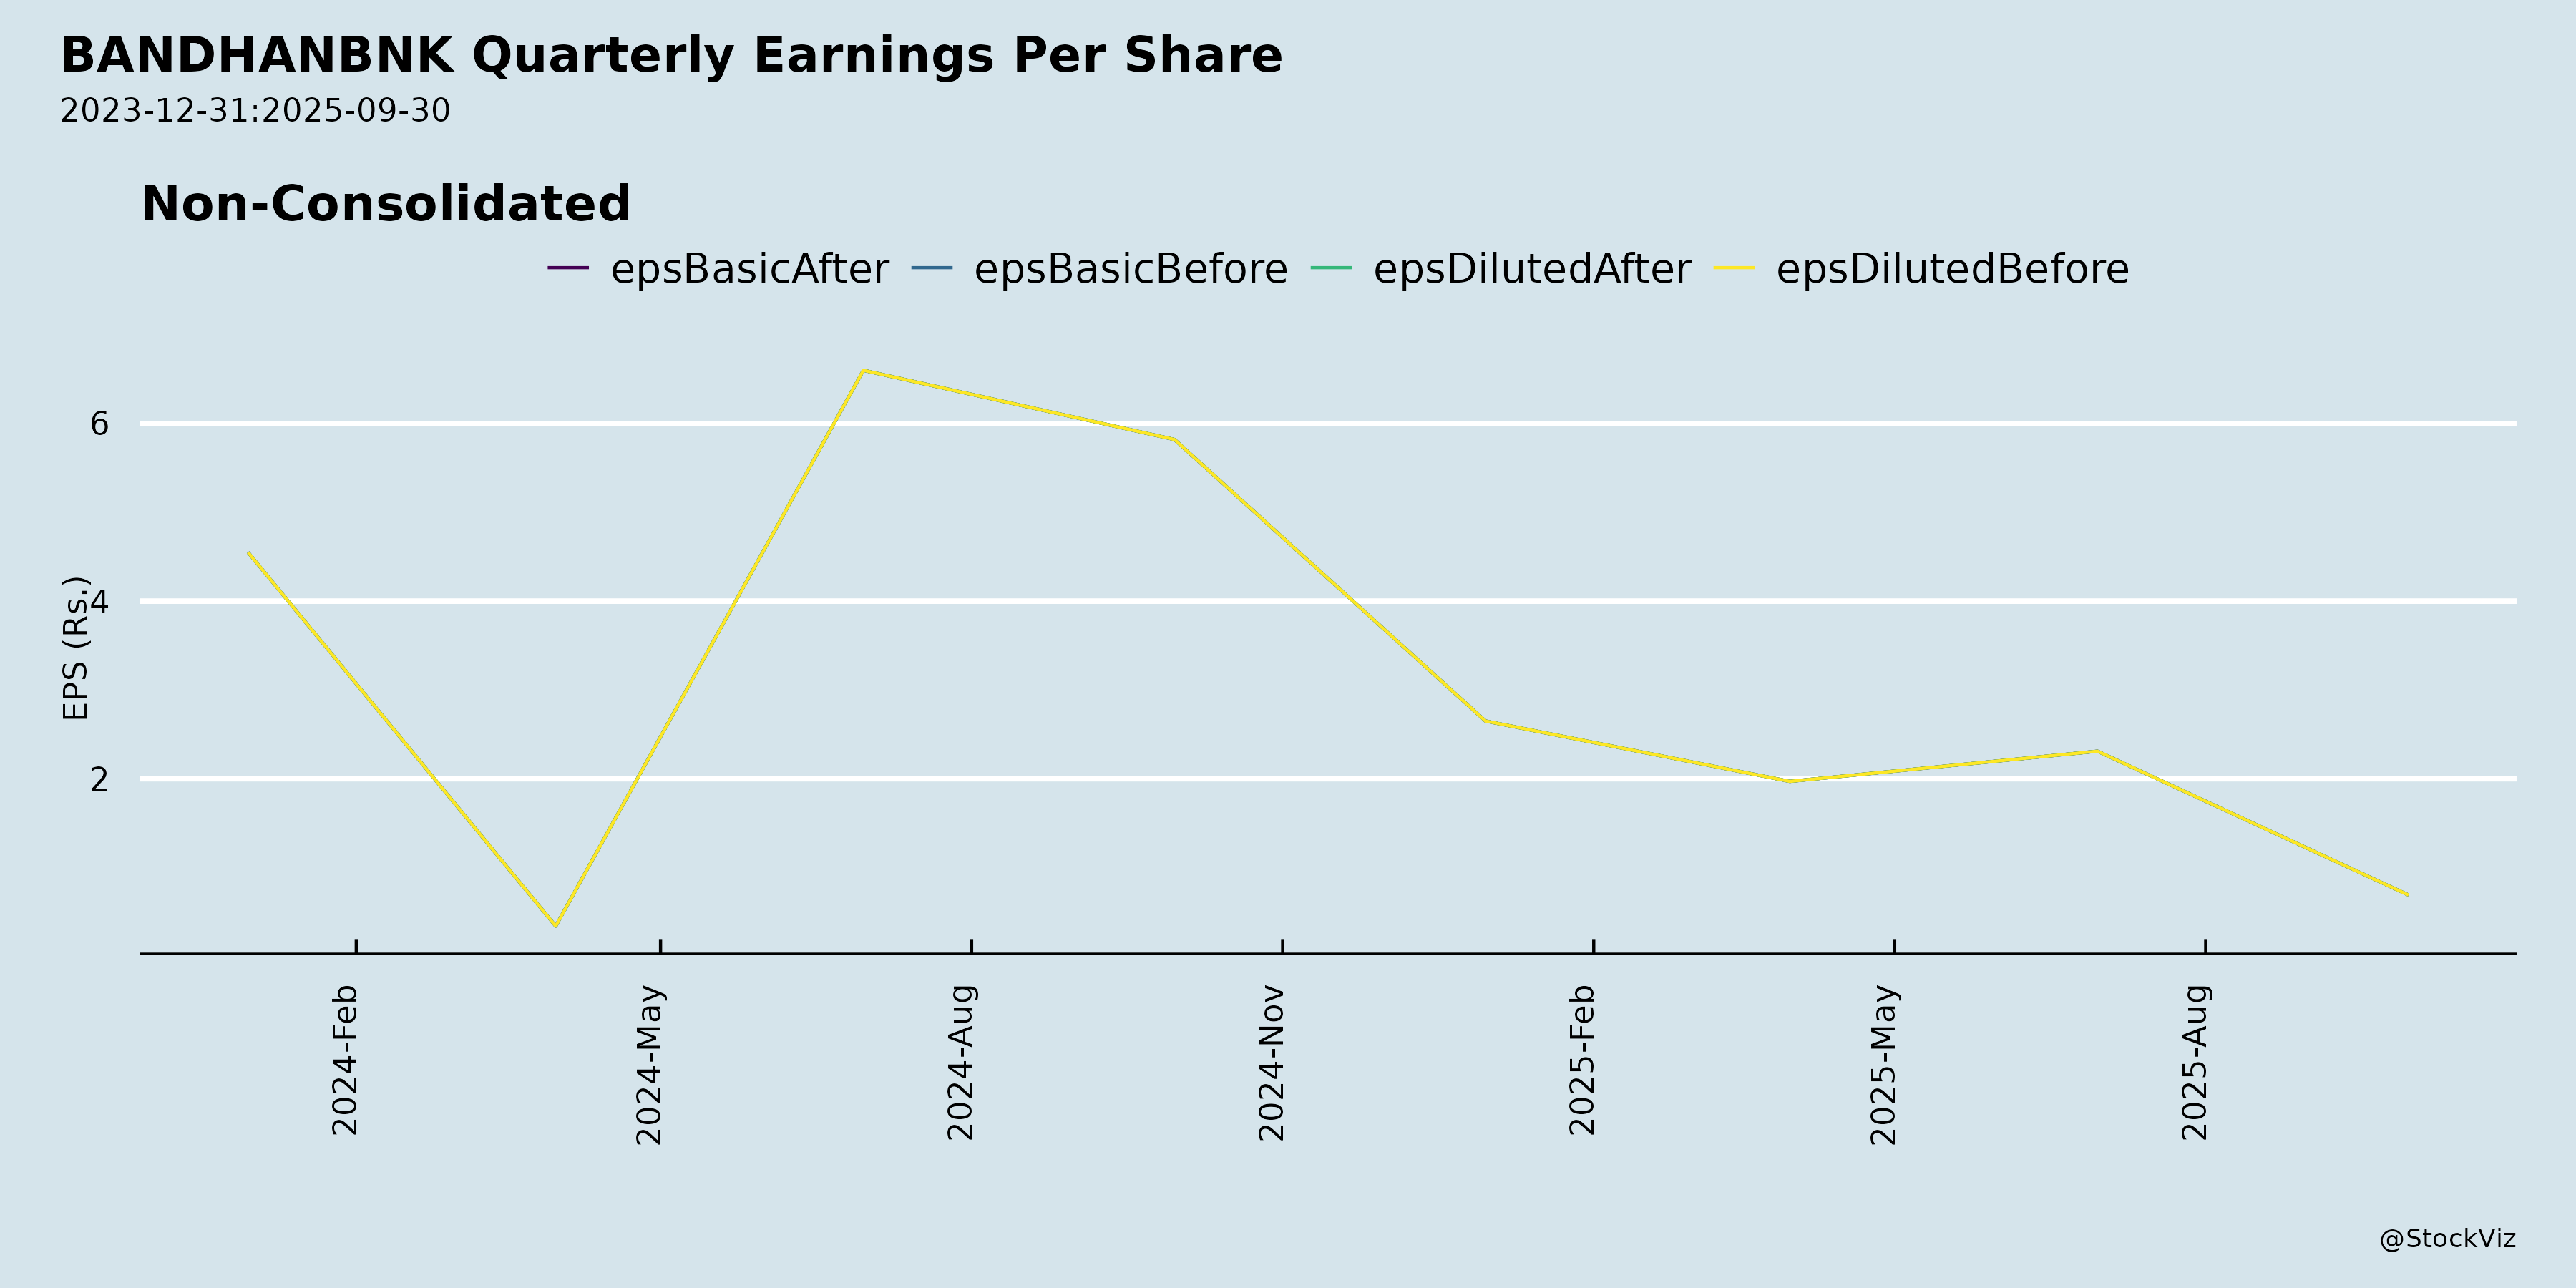
- Profitability Pressure: NII down 12% YoY (₹26 bn); NIM compressed 152 bps YoY to 5.8%; PAT ₹1.1 bn (-88% YoY); cost/income 58%; ROA/ROE at 0.2%/1.8% (multi-year lows).
- Slow Growth: Advances +7% YoY (vs. deposits +11%); overall book flat QoQ.
- High Operating Costs: OPEX/assets 3.8%; employee productivity up but cost/income elevated.
- Legacy EEB Drag: Still 37% of book; SMA/NPA stress (₹59 bn stress pool); collections dipped slightly QoQ.
- NIM/Spread Squeeze: Yield spread down; higher deposit costs.
Growth Prospects (Medium-Term Opportunities)
- Balanced Portfolio Expansion: Target sustained non-EEB growth (23-25% YoY); wholesale (29% share) scaling with high ratings; housing disbursements stable; retail (vehicles/gold/personal) ramp-up.
- Geographic/Geography Shift: Non-East loans 62% (+228 bps YoY); SU-RU focus for deposits/outreach.
- Digital/Agency Scale: 100%+ YoY growth in digital deposits/UPI; merchant acquiring (Jio tie-up), agency business (tax collections), fintech (e-NACH/escrow).
- NPA Cleanup: Planned sale of ₹3,212 Cr NPAs + ₹3,719 Cr write-offs to ARCs (Swiss challenge/auction); could unlock capital, reduce credit costs (currently 3.4%).
- Guidance Implicit: Productivity +18% YoY; training 668K hours; universal bank pivot from microfinance.
Projected Trajectory: Advances/deposits growth 12-15% FY26E (industry ~15%); NIM stabilization at 5.5-6%; RoA recovery to 1%+ by FY27 if asset quality improves. Valuations attractive (low TEVABV ~0.8x).
Key Risks
| Risk Category | Description | Mitigation |
|---|---|---|
| Asset Quality | GNPA 5.0% (up QoQ), NNPA 1.4%; EEB slippages ₹16 bn/Q; credit cost 3.4% (high). Vintage analysis shows older cohorts stressed. | NPA sales to ARCs; collections >97%; secured shift; PCR 74%. |
| Regulatory | GST demand ₹2.2 Cr (FY19-23; appeal planned, no material impact). RBI domain migration done; director approvals via postal ballot. | Strong compliance; no major violations noted. |
| Profitability/NIM | NIM down 55 bps QoQ; high provisions (₹11.5 bn/Q). | Deposit accretion; yield optimization. |
| Execution | EEB cleanup dependency; competition in wholesale/retail from larger peers. | Experienced mgmt (40+ yr avg); diversification. |
| Macro | Slow economy/microfinance stress; rate cuts may help NIM but hurt yields. | Diversified book (62% non-East). |
| Concentration | EEB still ~37%; promoter nominee dynamics. | Ongoing de-risking. |
Overall Outlook: Neutral to Positive. Headwinds from legacy NPAs/profitability dominate short-term, but tailwinds from diversification/digital/deposit strength position for recovery. NPA sale outcome critical. Monitor Q3FY26 for traction. At current levels, stock offers value for patient investors (DY ~1.5%; PB ~0.7x FY26E).
Data as of Q2FY26 (Sep 2025); sources: Earnings deck, disclosures.
Copyright © 2023 SAS Data Analytics Pvt. Ltd. All rights reserved.