BAJAJHFL
Equity Metrics
September 24, 2026
Bajaj Housing Finance Limited
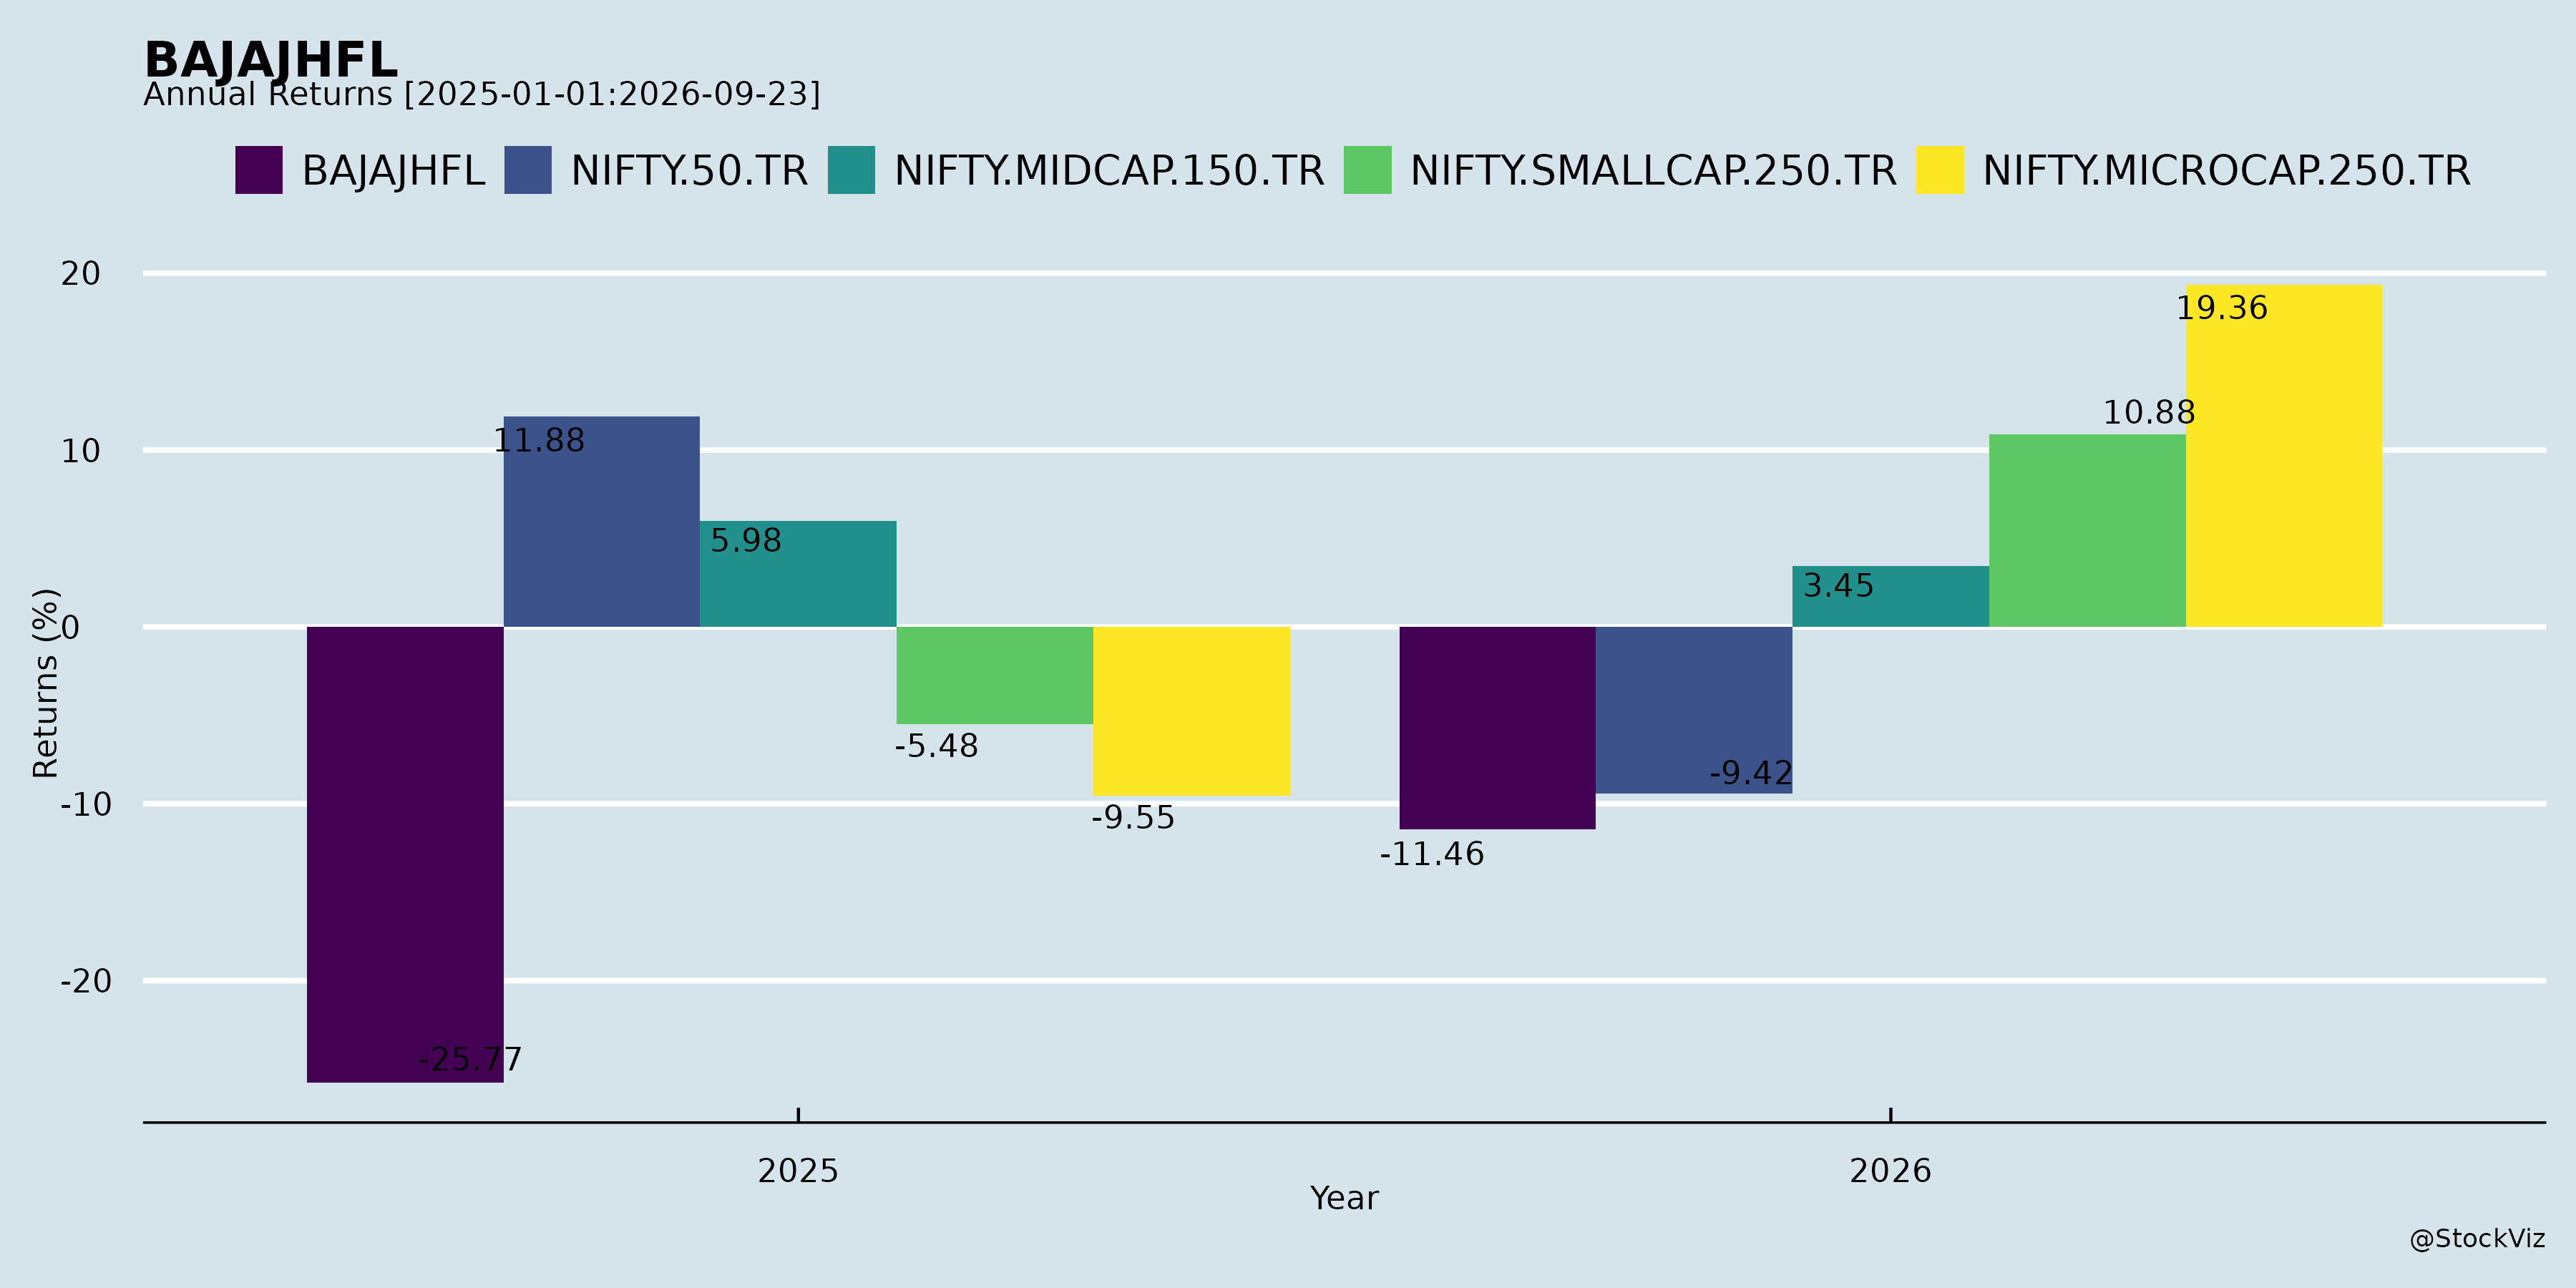
Annual Returns

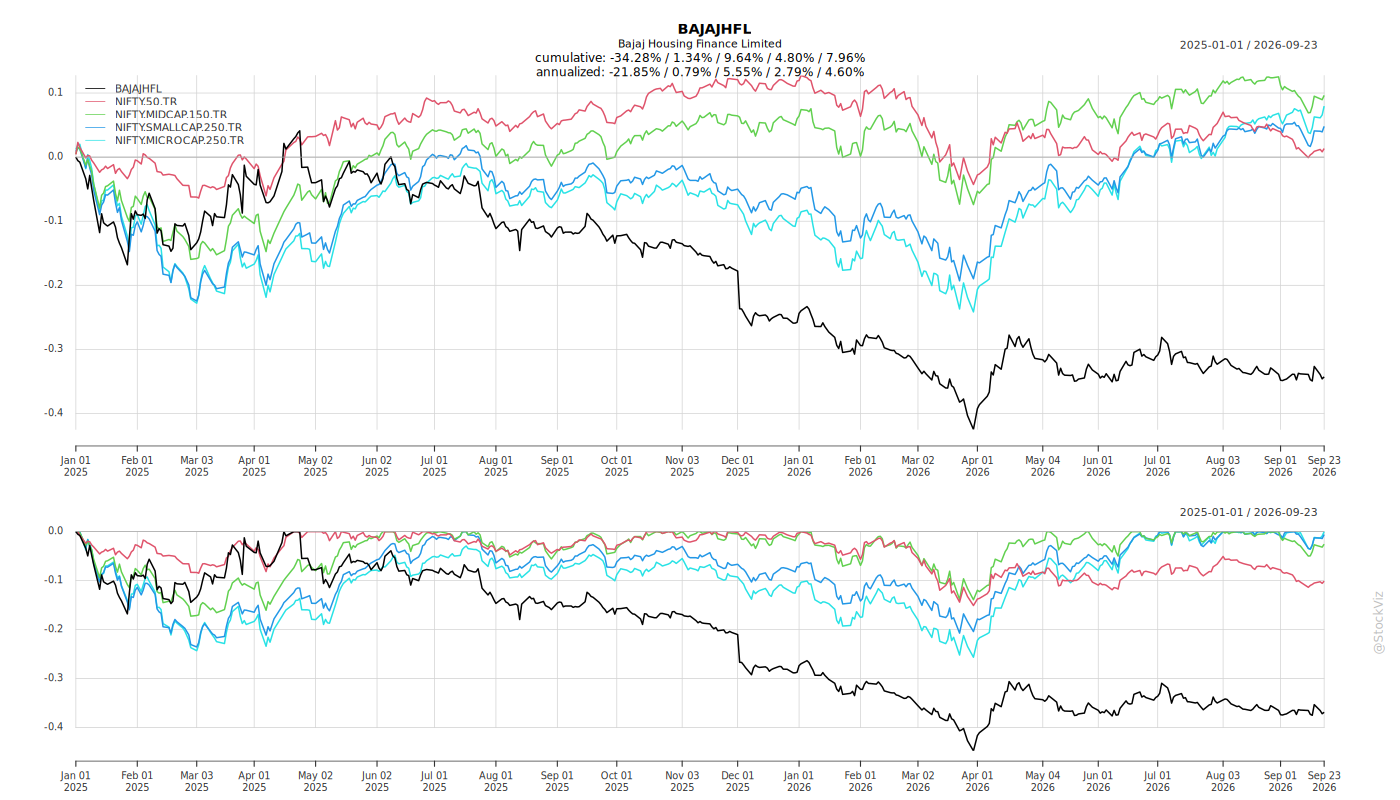
Cumulative Returns and Drawdowns
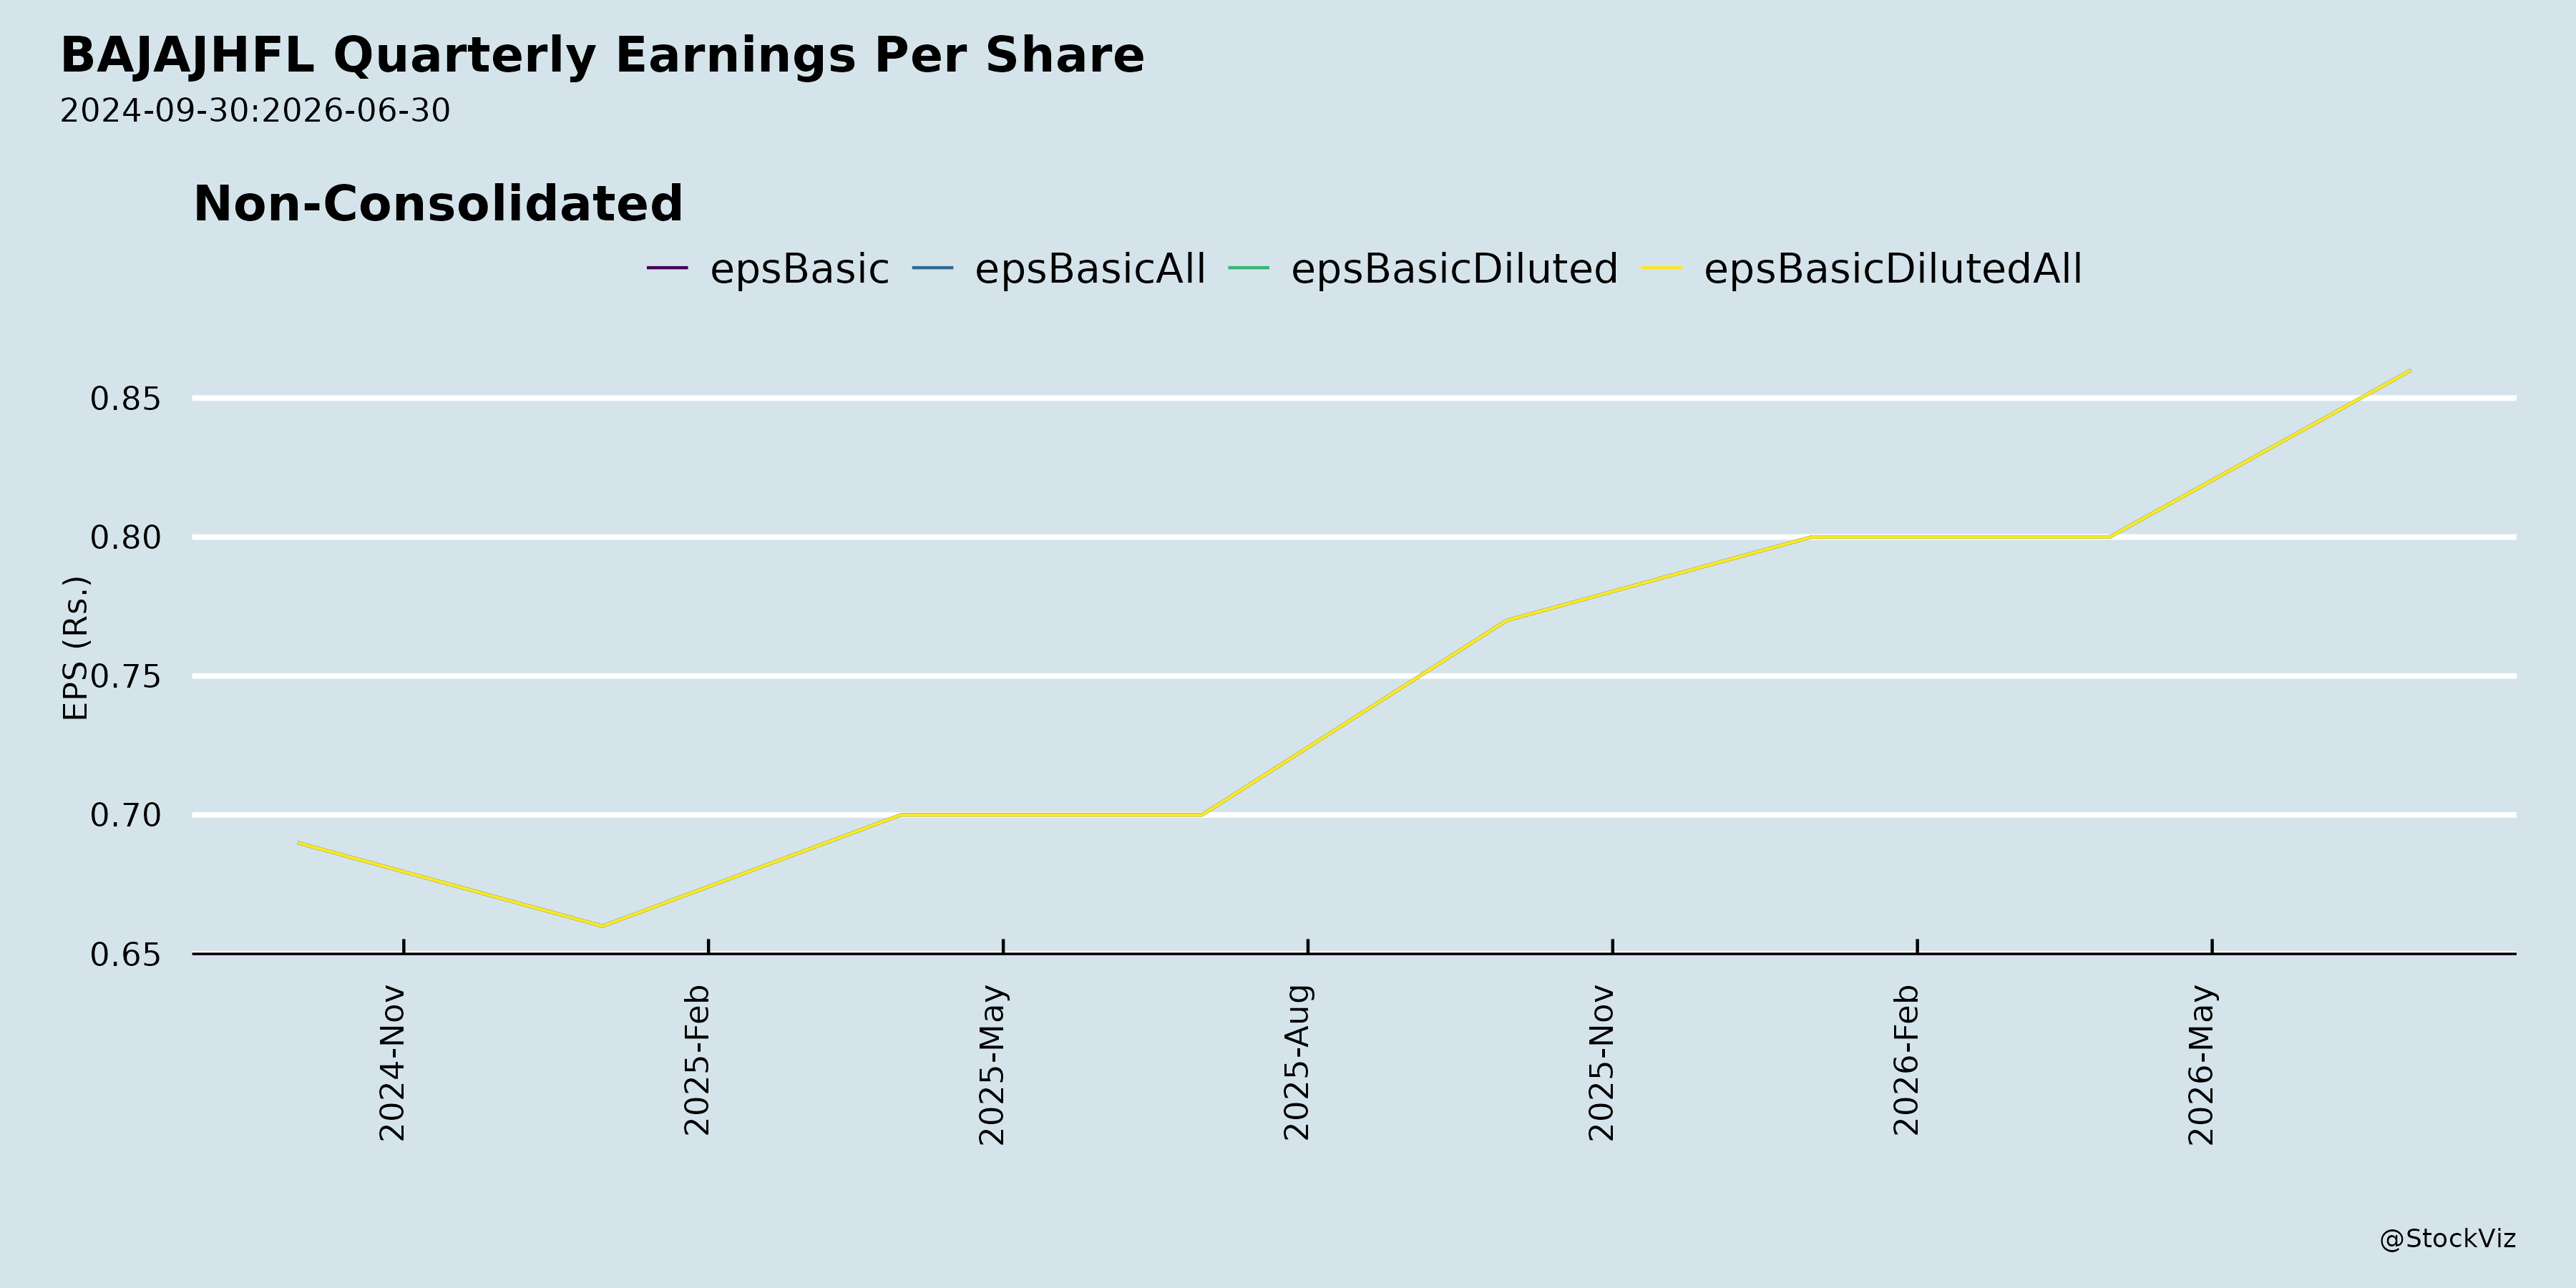
Fundamentals
Ownership
Margined
AI Summary
asof: 2026-09-16
BAJAJHFL: Recent Corporate Developments
1. Headwinds and Challenges
- Rising leverage: The debt-equity ratio increased to 4.75 as of 30 June 2026 from 4.31 as of 30 June 2025, and total debts to total assets rose to 0.82 from 0.81 over the same period.
- Higher interest expense growth than interest income growth: Interest expenses grew 18% year-on-year in Q1 FY27 (₹1,888 crore vs ₹1,606 crore), outpacing interest income growth of 15% (₹2,856 crore vs ₹2,493 crore). Net interest income growth was consequently lower at 9%.
- Decline in net gain on fair value changes: This fell 39% year-on-year in Q1 FY27 to ₹23 crore from ₹38 crore.
- Lower capital adequacy and liquidity coverage ratios: The capital to risk-weighted assets ratio declined to 21.59% as of 30 June 2026 from 26.94% as of 30 June 2025. The Liquidity Coverage Ratio declined to 158.12% from 210.57% over the same period, though both remain above regulatory requirements (15% and 100% respectively).
- Modest “Others” AUM contraction: The “Others” product category declined 1% year-on-year to ₹1,708 crore in Q1 FY27.
- Elevated abstentions and dissent on certain resolutions at the 18th AGM (29 July 2026): On the special resolution for issue of non-convertible debentures through private placement, 0.0355% of total e-votes were against. On the ordinary resolution for approval of material related party transactions with Bajaj Finance Limited, 0.2169% of total e-votes were against, and the promoter/promoter group were interested in this resolution and did not vote. On the resolution to re-appoint Rajeev Jain as director, 0.081% of total e-votes were against.
2. Tailwinds and Growth Prospects
- Strong disbursements growth: Disbursements grew 33% year-on-year in Q1 FY27 to ₹19,509 crore from ₹14,651 crore in Q1 FY26.
- Robust AUM growth: Assets under Management grew 24% year-on-year to ₹1,49,624 crore as of 30 June 2026 from ₹1,20,420 crore as of 30 June 2025. Loan Assets also grew 24% to ₹1,31,162 crore.
- Product-wise AUM growth (Q1 FY27 vs Q1 FY26):
- Home Loans: ₹80,865 crore, up 20%
- Loan against property: ₹15,445 crore, up 22%
- Lease rental discounting: ₹34,604 crore, up 41%
- Developer Finance: ₹17,002 crore, up 19%
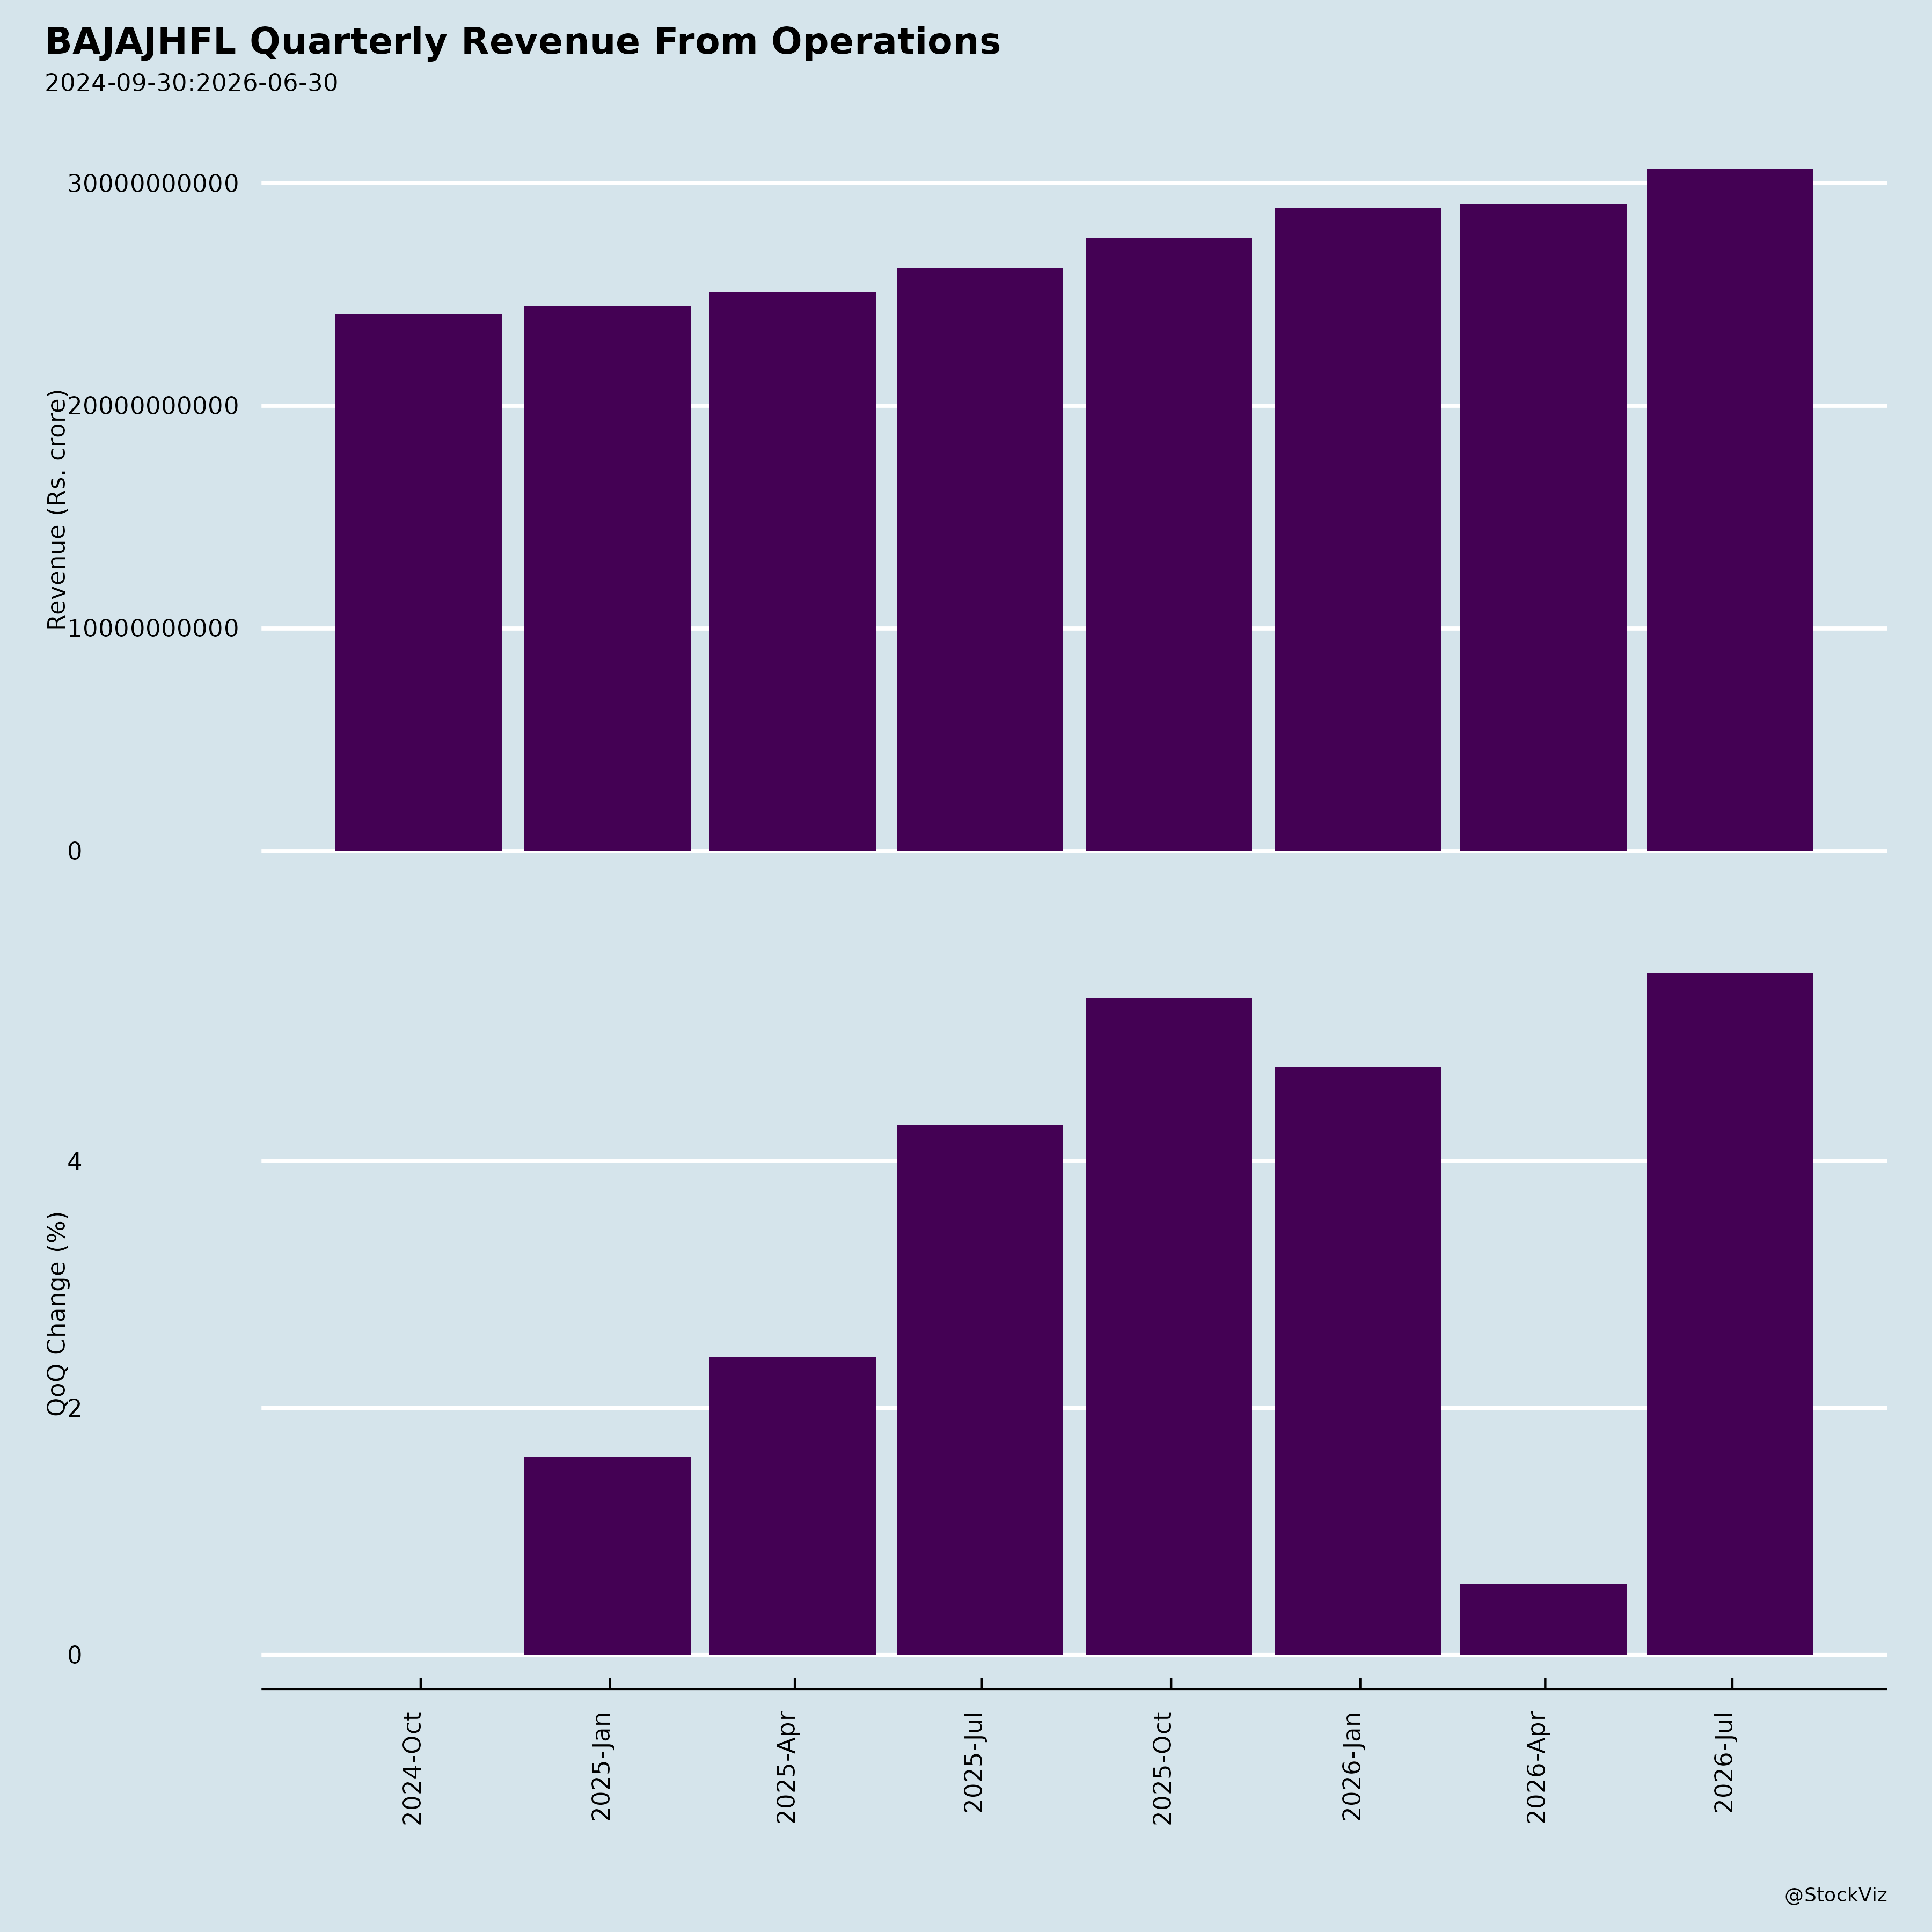
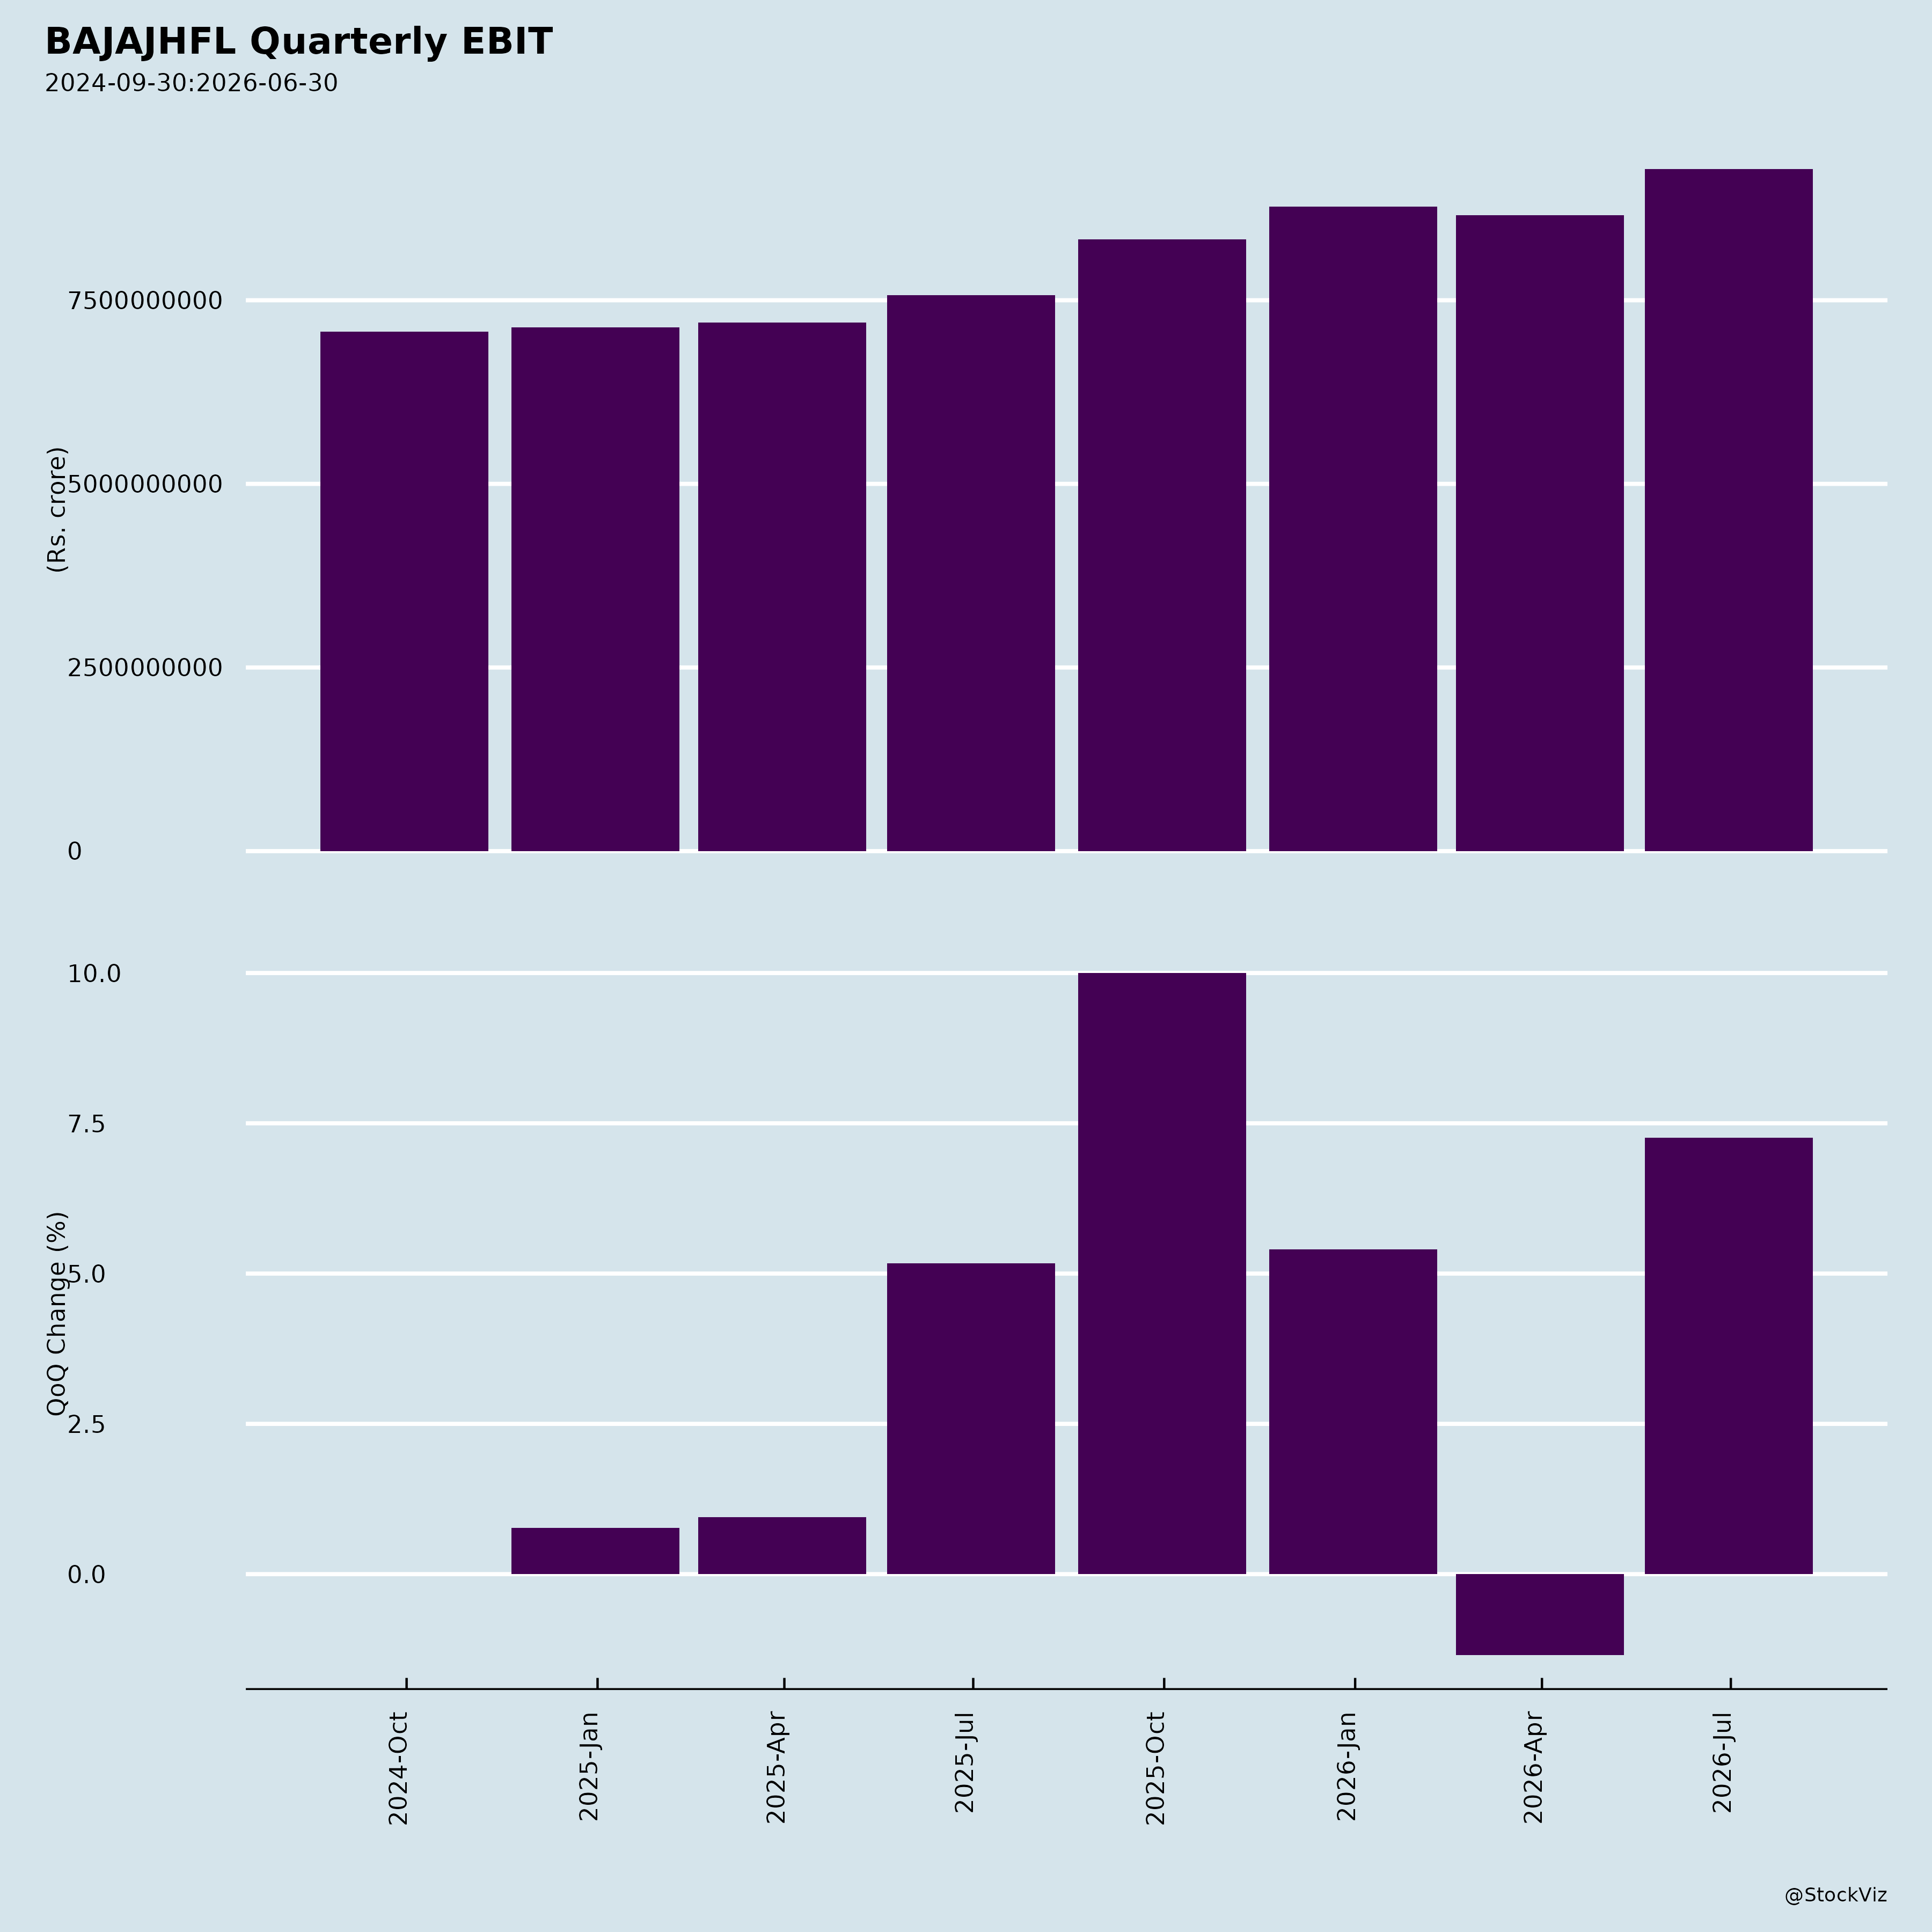
- Profitability growth: Profit before tax increased 23% year-on-year to ₹929 crore in Q1 FY27 from ₹757 crore. Profit after tax also increased 23% to ₹715 crore from ₹583 crore.
- Net total income growth: Increased 16% year-on-year to ₹1,175 crore in Q1 FY27 from ₹1,009 crore.
- Fee income growth: Fees and commission income grew 81% year-on-year to ₹105 crore in Q1 FY27 from ₹58 crore.
- Sale of services and income on de-recognised loans: Grew 278% year-on-year to ₹68 crore in Q1 FY27 from ₹18 crore.
- Improved operating efficiency: Operating Expenses to Net Total Income was 19.6% in Q1 FY27 versus 21.2% in Q1 FY26.
- Lower credit costs: Loan losses and provisions fell 58% year-on-year to ₹16 crore in Q1 FY27 from ₹38 crore in Q1 FY26.
- Improved asset quality: Gross NPA declined to 0.29% as of 30 June 2026 from 0.30% as of 30 June 2025. Net NPA declined to 0.12% from 0.13%. Provision coverage on stage 3 assets improved to 58.53% from 56.25%.
- Improved return on equity: ROE (annualised) improved to 12.5% in Q1 FY27 from 11.6% in Q1 FY26. ROA (annualised) was stable at 2.3%.
- Net worth growth: Net worth grew 13% year-on-year to ₹23,234 crore as of 30 June 2026 from ₹20,508 crore.
- Strong credit ratings: The Company holds AAA/Stable for its long-term debt programme from CRISIL and India Ratings, and A1+ for its short-term debt programme from CRISIL and India Ratings.
- Loan assignment and acquisition activity: During Q1 FY27, the Company assigned loans through direct assignment (9 accounts with 1% MRR amounting to ₹1,898.70 crore; 1,640 accounts with 10% MRR amounting to ₹729.54 crore) and acquired loans (8,246 accounts amounting to ₹1,466.74 crore with 90% beneficial economic interest).
- Investor engagement: The Company scheduled analyst/institutional investor meetings in Singapore (24–25 August 2026) and Hong Kong (26 August 2026).
3. Key Risks
- Regulatory and compliance risk: The Company is regulated by the RBI, SEBI, and IRDAI, and supervised by the NHB. It is classified as an Upper Layer NBFC under the RBI’s Scale Based Regulations. Changes in regulations, including the RBI (Non-Banking Financial Companies – Transfer and Distribution of Credit Risk) Directions and the RBI (Non-Banking Financial Companies – Financial Statements: Presentation and Disclosures) Directions dated 28 November 2025, could affect operations.
- Credit risk: Gross NPA was 0.29% and Net NPA was 0.12% as of 30 June 2026. Provision coverage on stage 3 assets was 58.53%.
- Liquidity risk: The Liquidity Coverage Ratio was 158.12% as of 30 June 2026, down from 210.57% as of 30 June 2025, though above the 100% regulatory requirement.
- Capital adequacy risk: The capital to risk-weighted assets ratio was 21.59% as of 30 June 2026, down from 26.94% as of 30 June 2025, though above the 15% regulatory requirement.
- Concentration risk: The Company’s operations are primarily in the business of financing, with no separate reportable segments as per Ind AS 108.
- Related party risk: Material related party transactions with Bajaj Finance Limited (the parent company) require shareholder approval, which was obtained at the 18th AGM on 29 July 2026.
- Interest rate risk: Interest expenses grew 18% year-on-year in Q1 FY27, outpacing interest income growth of 15%, compressing net interest income growth to 9%.
- Security cover risk: The Company must maintain security cover for its listed non-convertible debentures as per the terms of the Offer Documents/Information Memorandum and Debenture Trust Deed. The auditors’ certificate dated 29 July 2026 confirmed that as at 30 June 2026, the Company maintained the required security cover.
4. Management Guidance Versus Observed Business Performance
- Disbursements: Q1 FY27 disbursements were ₹19,509 crore, up 33% year-on-year. FY26 disbursements were ₹64,616 crore.
- AUM: Q1 FY27 AUM was ₹1,49,624 crore, up 24% year-on-year. FY26 AUM was ₹1,40,706 crore.
- Loan Assets: Q1 FY27 Loan Assets were ₹1,31,162 crore, up 24% year-on-year. FY26 Loan Assets were ₹1,23,745 crore.
- Net Worth: Q1 FY27 Net Worth was ₹23,234 crore, up 13% year-on-year. FY26 Net Worth was ₹22,527 crore.
- ROA (Annualised): Q1 FY27 ROA was 2.3%, same as Q1 FY26 and FY26.
- ROE (Annualised): Q1 FY27 ROE was 12.5%, up from 11.6% in Q1 FY26 and 12.1% in FY26.
- GNPA: Q1 FY27 GNPA was 0.29%, down from 0.30% in Q1 FY26 but up from 0.27% in FY26.
- Net interest income: Q1 FY27 NII was ₹968 crore, up 9% year-on-year. FY26 NII was ₹3,752 crore.
- Net total income: Q1 FY27 NTI was ₹1,175 crore, up 16% year-on-year. FY26 NTI was ₹4,391 crore.
- Operating Expenses to Net Total Income: Q1 FY27 was 19.6% versus 21.2% in Q1 FY26.
- Loan losses and provisions: Q1 FY27 was ₹16 crore versus ₹38 crore in Q1 FY26. FY26 was ₹191 crore.
- Profit before tax: Q1 FY27 was ₹929 crore, up 23% year-on-year. FY26 was ₹3,320 crore.
- Profit after tax: Q1 FY27 was ₹715 crore, up 23% year-on-year. FY26 was ₹2,560 crore.
- Capital adequacy ratio: Q1 FY27 was 21.59%. FY26 was not disclosed in the press release but the Q1 FY26 figure was 26.94%.
- Credit rating: The Company enjoys the highest credit rating of AAA/Stable for its long-term debt programme from CRISIL and India Ratings and A1+ for its short-term debt programme from CRISIL and India Ratings.
- Dividend: No dividend was announced in the supplied material.
- Guidance: No explicit forward-looking management guidance was provided in the supplied material. The Company scheduled analyst/institutional investor meetings in Singapore and Hong Kong from 24 to 26 August 2026, with discussions pertaining to publicly available information only.
Broker Narrative
The narrative shifted from unconditional optimism in the first report (no headwinds, highlighting new business lines and strong capitalization) to a qualified Buy acknowledging NIM compression from competition, muted demand, and asset-quality deterioration in LAP and developer finance, while still citing AUM growth above guidance, strong segment performance, and management efficiency targets as positives. Despite predominantly bullish calls, actual returns were negative across all reports with multiple DISAPPOINTMENT outcomes.
Fears that came true
- Intense competition in the prime housing segment pressured NIMs exactly as flagged, with Q1 NIM down 14 bps QoQ and FY27 NIM guided to moderate 20-25 bps, correlating with DISAPPOINTMENT outcomes on Buy calls.
- Asset yield contraction of ~60 bps YoY due to competitive pressure and the falling rate cycle materialized as a key risk, consistent with uniformly negative actual returns across the call history.
- Muted demand and slow system growth flagged as a headwind came true, with FY26 system growth remaining slow, aligning with the -34.8% DISAPPOINTMENT outcome on the first Buy call.
- Asset-quality pockets weakened as flagged: LAP GNPA rose 16 bps QoQ to 62 bps and developer finance GNPA jumped to 12 bps from 3 bps due to one account slippage.
Optimism that failed
- New business lines (urban B2C, rural B2C, mortgage) and extensive product and geographic expansion were expected to drive growth but failed to prevent a -34.8% actual return (DISAPPOINTMENT) on the first Buy call.
- Strong capitalization (tier-1 ratio 20.9%) and BHFL IPO proceeds were touted as tailwinds supporting a bullish thesis but could not sustain positive returns, as every Buy call with a positive predicted return produced a negative actual return.
Broker Timeline
12 broker calls · 2024-10-25 to 2026-07-30
Copyright © 2023 SAS Data Analytics Pvt. Ltd. All rights reserved.