APOLLOTYRE
Equity Metrics
January 13, 2026
Apollo Tyres Limited
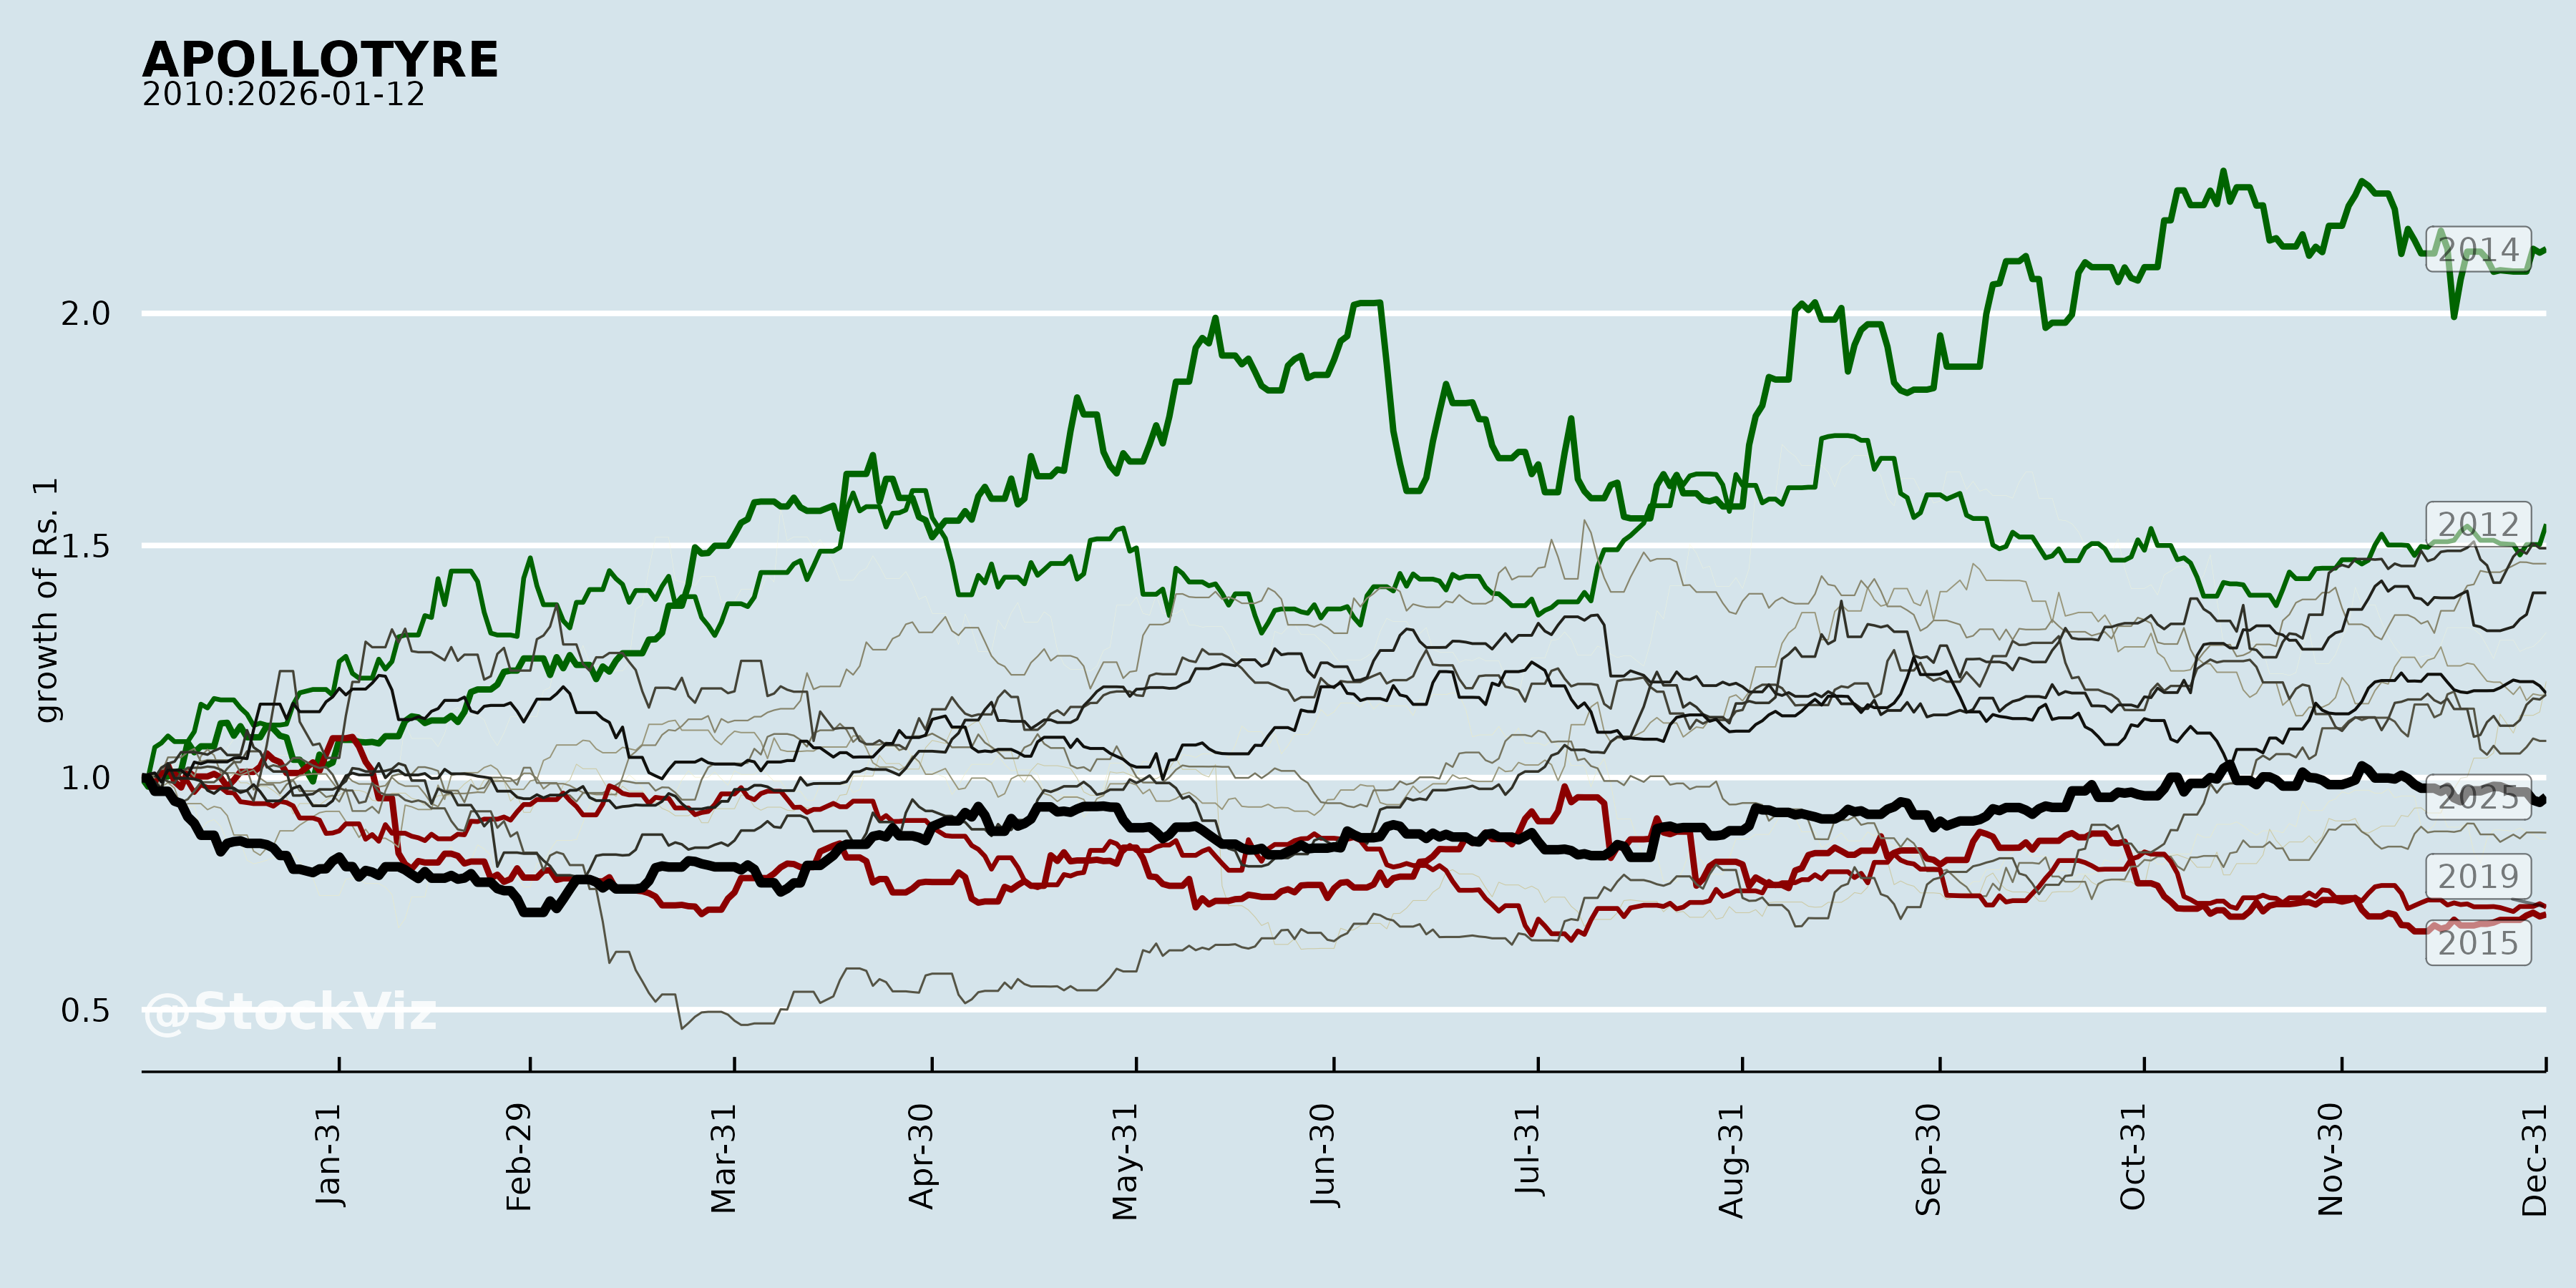
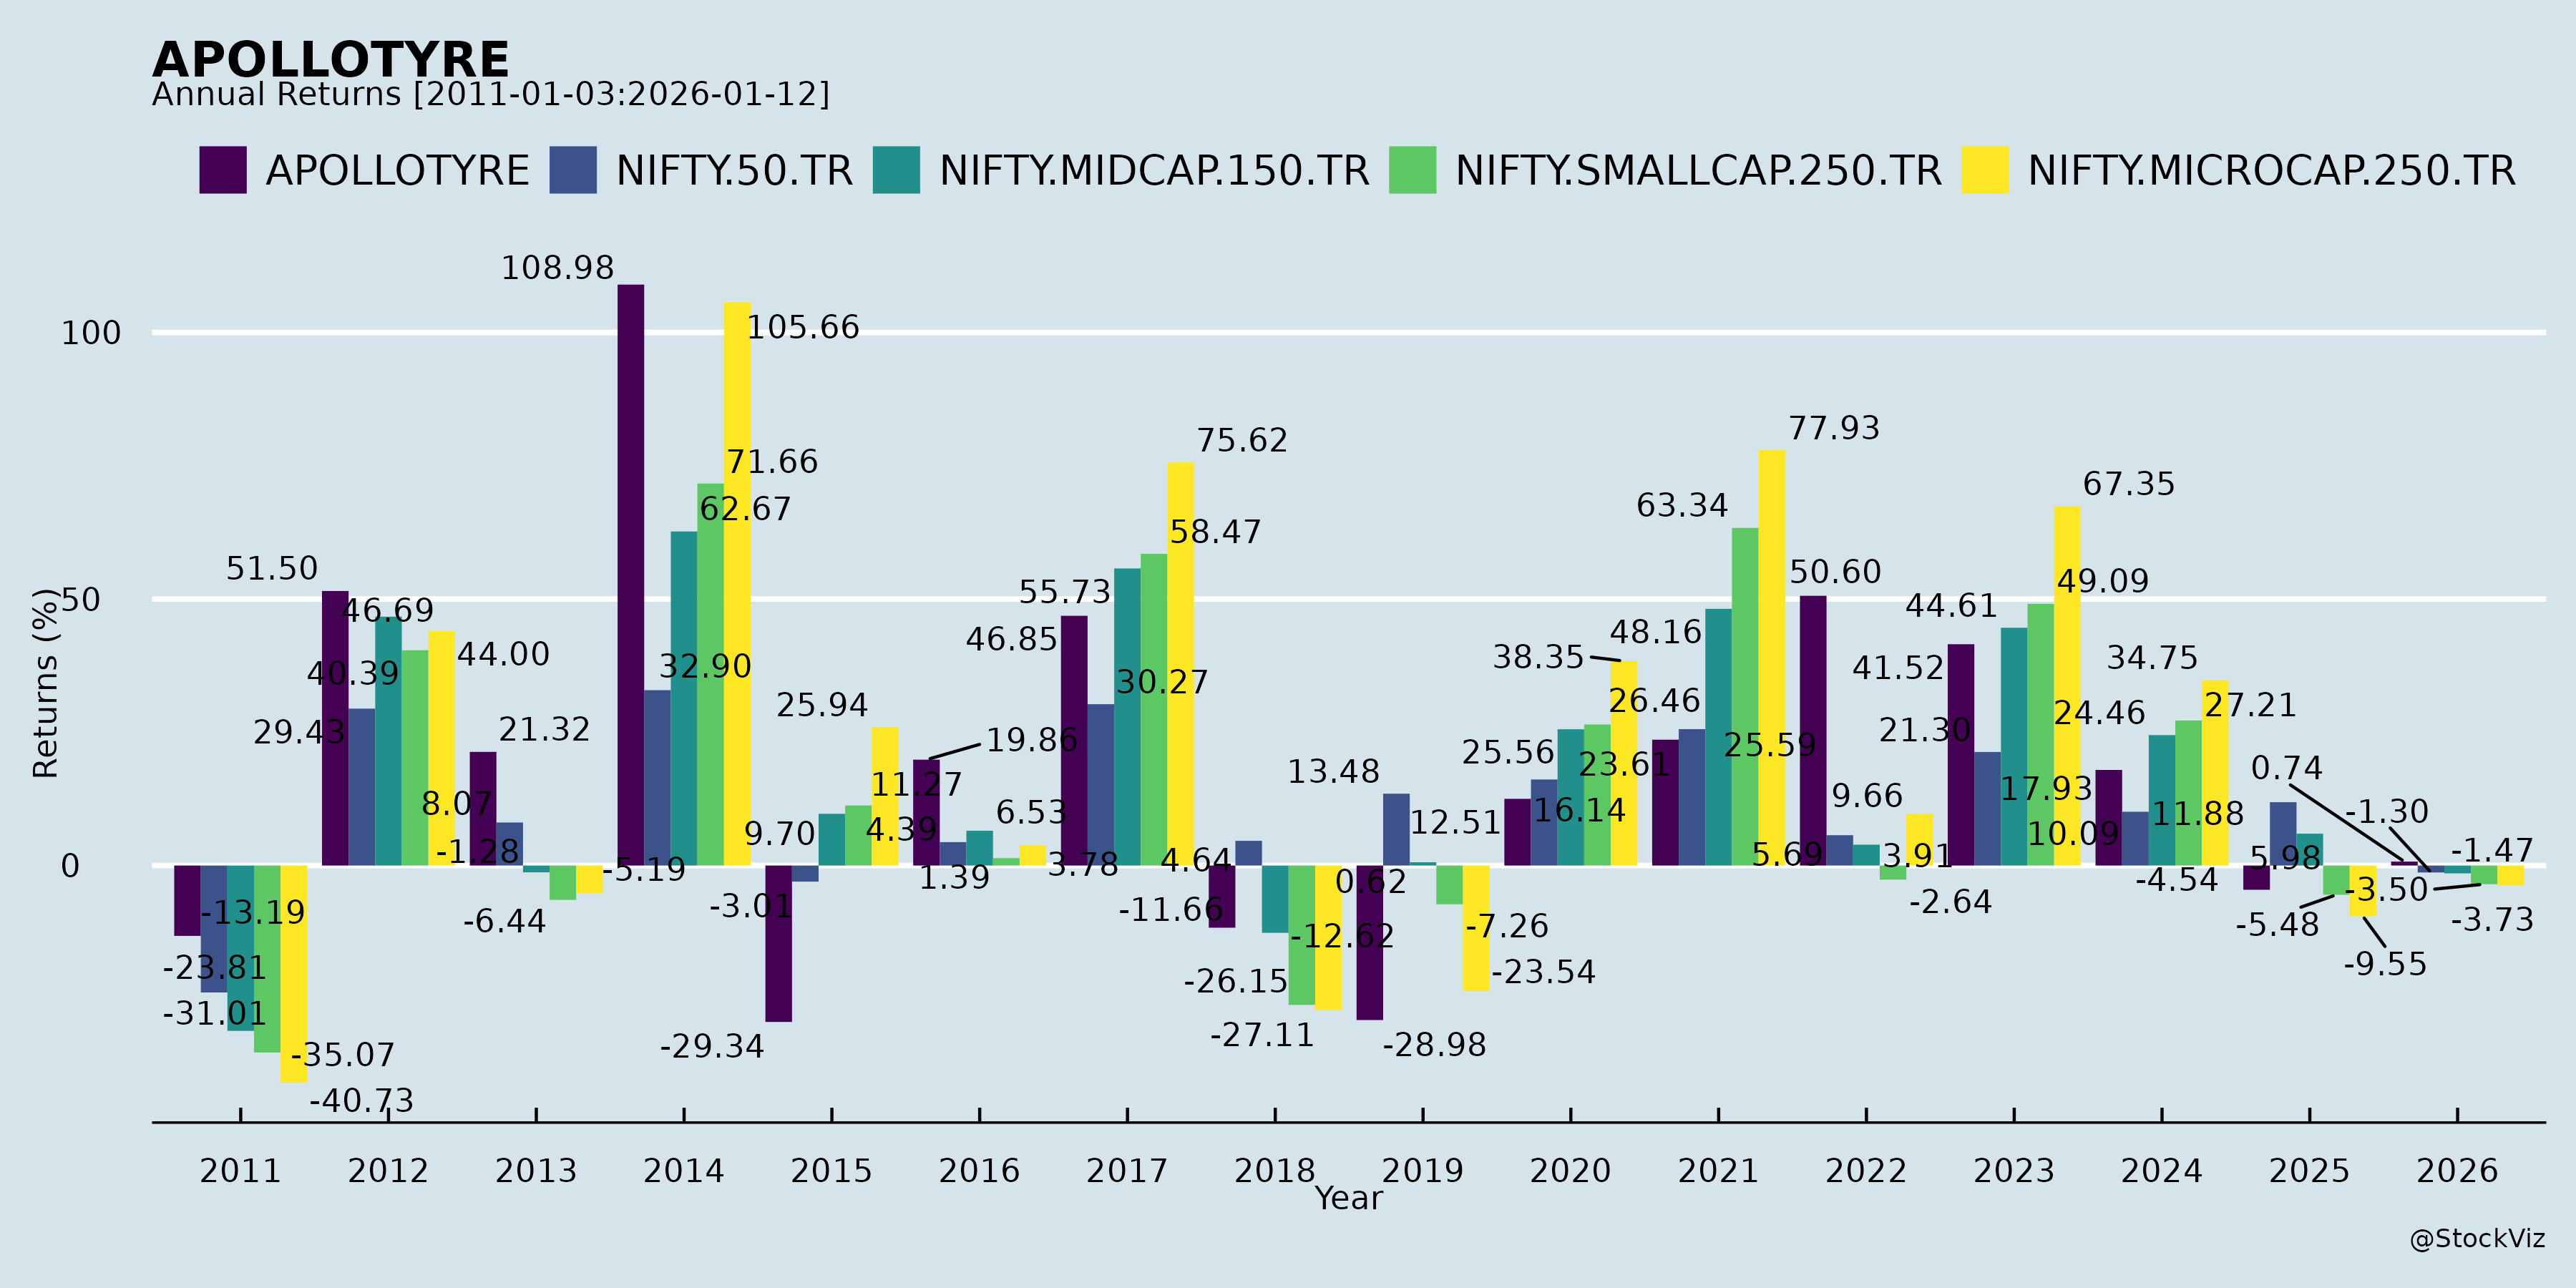
Annual Returns
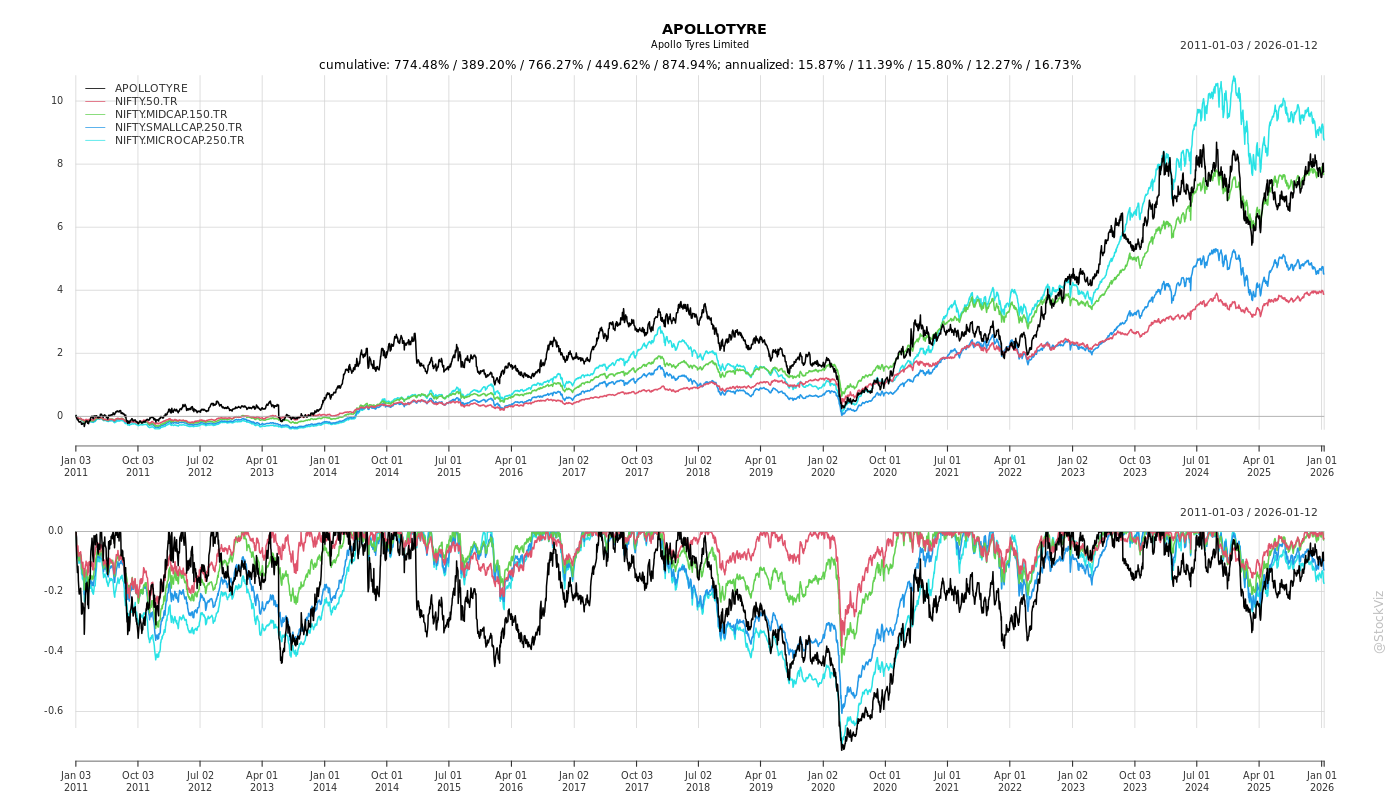
Cumulative Returns and Drawdowns

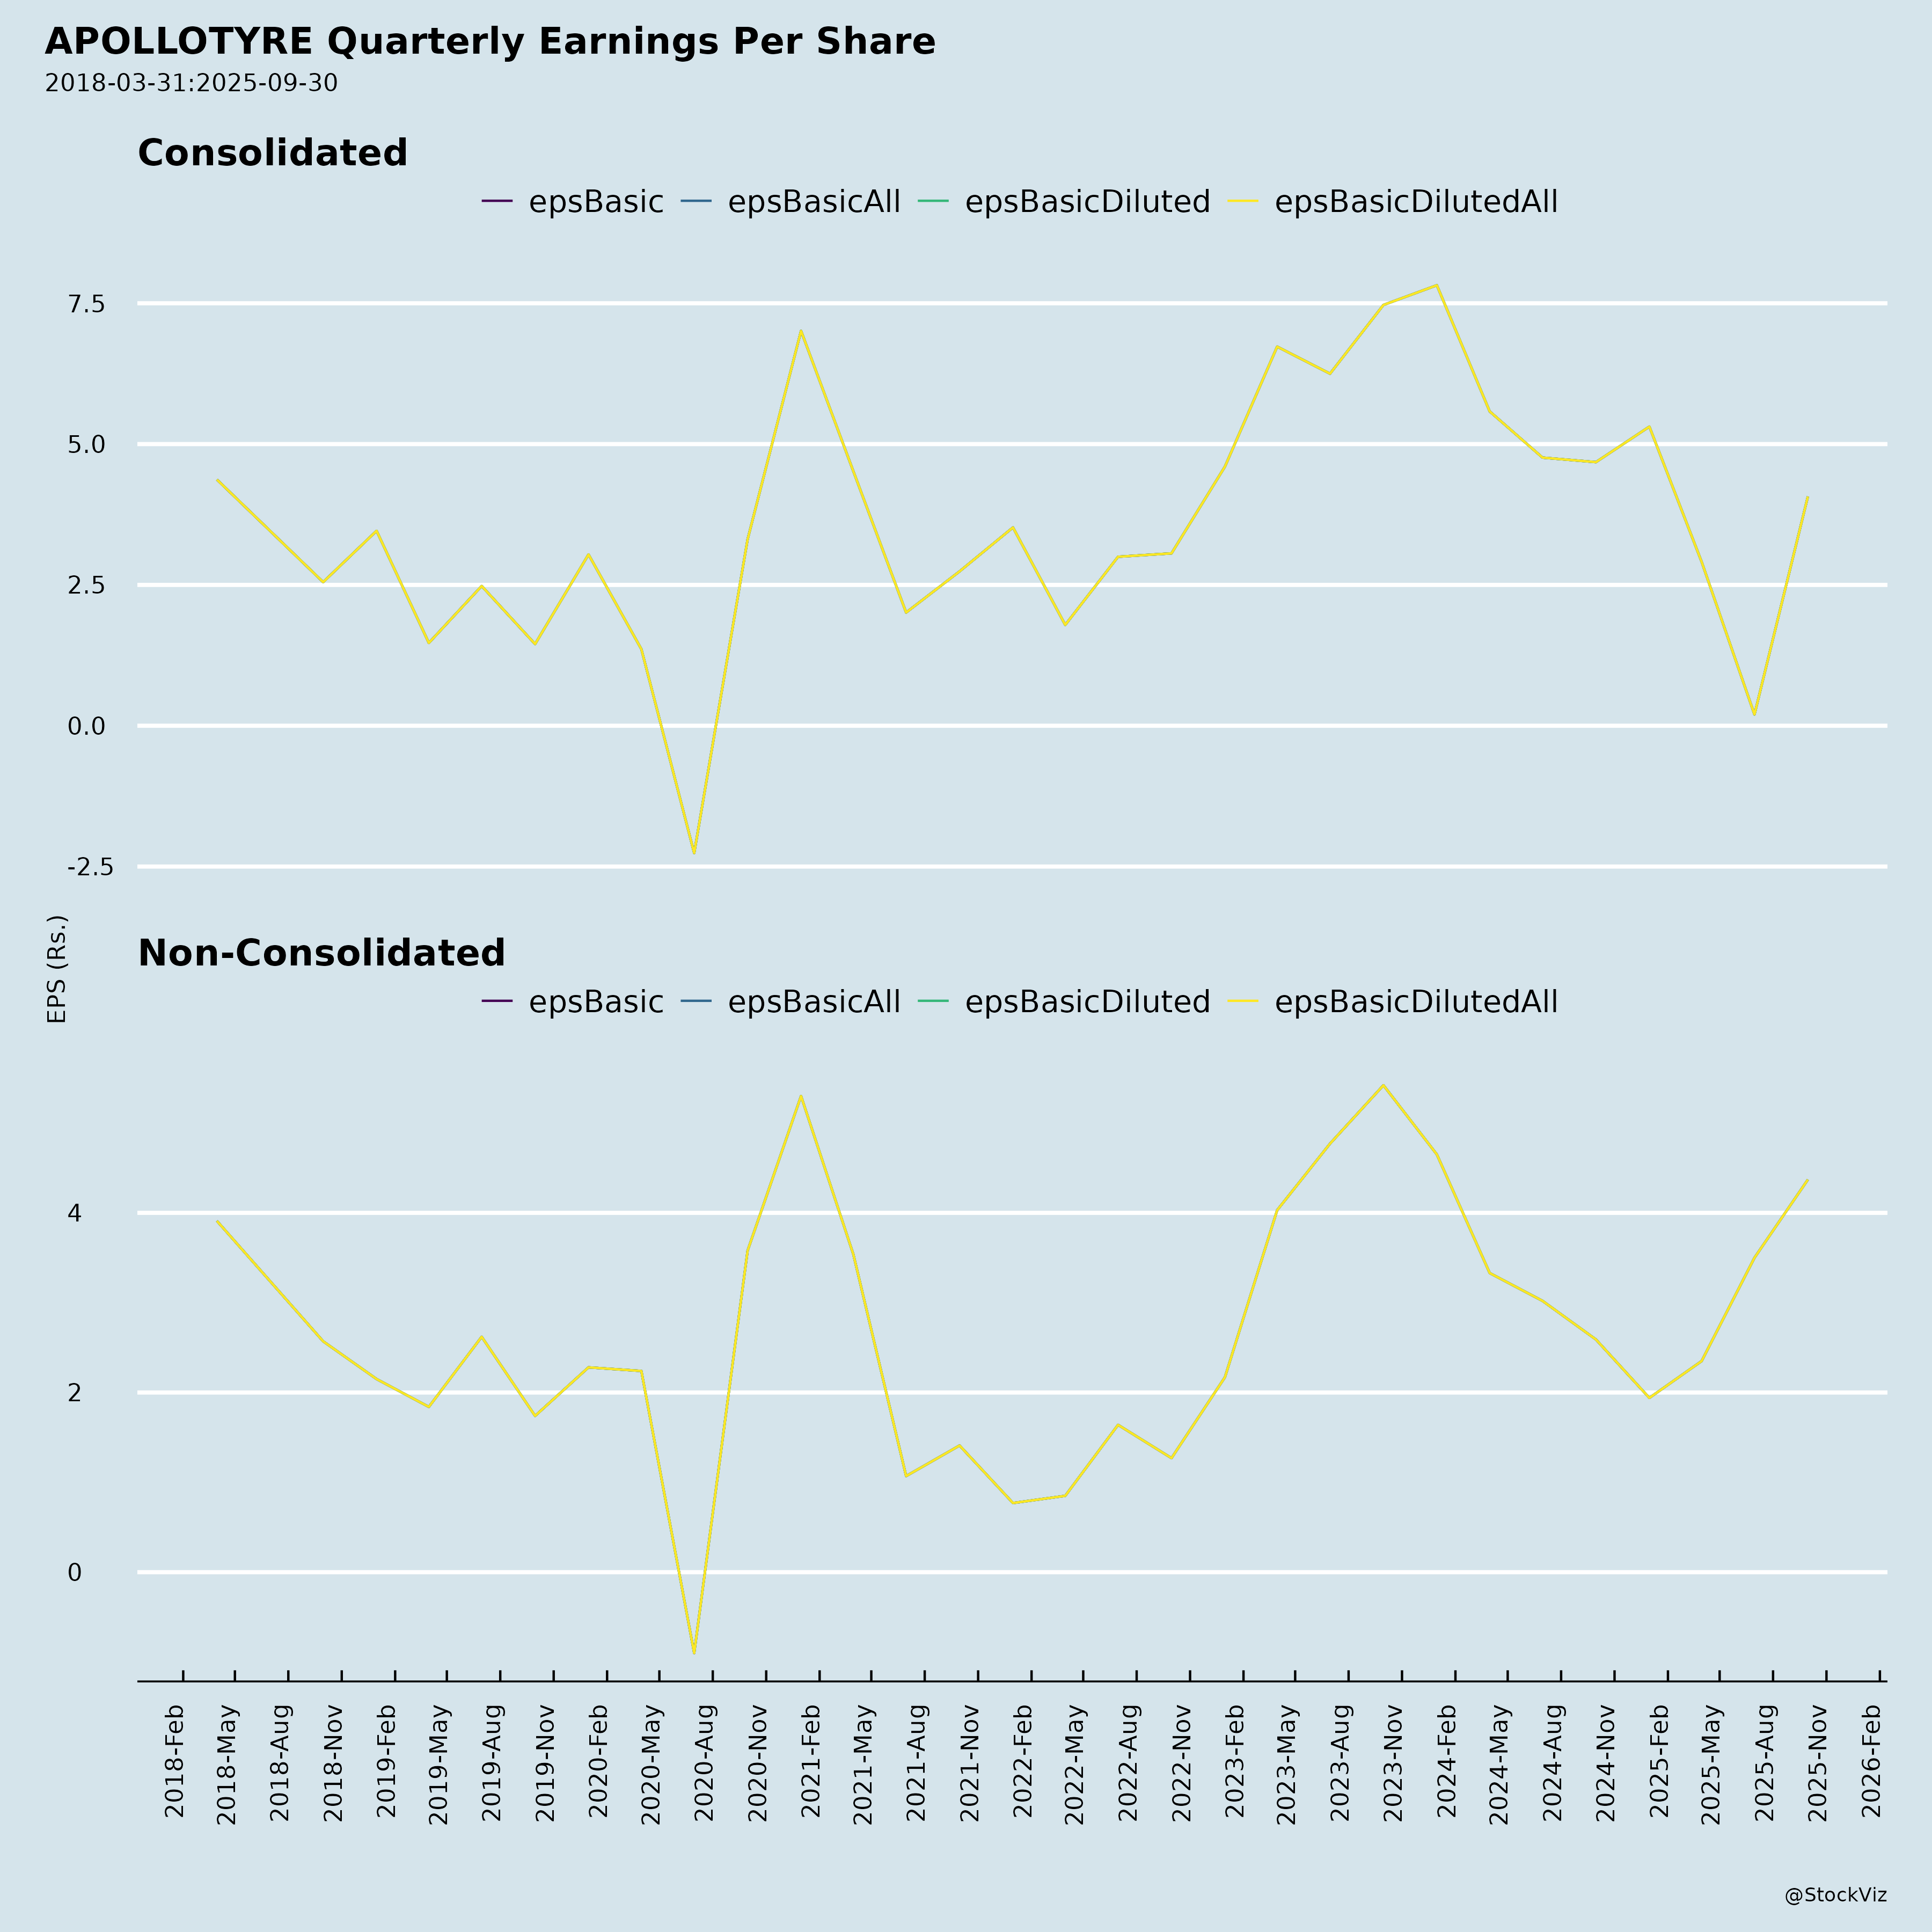
Fundamentals
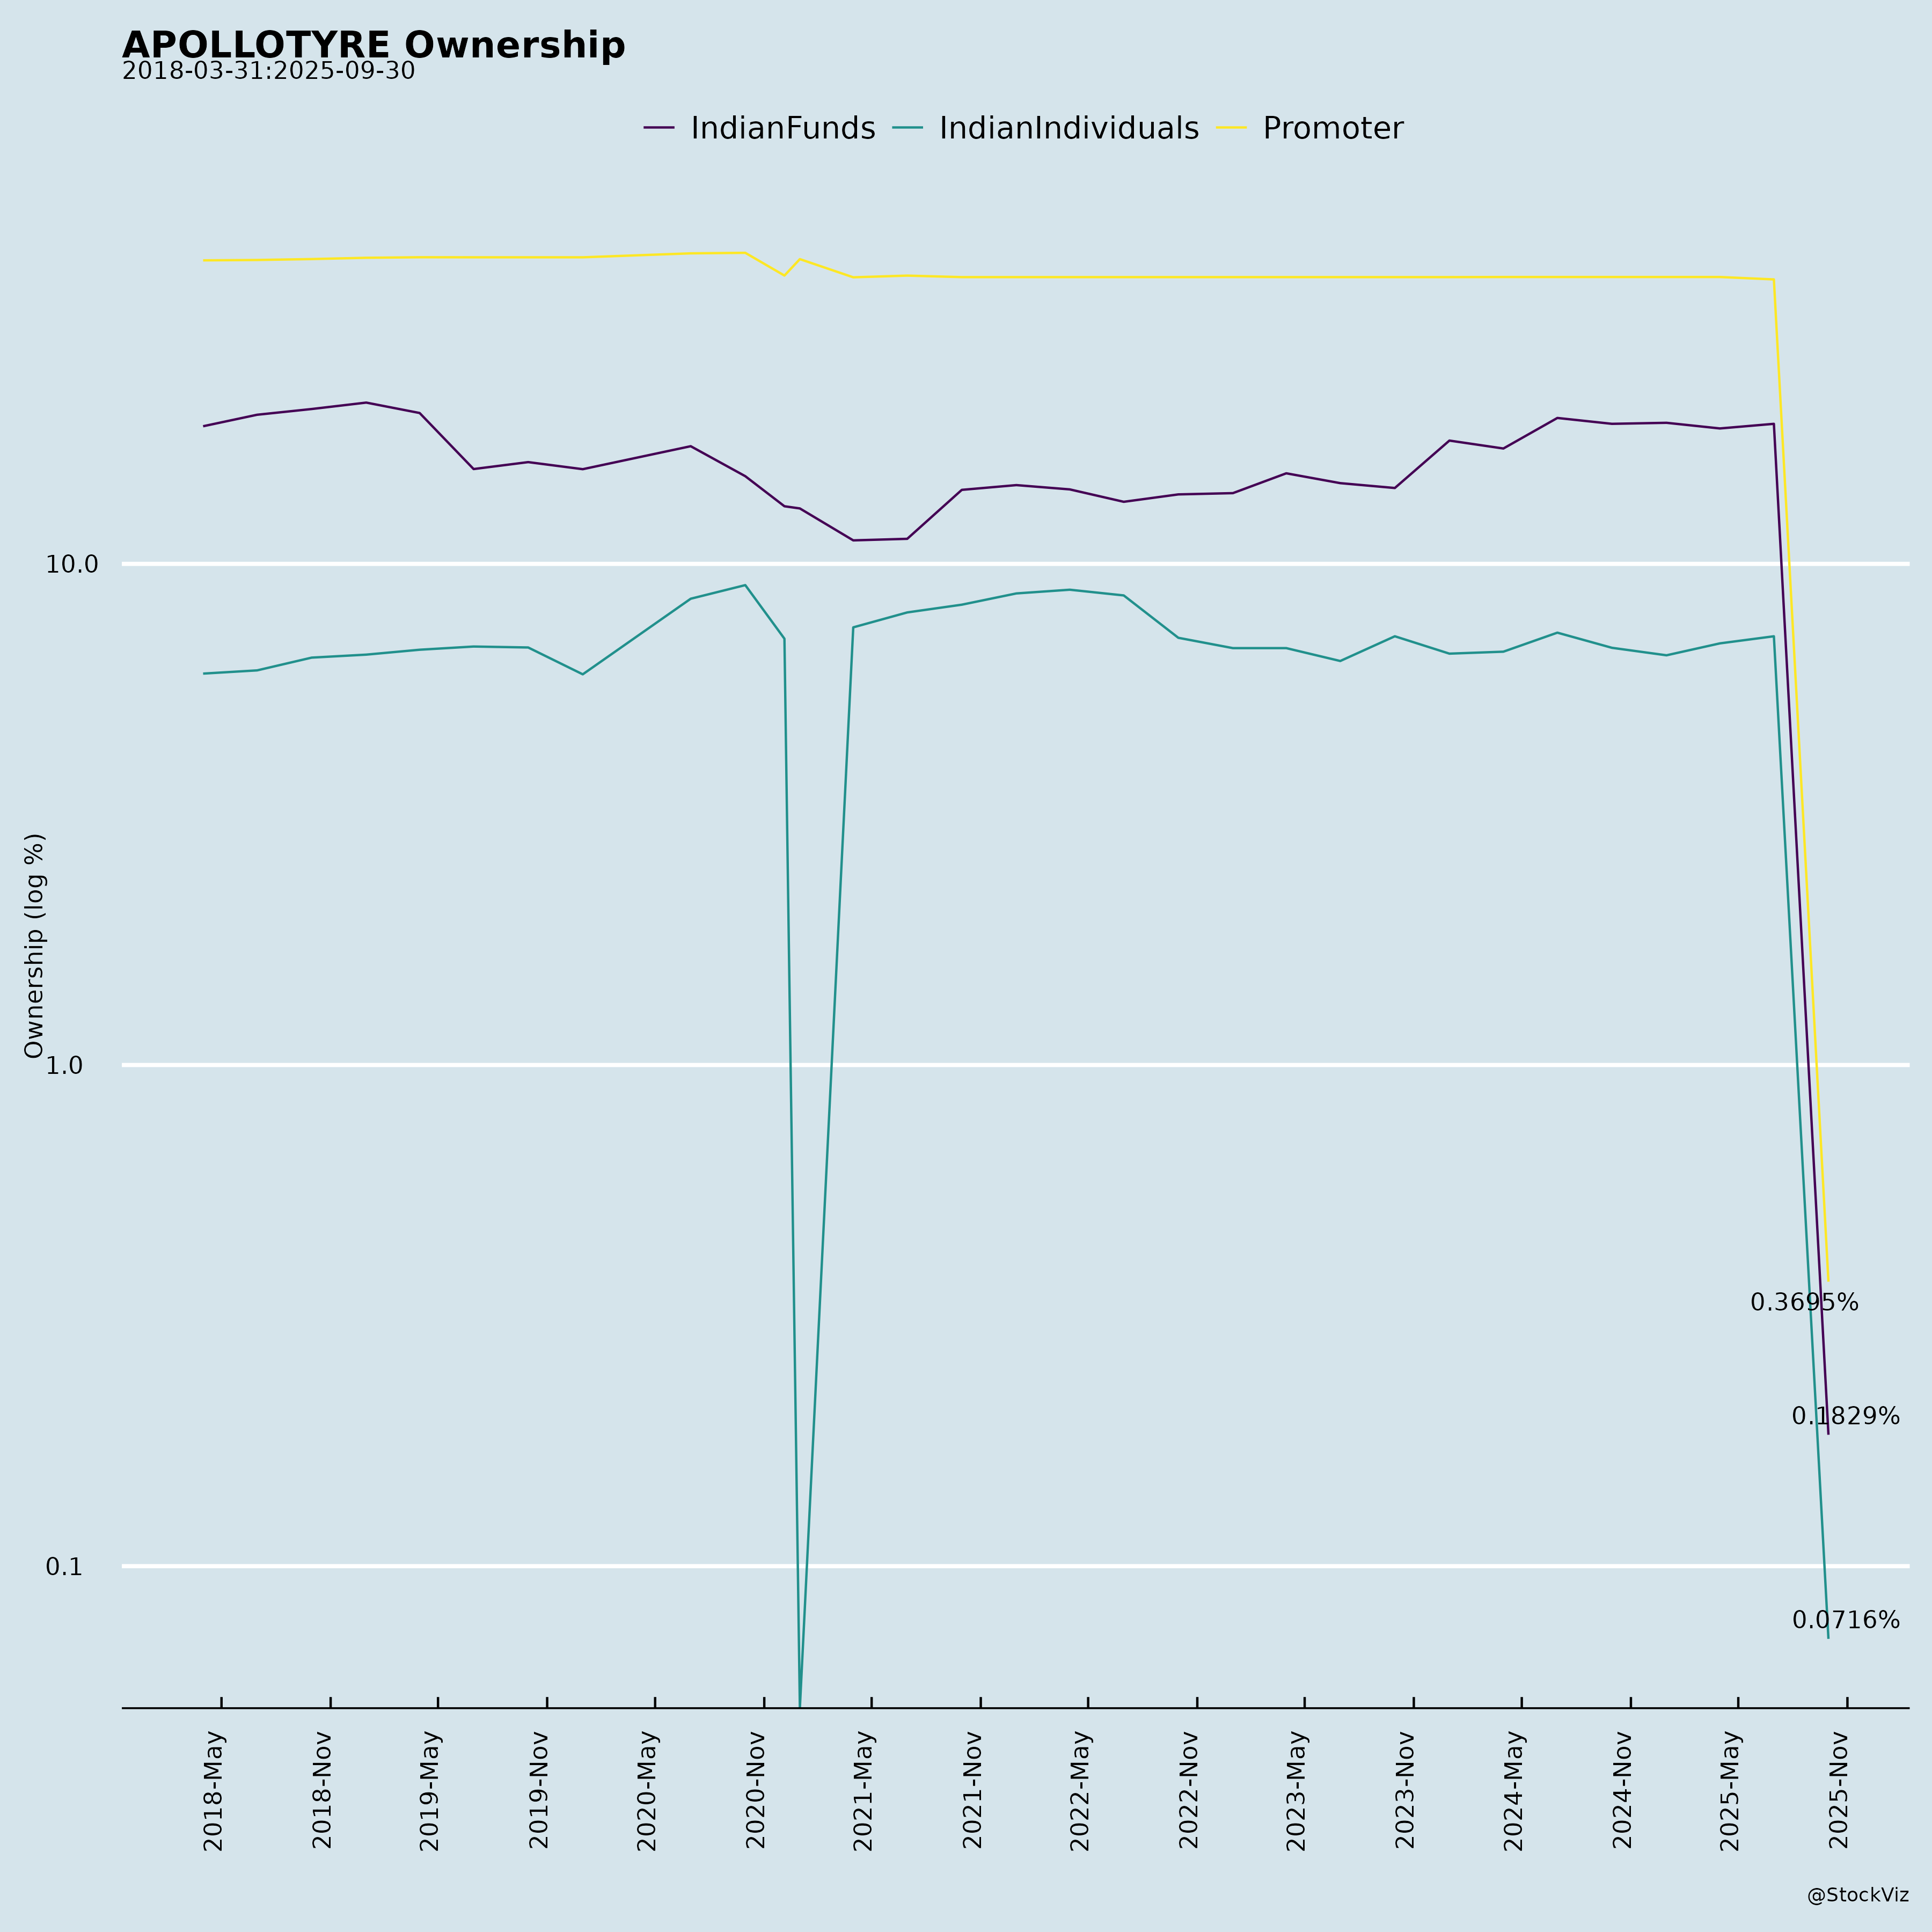
Ownership
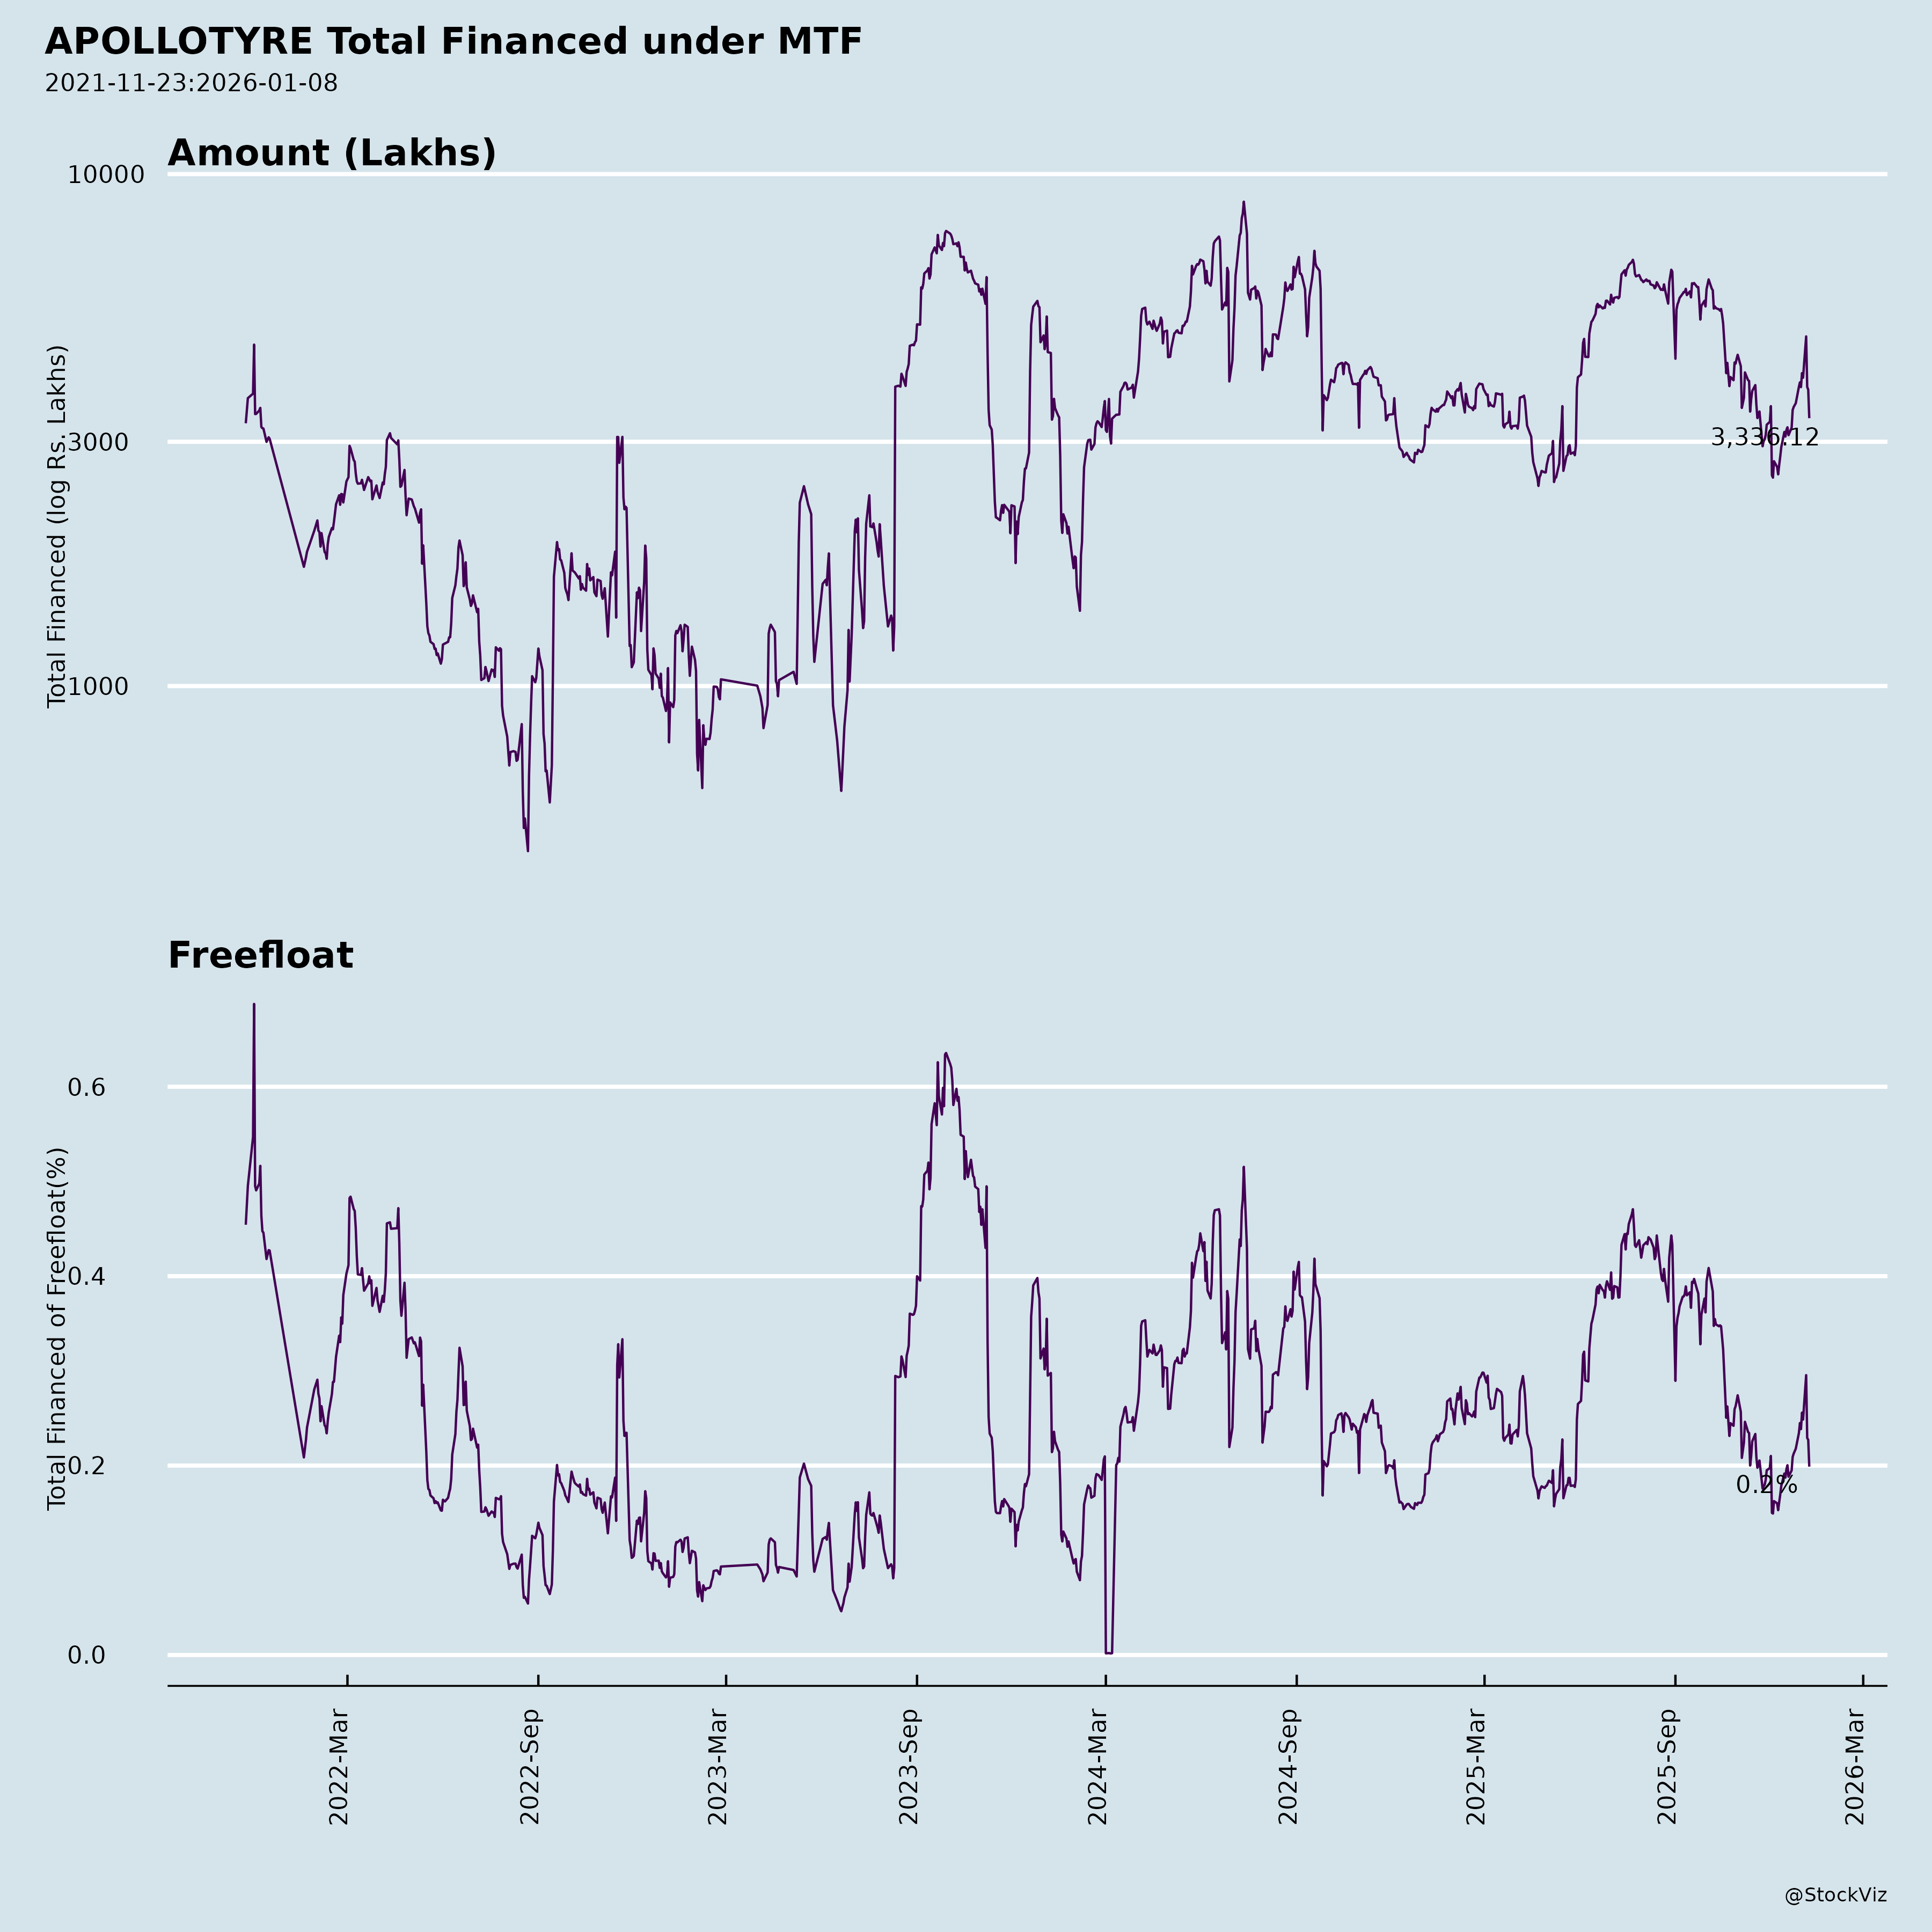
Margined
AI Summary
asof: 2025-12-03
Apollo Tyres Ltd (APOLLOTYRES) Analysis
Overview: Apollo Tyres reported strong Q2 FY26 results (ended Sep 30, 2025) with consolidated revenue up 6% YoY to ₹68.3 Bn (highest growth in 10 quarters), driven by India (6% YoY) and partial Europe recovery. EBITDA margin expanded to 14.9% (vs. 13.6% YoY), aided by GST rationalization, stable raw materials, and operating leverage. PAT was muted at ₹2.6 Bn due to exceptional restructuring costs (₹1.8 Bn in Q2 from Europe plant closure). Net debt stable at ₹26 Bn (0.8x EBITDA). Management outlook remains optimistic for H2 growth, premiumization, and profitability.
Below is a structured analysis of headwinds, tailwinds, growth prospects, and key risks, derived from the Q2 FY26 earnings, financials, analyst transcript, and disclosures.
Tailwinds (Positive Catalysts)
- Robust India Demand & GST Boost: 6% YoY revenue growth; mid-single digit volume rise (replacement +2%, OEM +4%). Farm/2W/3W segments strong; October demand accelerated post-monsoon/infra rebound. GST cuts (7-8%) passed on but unlocked rural volumes (expected mid-high single digits in H2).
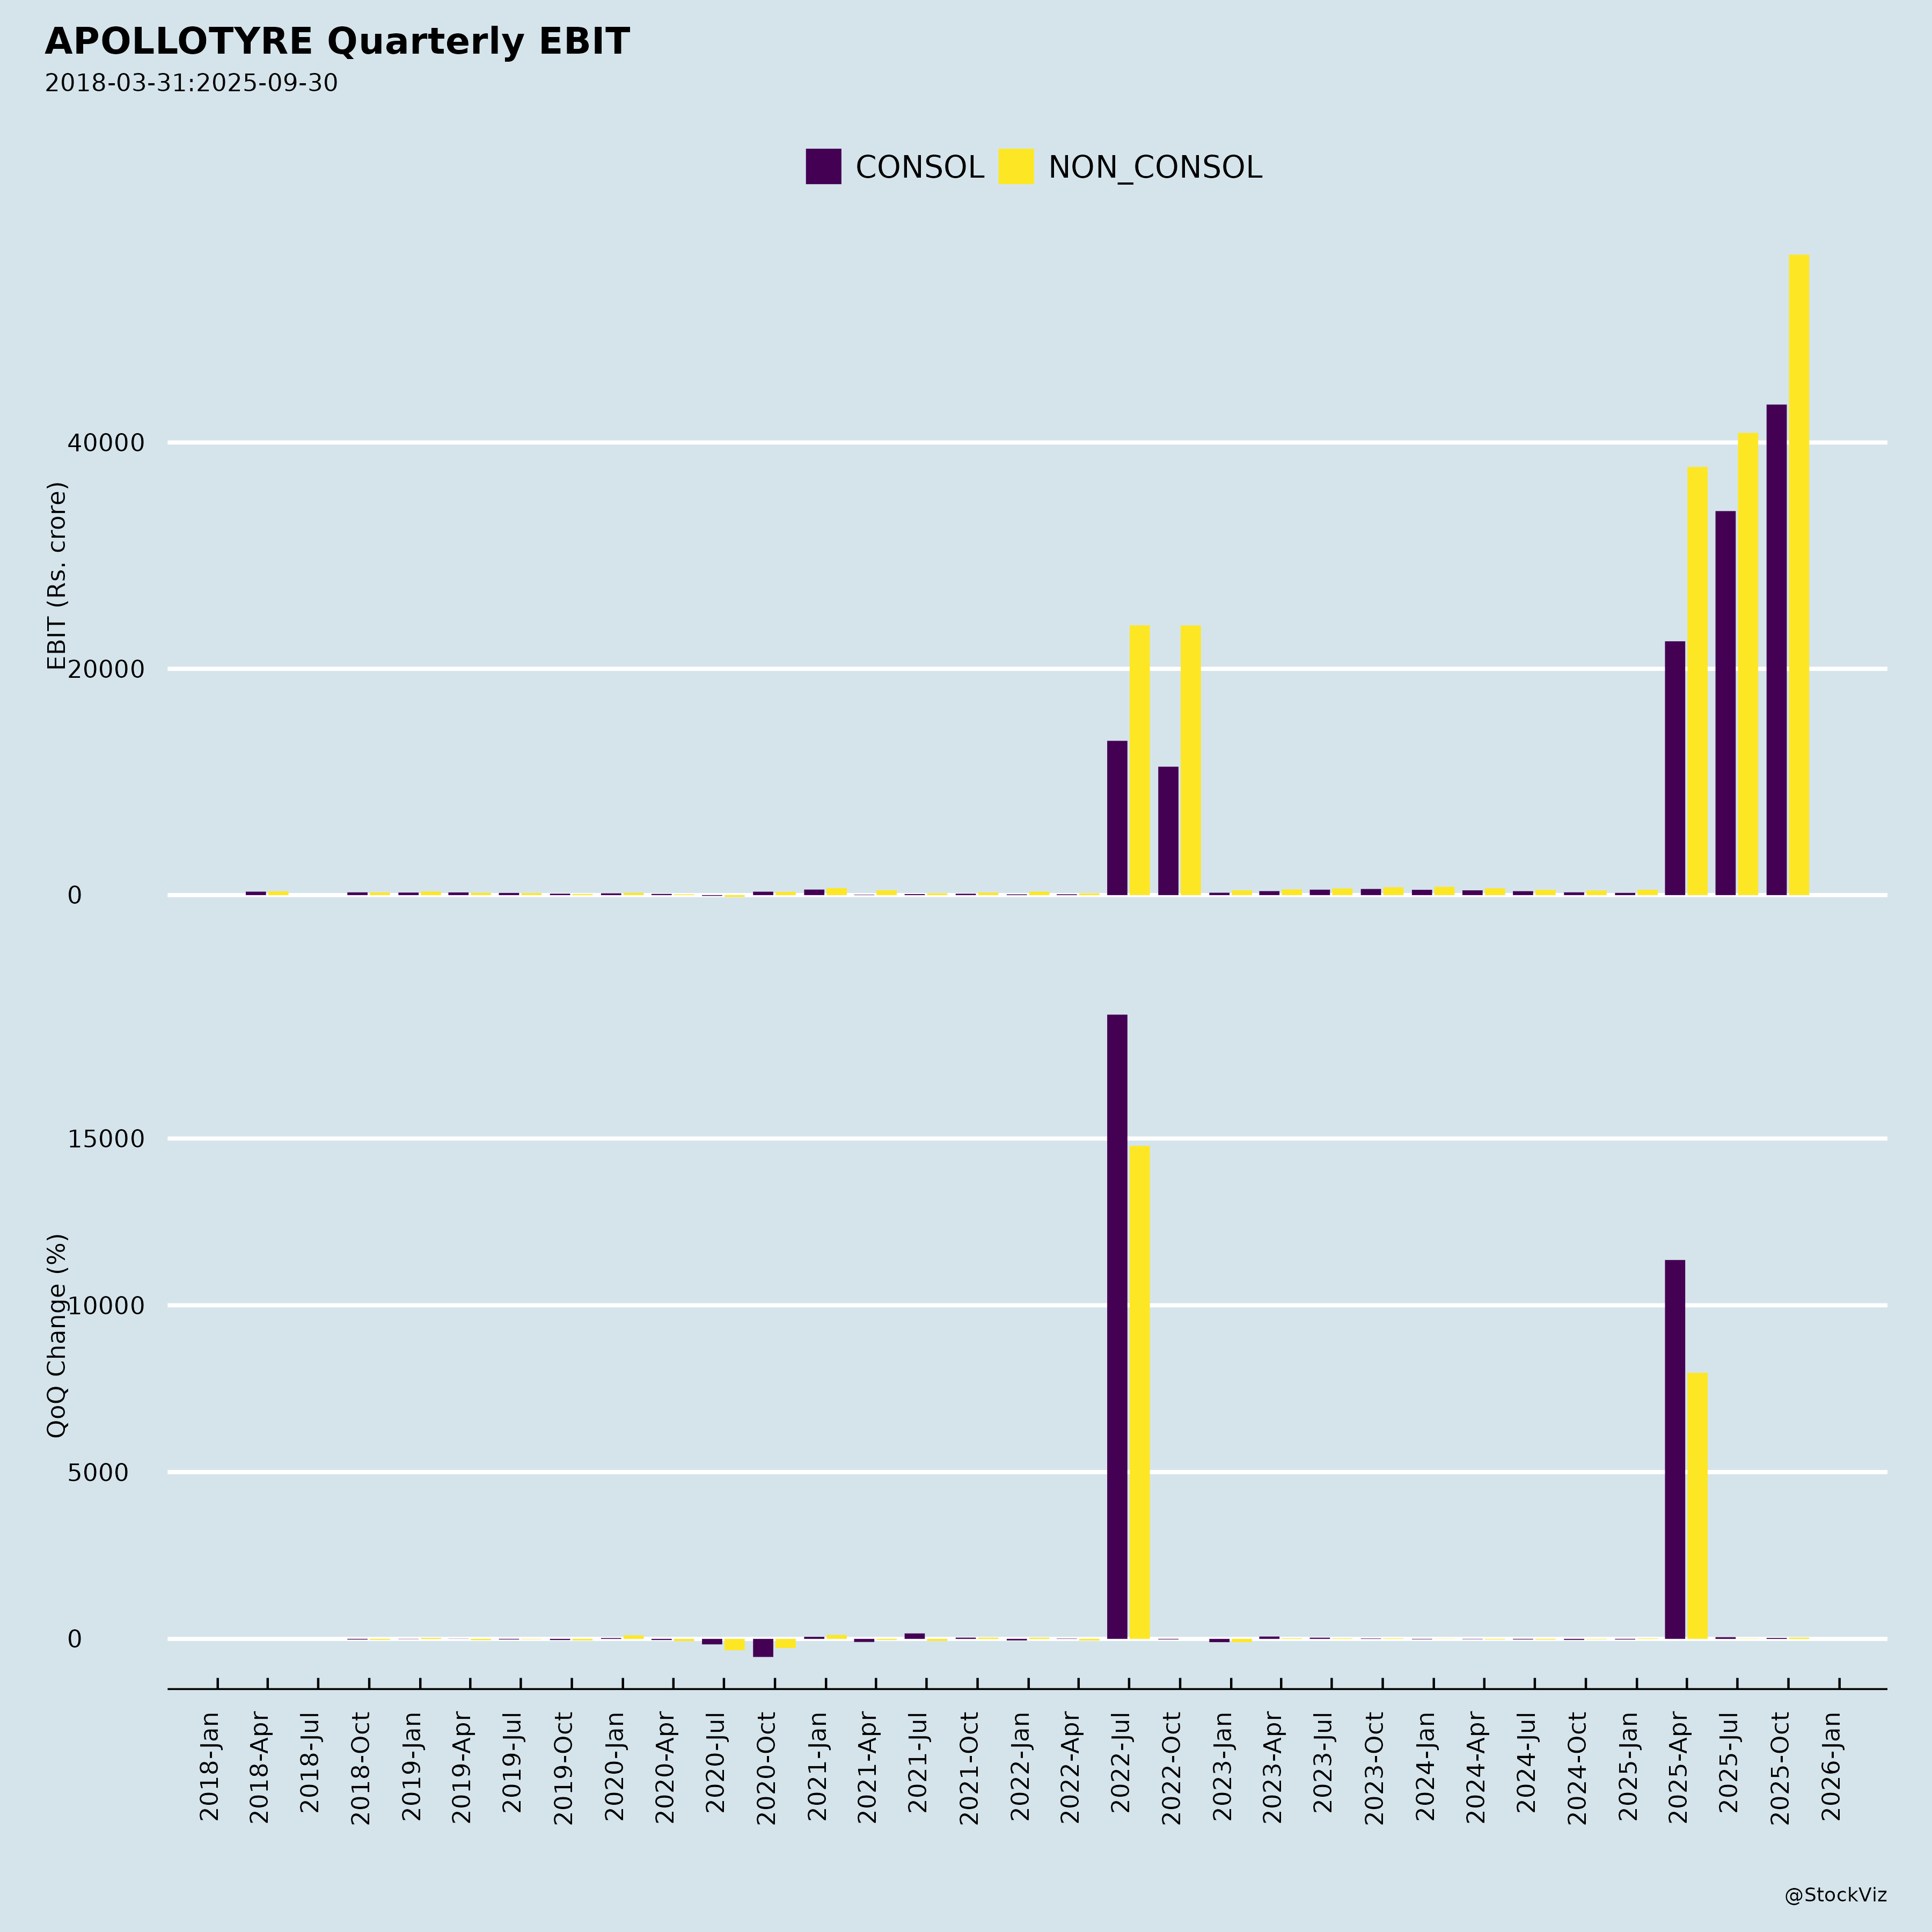
- Margin Expansion: Consolidated EBITDA 14.9% (+130 bps YoY); India at 15.3%. Raw materials down 3% QoQ, expected stable/slightly down in Q3 (NR ₹210/kg, SR ₹175/kg). Favorable mix from premium Vredestein (highest Q2 volumes, 10k tyres/month).
- Brand & Premiumization Momentum: Indian Cricket Team sponsorship to penetrate rural (agri/truck/car/2W). Podium finishes in Europe tests; new OEM wins (German marques). UHP mix up to 49% in Europe.
- Balance Sheet Strength: Net debt flat YoY (India 1.1x EBITDA); free cash flow focus. Capex guided steady.
- Sustainability Edge: ESG score up to 58/100; awards in CSR/safety.
Headwinds (Challenges)
- Europe Weakness: 4% YoY revenue growth (volume-led, no pricing) amid soft demand (PCR stable, Spacemaster OEM decline). EBITDA margin 12.7% (below targets); restructuring drags (Enschede closure: additional €17 Mn exceptional hit; total ~€55 Mn cash cost, payback ~2 yrs).
- Competitive Pressure: TBR replacement share stabilized at ~29% (after prior losses), PCR at 20% (industry-leading). New entrants (e.g., OHT-focused players) may intensify pricing/margins in TBR/PCR; no aggressive price cuts planned.
- Minor Regulatory Hit: Customs ADD demand + penalty (₹12.69 Lacs); appeal planned, no material impact.
- Demand Muted in Segments: Truck/PCR OEM soft; Sep GST transition caused 1-month destocking (now restocked).
Growth Prospects
| Segment/Driver | Outlook | Key Metrics |
|---|---|---|
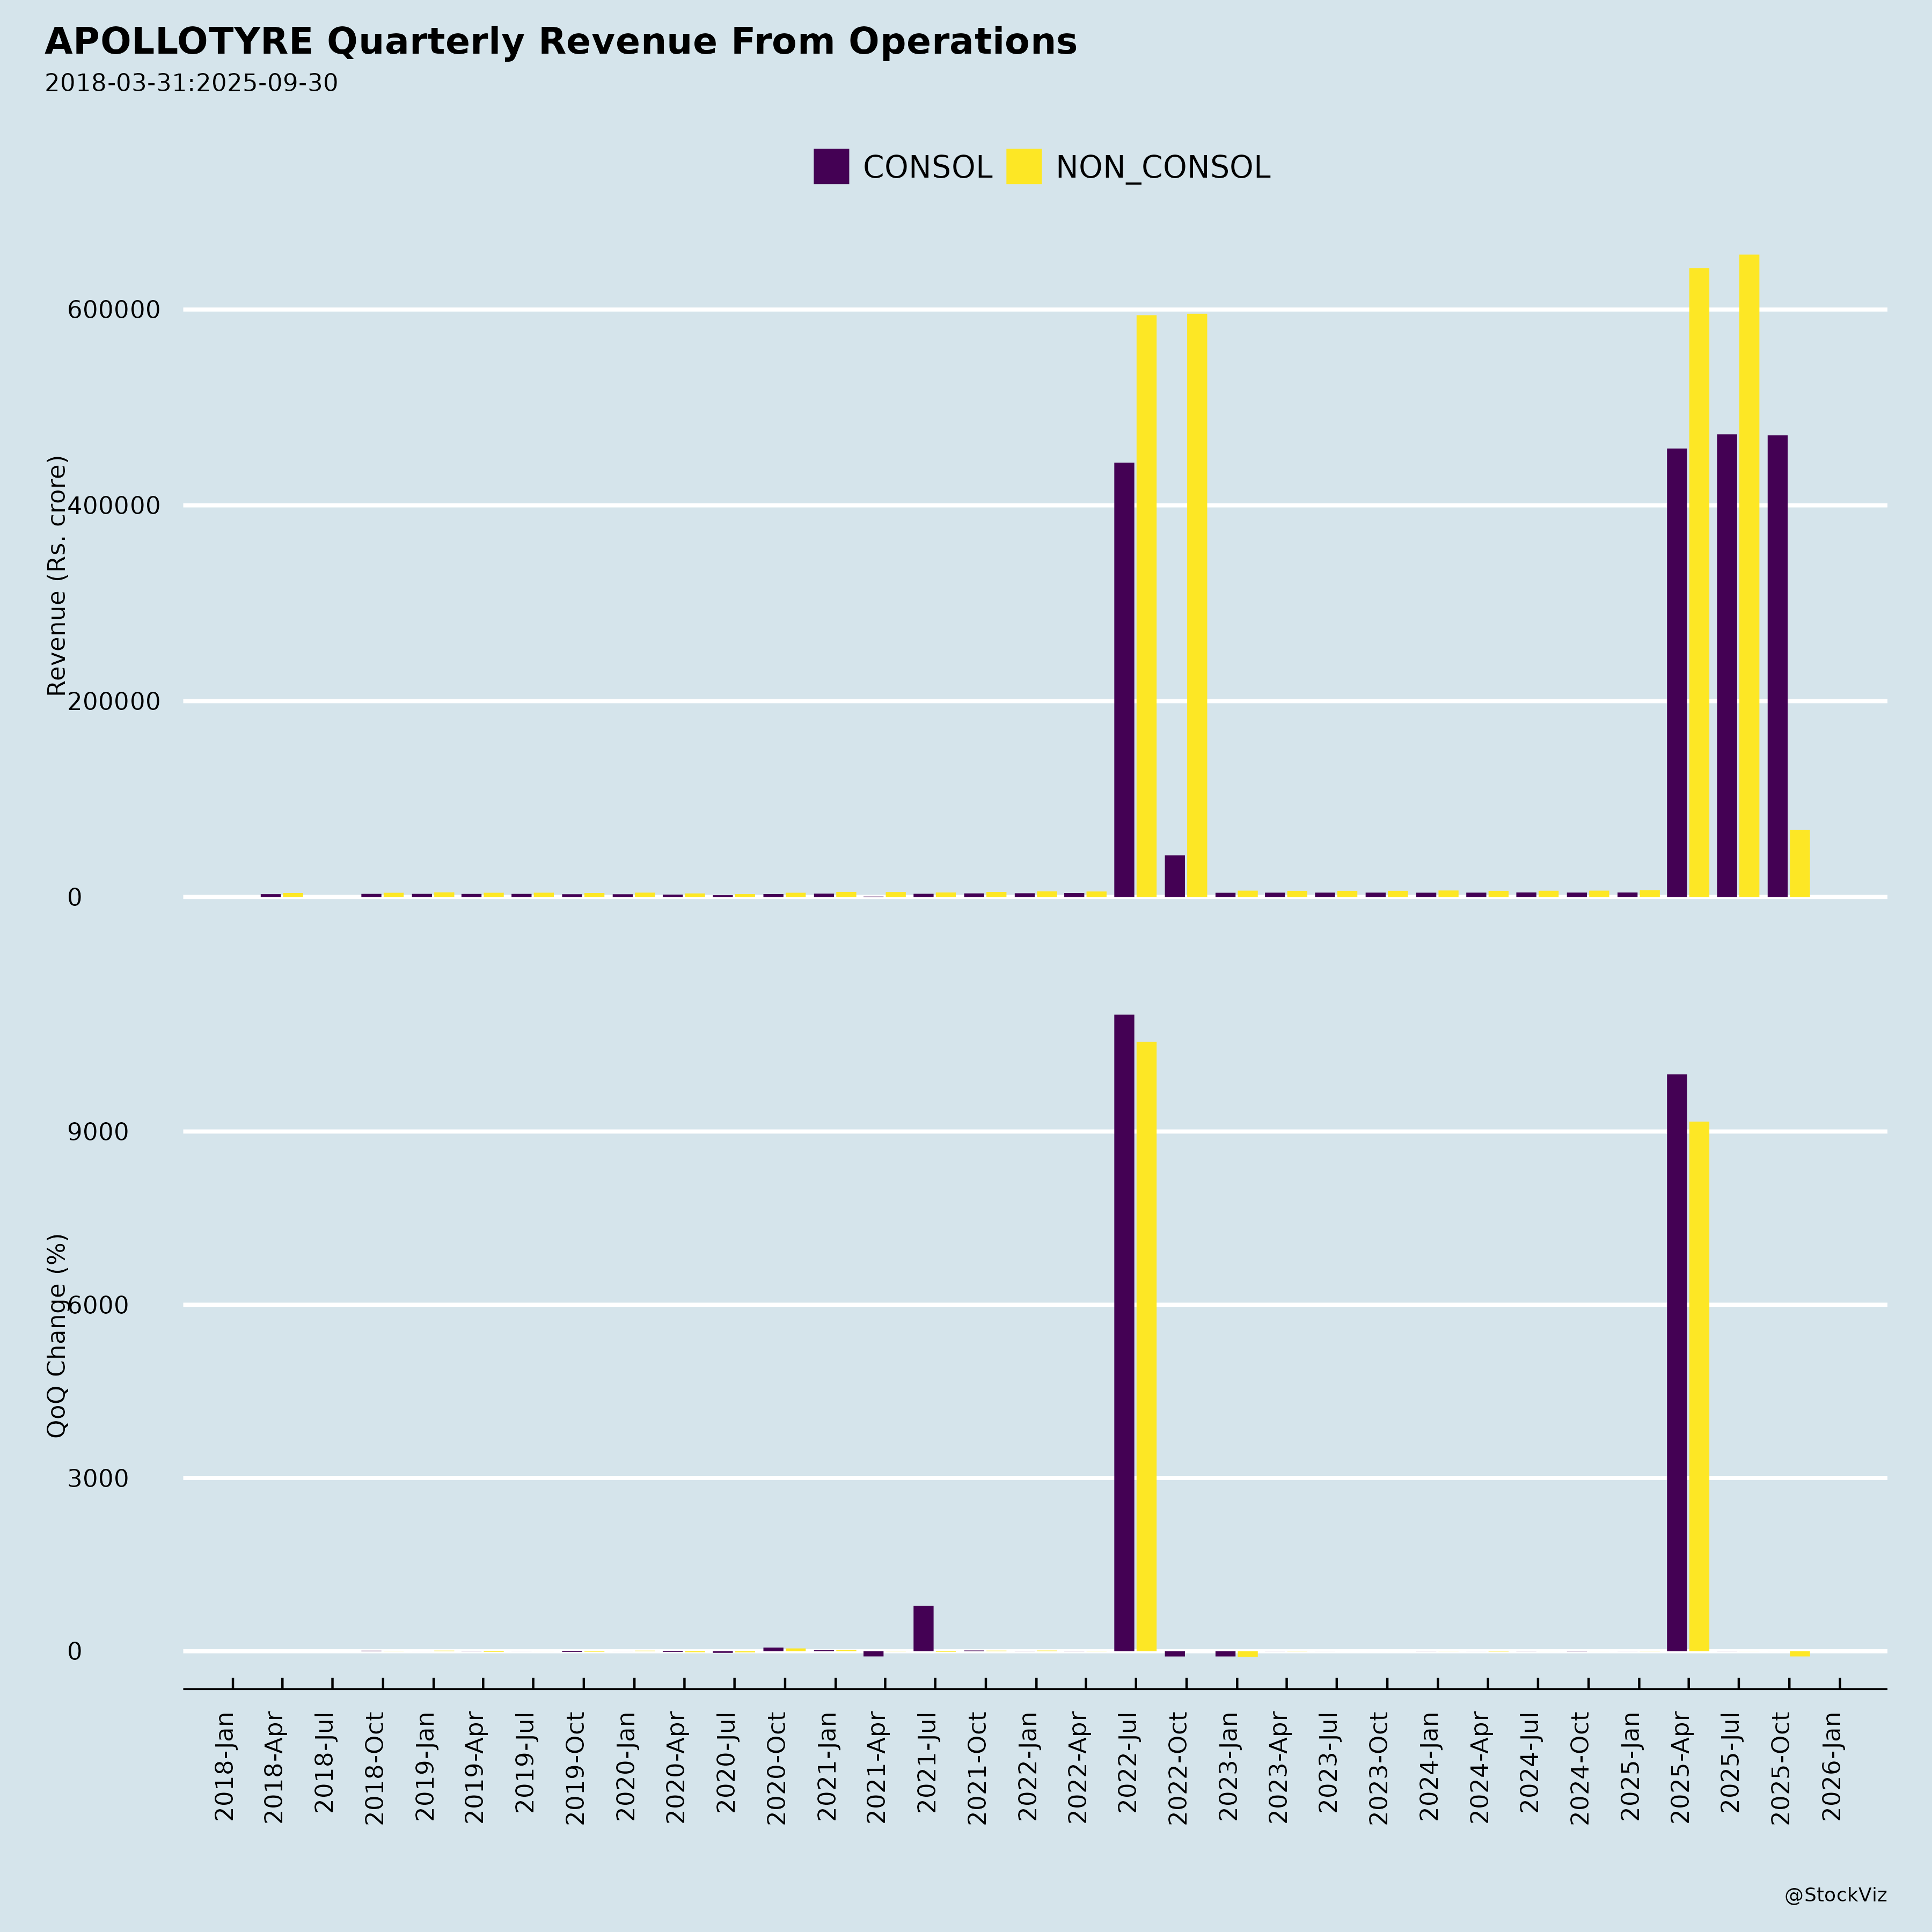
| India (70%+ Revenue) | H2 momentum sustained (Q3 ≥ Q2 growth); replacement mid-high single digits. Rural/infra/mining rebound. | Revenue ₹47 Bn Q2 (+6% YoY); exports double-digit recovery (FY26 high single-digit). |
| Europe (25-30%) | Low single-digit growth post-restructuring; PCR capacity ramp (Hungary). Premium UHP focus. | €177 Mn Q2 (+4% YoY, +21% QoQ seasonal); sequential profitability uptick expected. |
| Exports/Others | Double-digit Q2; FY26 high single-digit. | Strong recovery from weak Q1. |
| Overall FY26 | Top-line acceleration; EBITDA margins stable/improving (14%+); ROCE trajectory to 15% (from 12%+ cycle target). Capex expansions: Hungary/AP PCR online FY27. | Brand investments (cricket) to drive long-term share gains; Vredestein premiumization. |
- Strategic Pillars: R&D wins, distribution expansion, sustainability (healthcare app for drivers). No major inorganic push unless value-accretive.
Key Risks
| Risk Category | Description | Mitigation |
|---|---|---|
| Commodity/Inflation | Raw mat upcycle (e.g., rubber); GST headroom helps but limited pricing power. | Stable outlook; 7-8% GST cushion for adverse turns. |
| Competition | New TBR/PCR entrants; share erosion if pricing wars. | Product/brand/distribution focus (no pricing route); OEM RFQ selectivity. |
| Europe Execution | Restructuring delays (Enschede closure by Jun 2026); persistent weak demand. | Settlement reached; long-term profitability boost (like FY21). |
| Demand/Macro | Slow OEM recovery; rural monsoon/infra delays; global slowdown. | Diversified (replacement-led); infra/mining tailwinds. |
| Forex/Regulatory | Europe translation gains volatile; minor disputes (customs). | Hedging; appeals/no material impact. |
| Capex/Debt | FY26 capex on track; NCD raise (₹10 Bn) for liquidity. | Low leverage (0.8x); FCF priority. |
Quantitative Snapshot (Consolidated, ₹ Mn): | Metric | Q2 FY26 | H1 FY26 | YoY Chg (H1) | |——–|———|———|————–| | Revenue | 68,311 | 133,918 | +5% | | EBITDA (14.1%) | ~9,600 | ~18,900 | +5% | | PAT | 2,580 | 2,709 | -55% (ex-items) | | Net Debt/EBITDA | - | 0.8x | Stable |
Summary
Bull Case: India dominance (volume/margin tailwinds) + Europe restructuring payoff + premiumization could drive 8-10% FY26 revenue CAGR, 14-15% EBITDA margins, and ROCE >15%. Cricket sponsorship unlocks rural goldmine post-GST. Bear Case: Europe drags + competition erodes TBR share + raw mat spike caps multiples. Valuation Context: Trading at ~7-8x FY26 EV/EBITDA (peer avg 8-10x); upgrade potential on H2 beat. Recommendation: Accumulate on dips; monitor Europe execution and Q3 volumes. Low debt/margin resilience supports resilience amid cyclicality.
Copyright © 2023 SAS Data Analytics Pvt. Ltd. All rights reserved.