APLLTD
Equity Metrics
November 18, 2026
Alembic Pharmaceuticals Limited
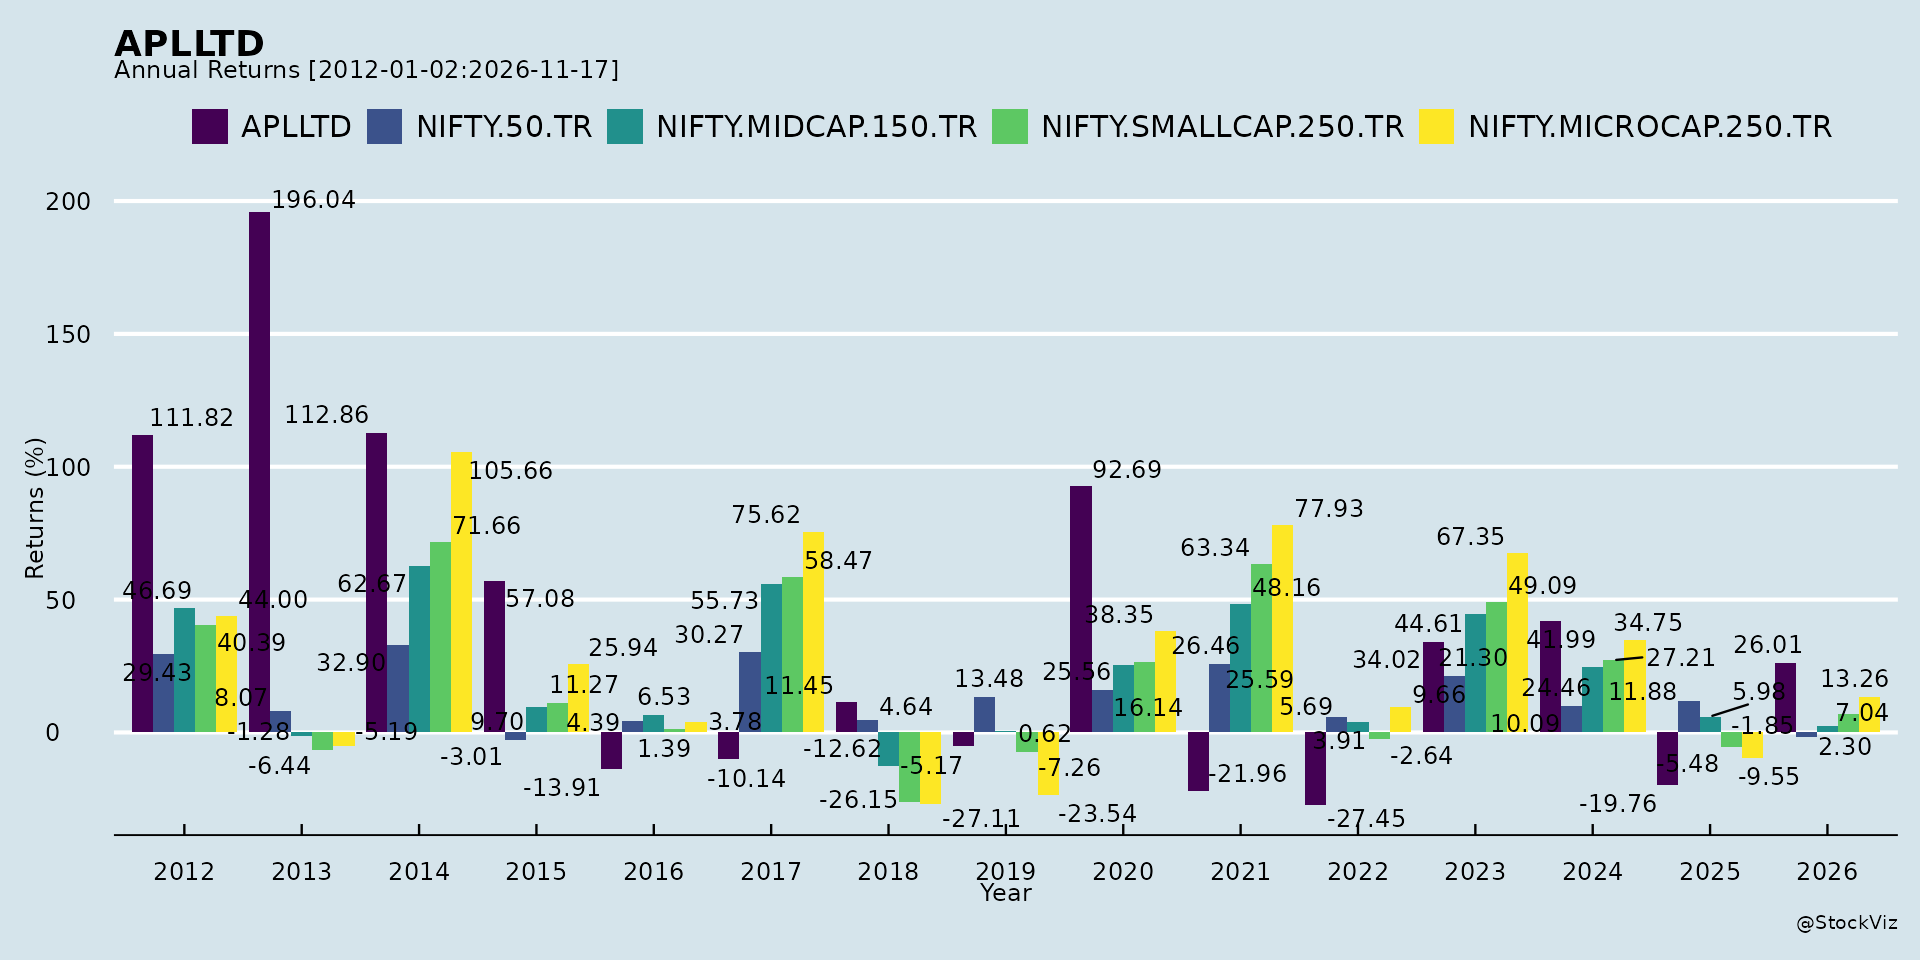
Annual Returns
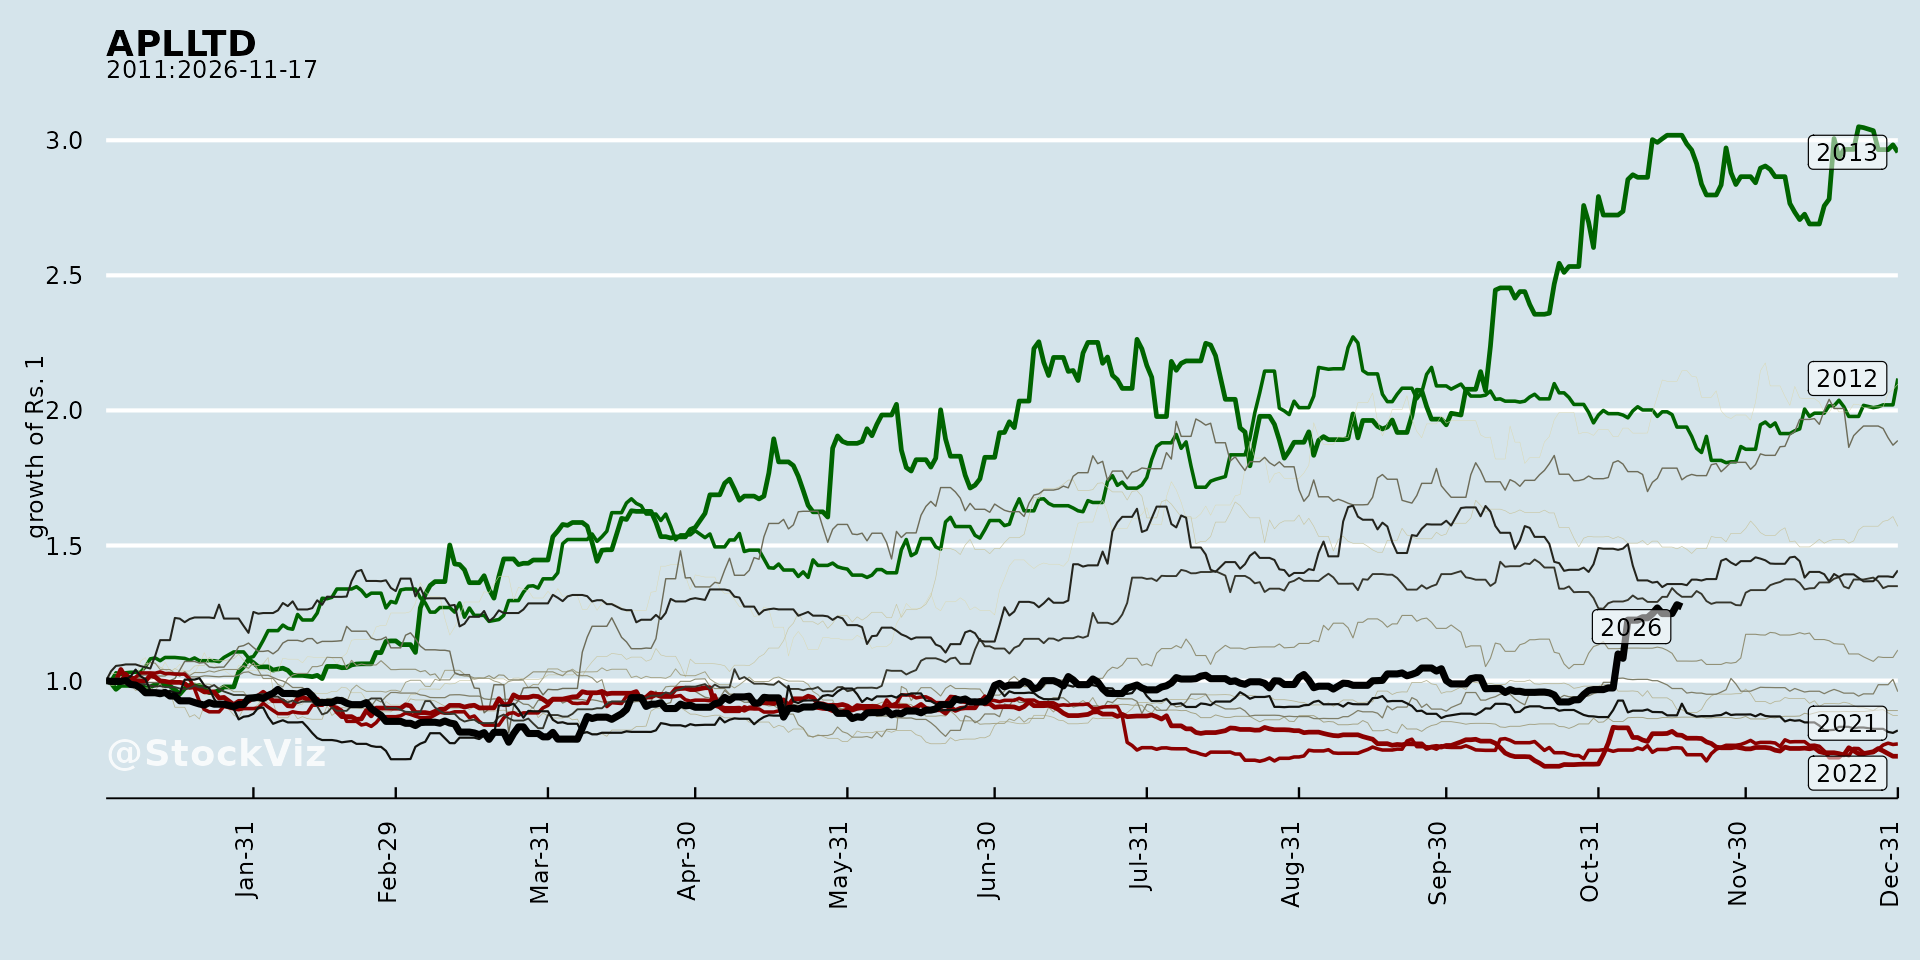
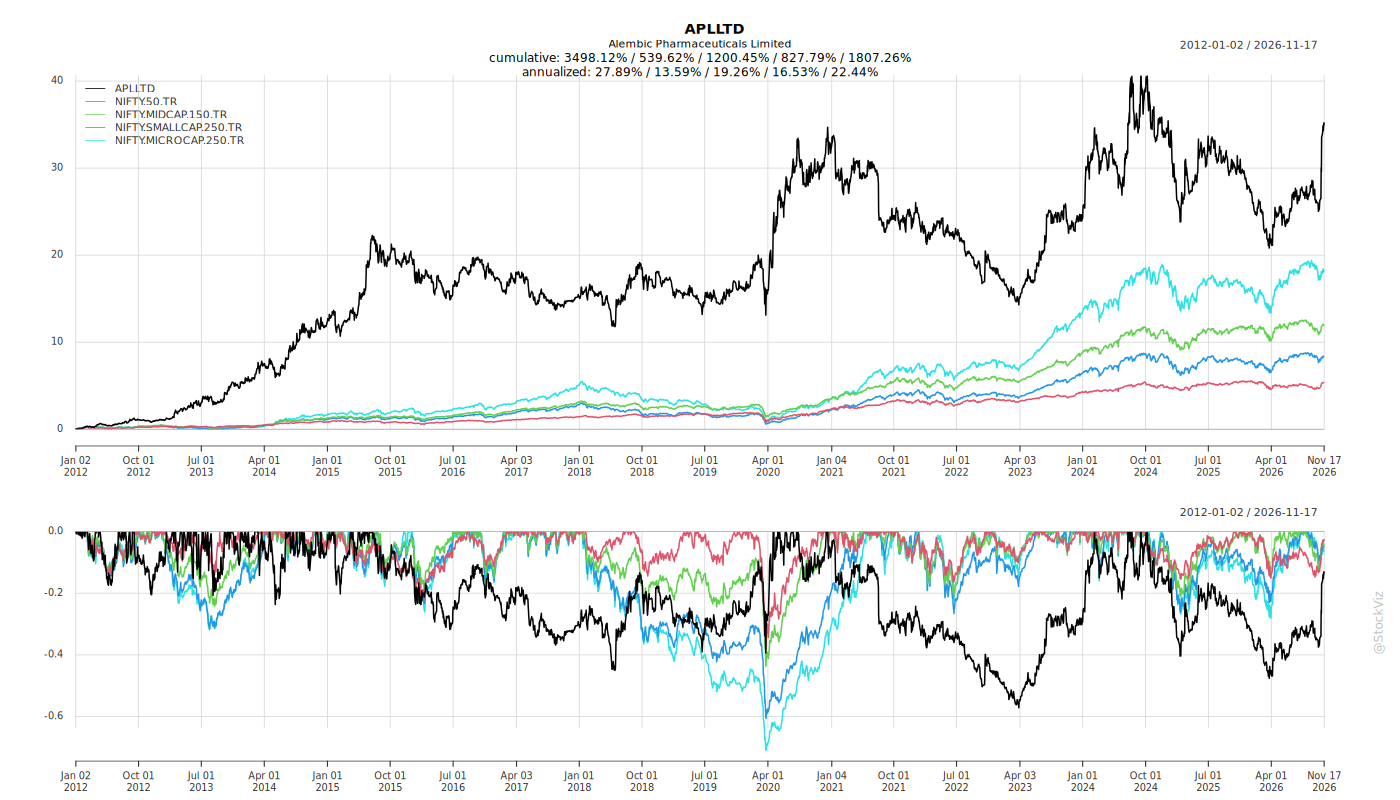
Cumulative Returns and Drawdowns
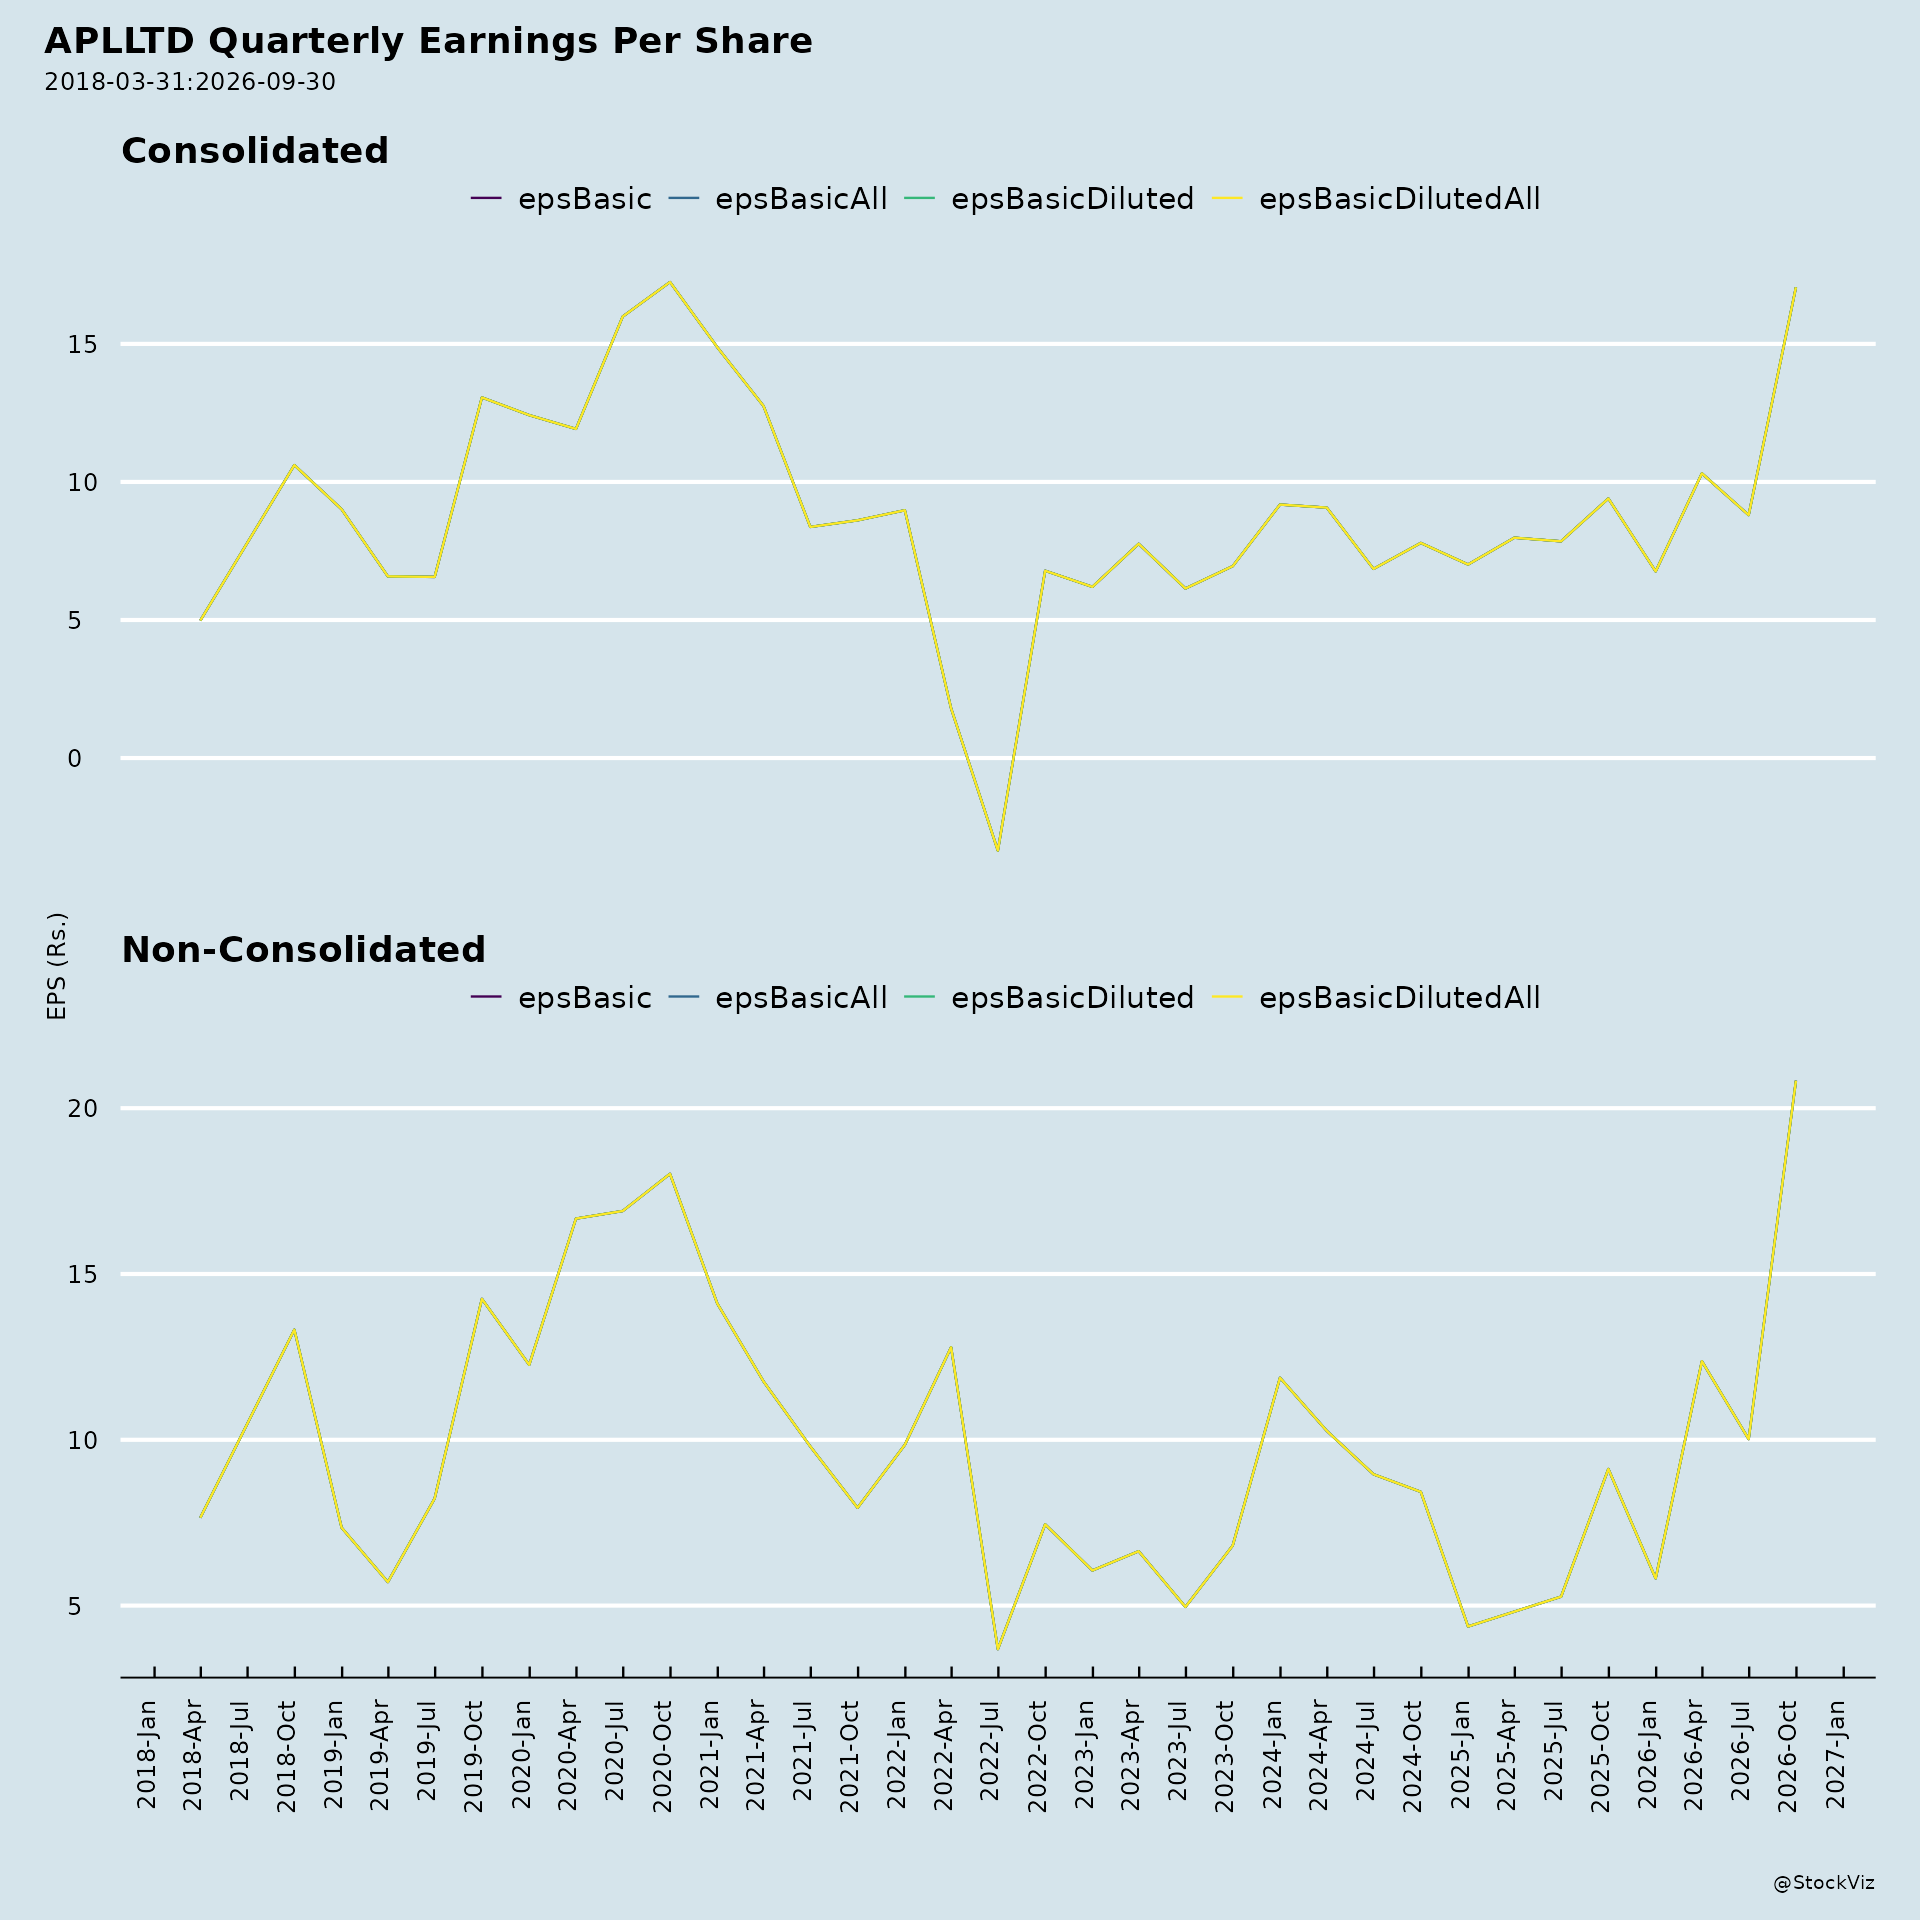
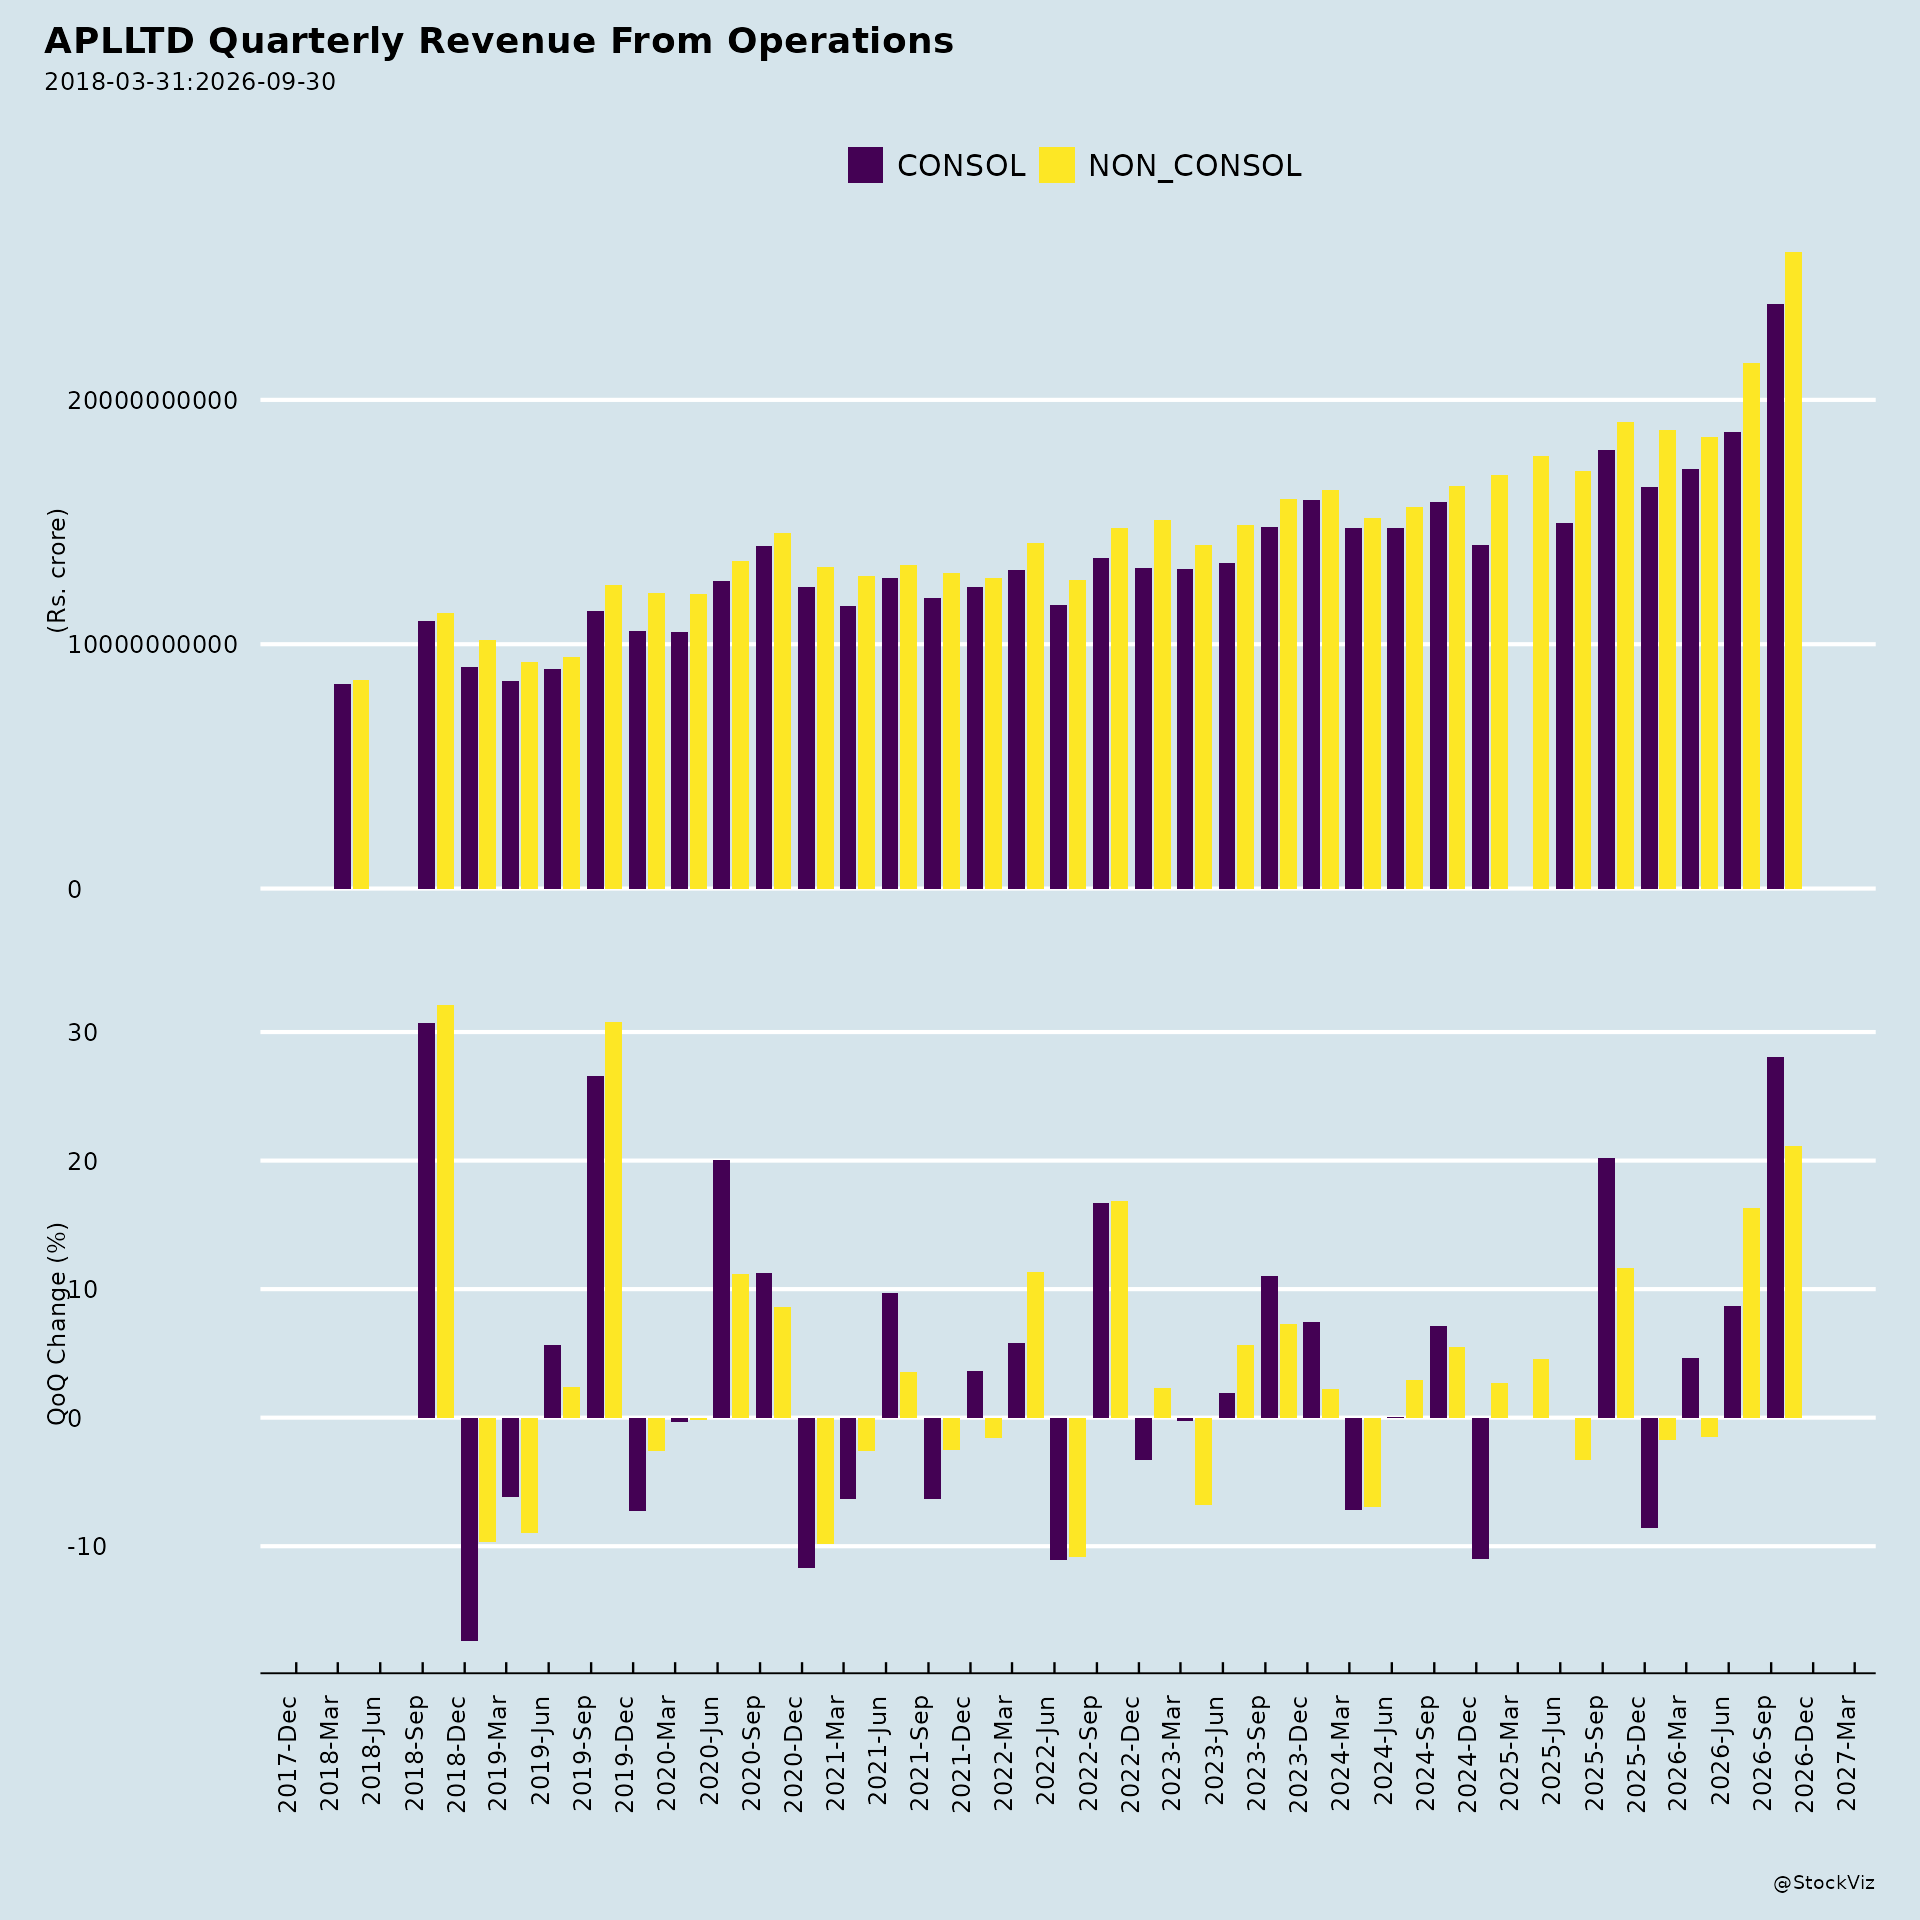
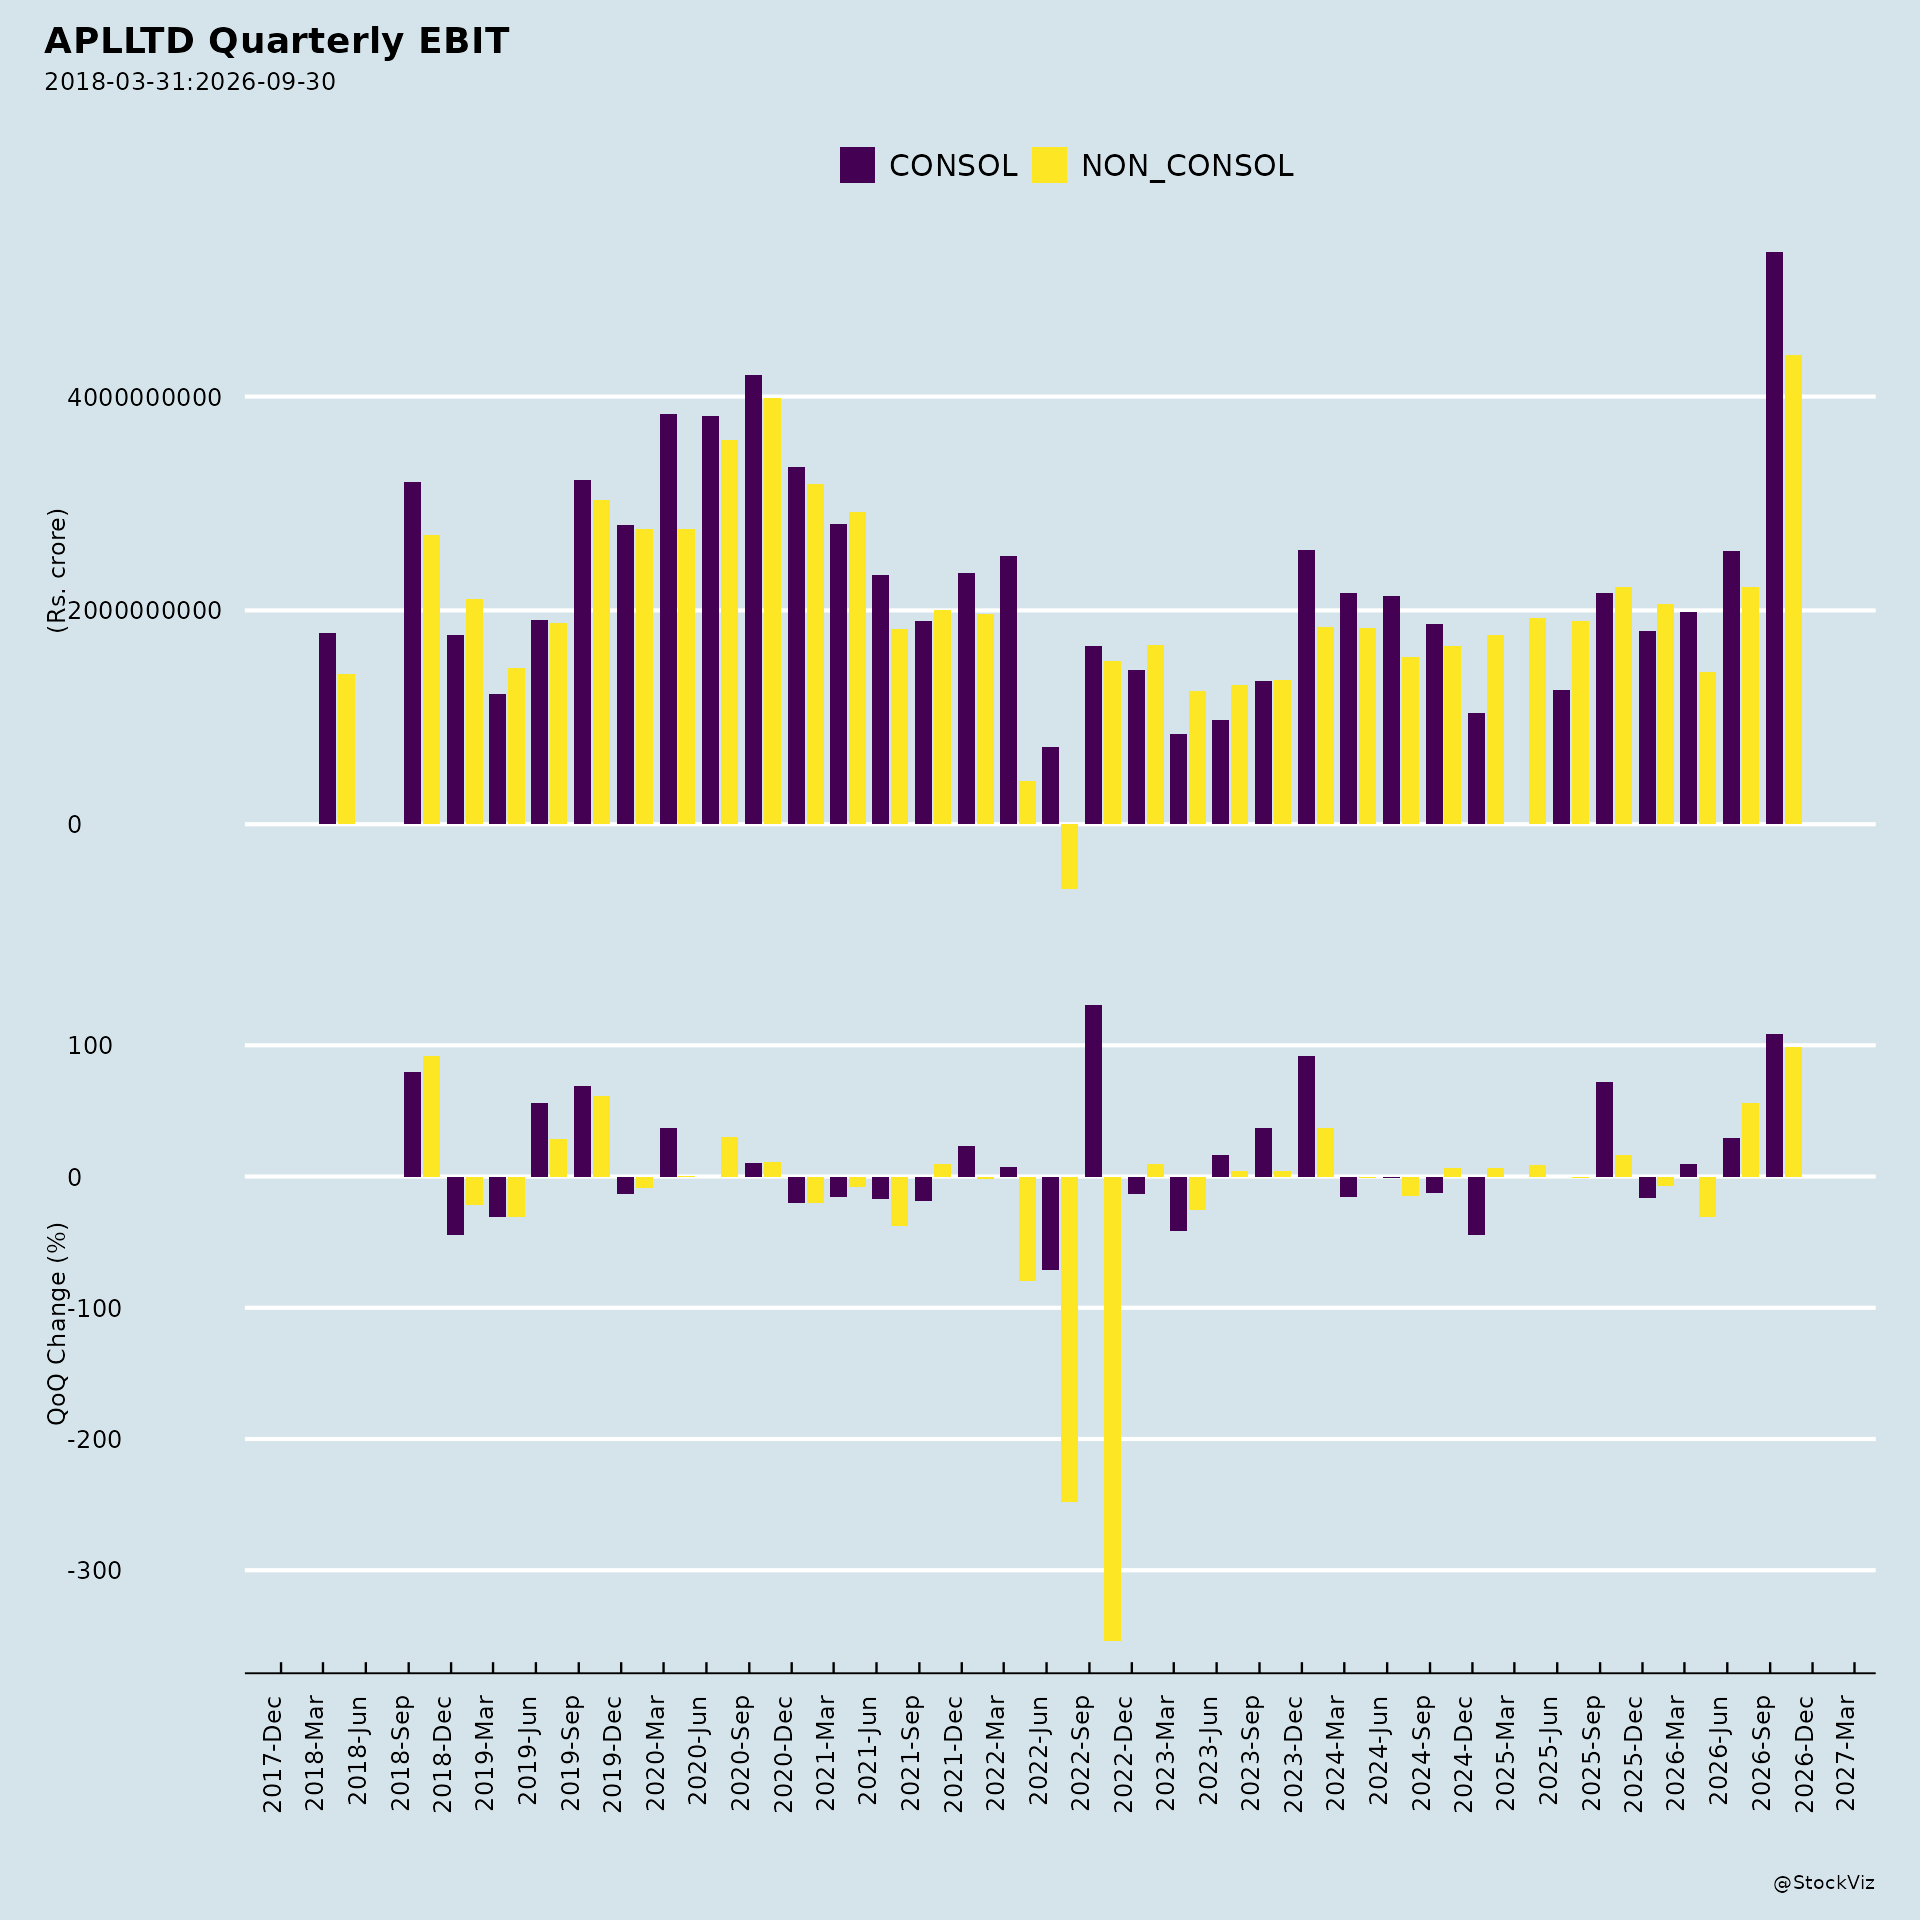
Fundamentals
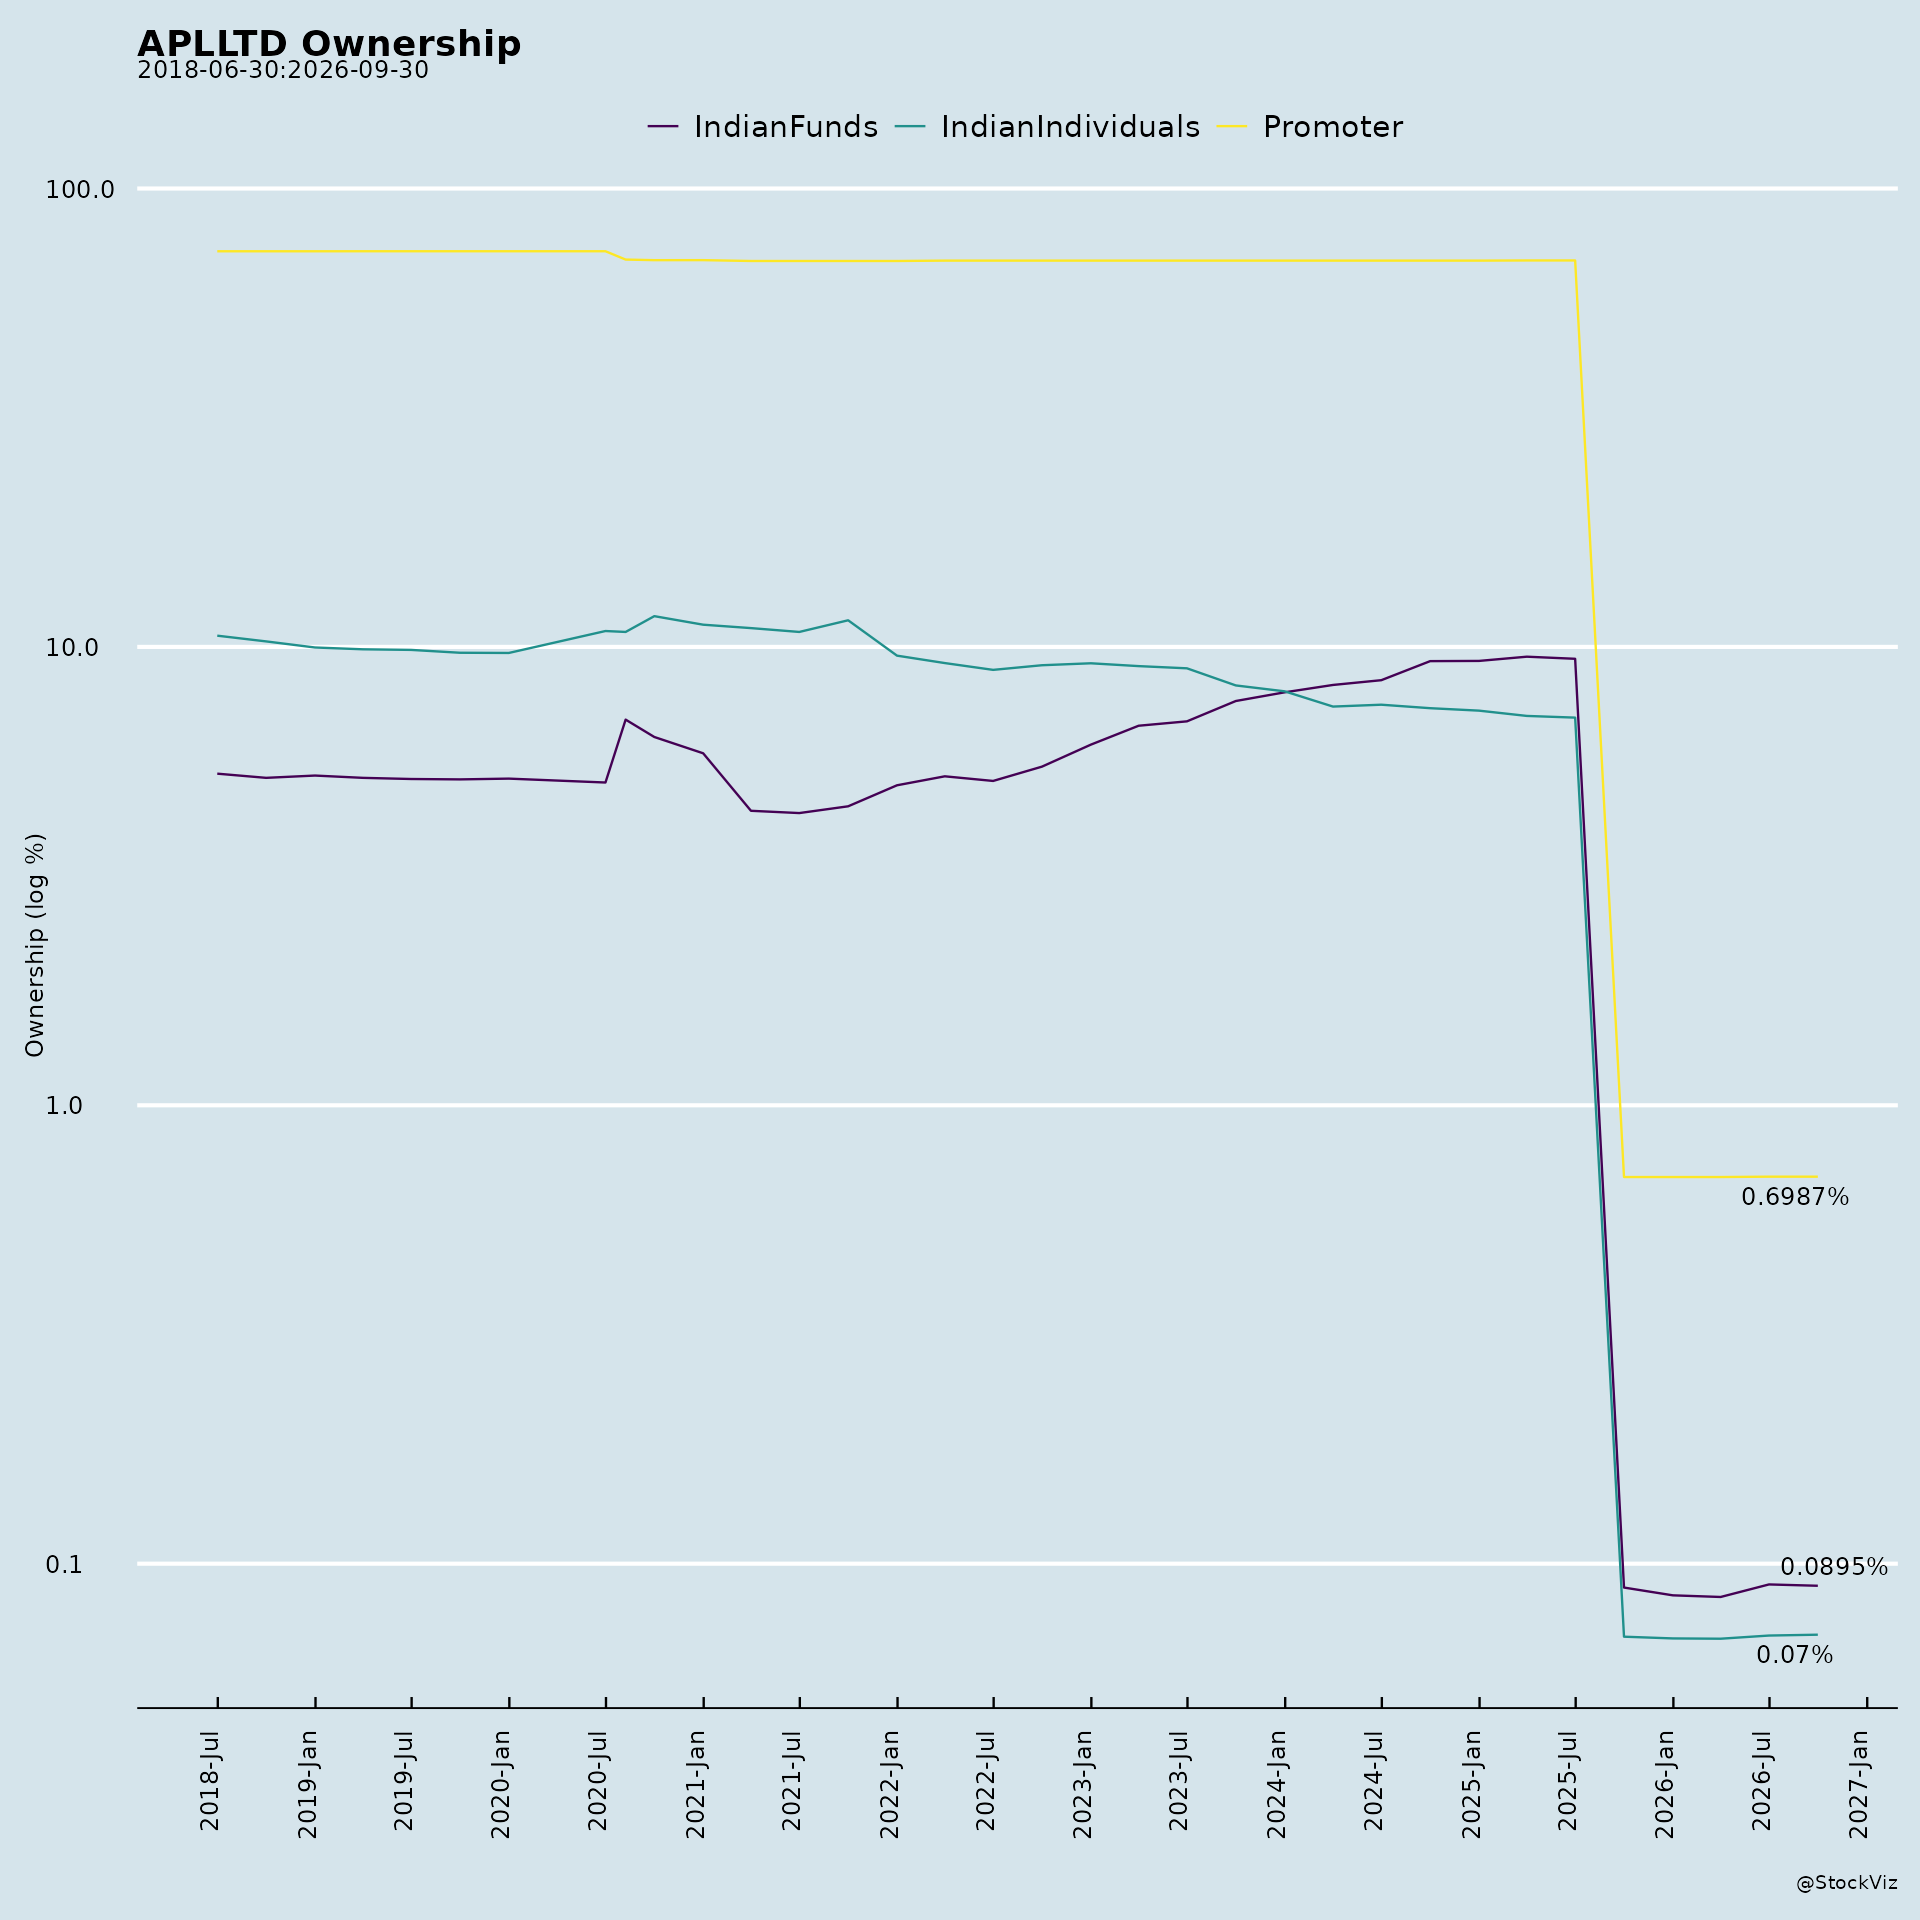
Ownership
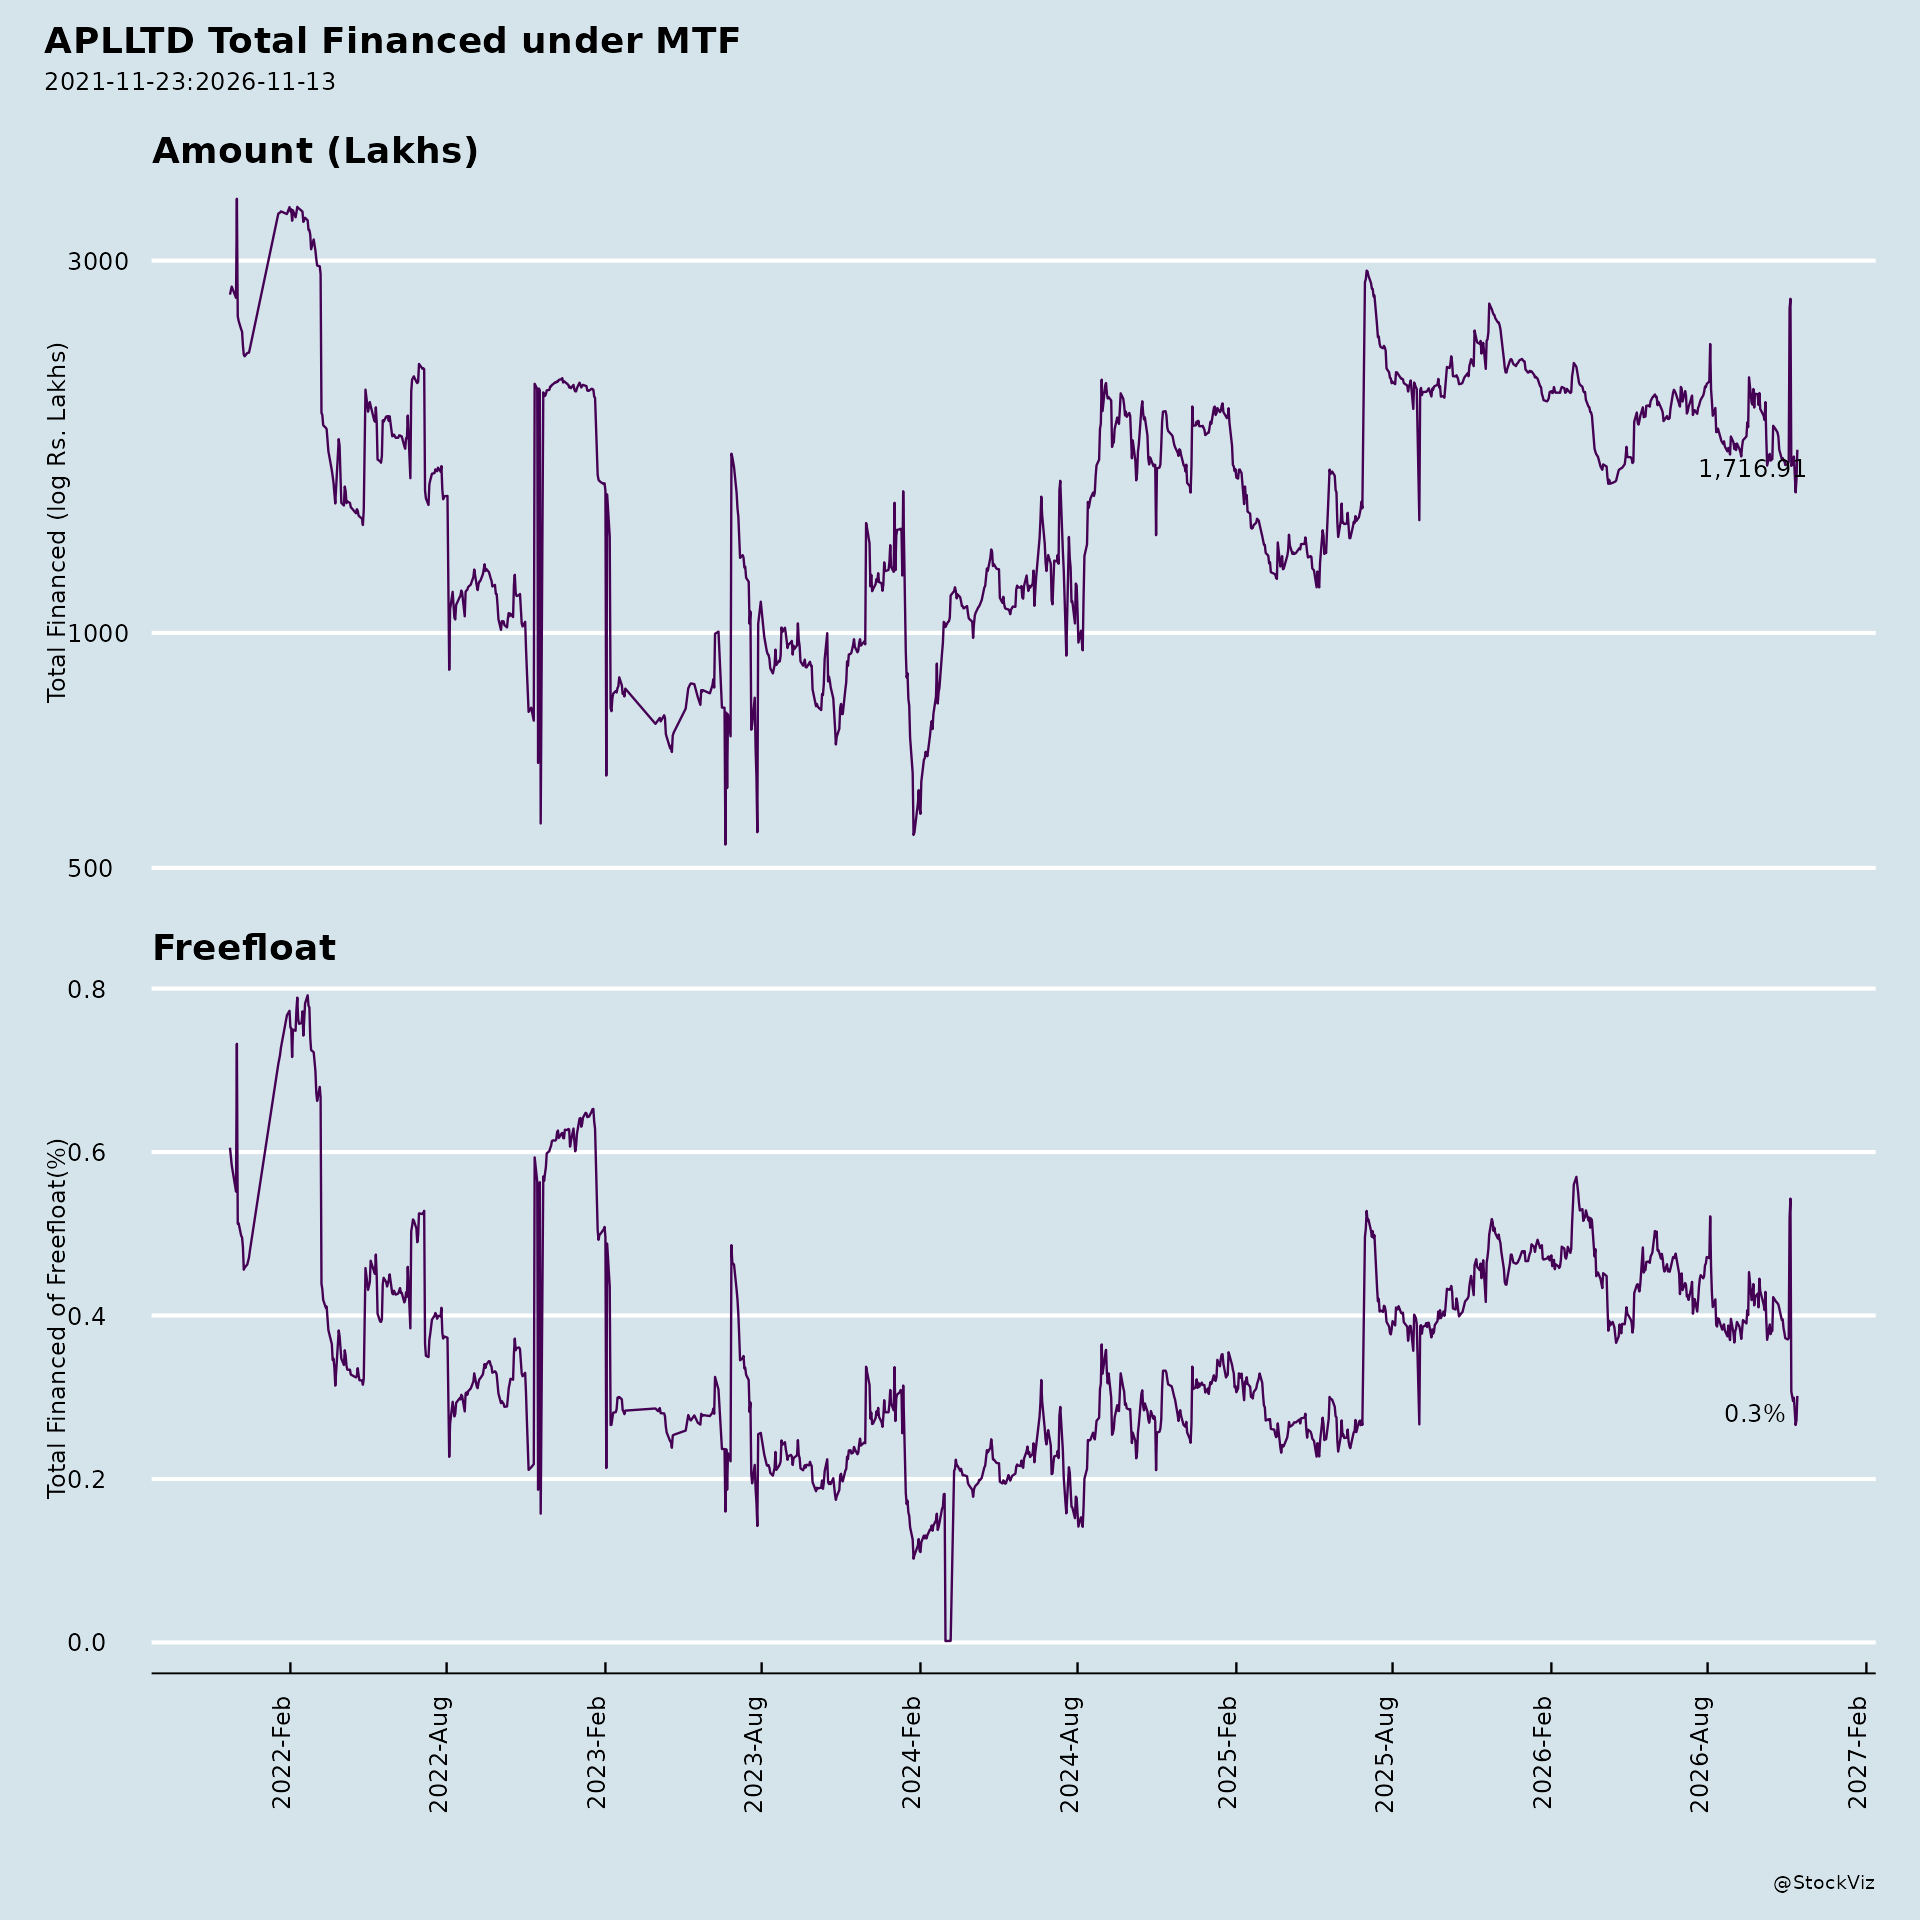
Margined
AI Summary
asof: 2026-09-16
Alembic Pharmaceuticals (APLLTD) — Recent Developments Summary
1. Headwinds and Challenges
- Employee benefit obligations arose from the revised definition of wages under the Labour Codes, weighing on costs.
- A write-down on assets of the Sikkim manufacturing facility was recognised, with the facility classified as held for sale under Ind AS 105.
- Material consumption rose sharply — up 52% YoY and 17% QoQ in Q1 FY27 — alongside a gross margin decline to 71% from 76% a year earlier.
- Profit growth lagged revenue growth: while revenue rose 26% YoY, PAT grew only 12% YoY, and PAT declined 15% QoQ.
- India Branded Business growth was modest at 7% YoY, with a longer-term revenue CAGR of just 6%, and the company holds only a 1.1% share of the Indian pharma market.
- R&D spend is rising (9% of revenue in Q1 FY27, up 29% YoY), reflecting planned strategic expansion in the US branded business and a peptide-focused pipeline, which pressures near-term margins.
- The investor presentation’s safe harbour statement flags inherent risks including regulatory approvals, product safety and efficacy concerns, healthcare reforms, currency and interest rate fluctuations, raw material availability, and market acceptance.
- Governance-related dissent appeared at the AGM: the resolution to appoint Mr. Sujit Jaysukh Bhayani as an Independent Director (Item 4) saw 34.85% of public institution votes against, and 6.92% of total votes polled against — the only resolution with meaningful opposition. The director re-appointment resolution (Item 3) also drew 0.28% votes against.
2. Tailwinds and Growth Prospects
- Q1 FY27 was a strong quarter: revenue from operations rose 26% YoY to Rs. 2,150 Cr; EBITDA pre-R&D rose 21% YoY to Rs. 523 Cr (24% margin); PAT was Rs. 173 Cr, up 12% YoY.
- US Formulation grew 49% YoY to Rs. 778 Cr, driven by key product launches and volumes, with 7 launches in the quarter and 10 ANDA approvals (including 2 tentative).
- Ex-US Generics grew 17% YoY to Rs. 383 Cr, with partnerships in Europe, Canada, Australia, Brazil, Chile and South Africa, plus a JV in Canada and new subsidiaries in Thailand, the Philippines and Germany.
- API business grew 33% YoY to Rs. 346 Cr on strong order book and demand; 3 US DMFs filed in Q1 FY27, taking cumulative filings to 152.
- India Branded Business reached Rs. 642 Cr, with robust growth in Gynaecology, Gastrology and Ophthalmology; 3 new products launched; Animal Health grew 24% (23% in the quarter) with a 22% CAGR.
- Pipeline visibility: 15+ US product launches expected in FY27; 279 cumulative ANDA filings, 244 approvals and 185 products launched; Pivya soft launch completed with encouraging response, plus Nuvessa addition.
- Regulatory clearances: F3 Karkhadi received its EIR on 13 May 2026 (certification April 2026); the Vadodara bioequivalence facility cleared an unannounced USFDA inspection (31 Aug–10 Sep 2026) with no Form 483 observations.
- Sustainability positioning: one of 10 Indian pharma companies with SBTi-approved targets; net zero by 2050, water neutrality by 2027, 24 MW solar park commissioned.
- Consistent dividend payout and ongoing investor engagement (one-to-one meetings with Dolat Capital, Equirus, 360 ONE, ICICI Securities, Ashmore, HSBC, BOB Capital, Nirmal Bang and Yes Securities on 1–2 September 2026).
3. Key Risks
- Regulatory and inspection risk across USFDA- and WHO-approved facilities, though recent audits (F3 EIR, Vadodara BE inspection) were clean.
- Product concentration and competitive pressure in the US generics portfolio, with pipeline dependent on timely approvals and launches.
- Margin pressure from rising material costs, R&D intensity, and expansion into US branded business.
- Execution risk in newer markets (Canada JV, Thailand, Philippines, Germany) and in the peptide/specialty pipeline.
- Macro and currency exposure across international operations, as flagged in the safe harbour statement.
- One-off cost items such as Labour Code wage revisions and the Sikkim facility write-down.
- Shareholder dissent risk evidenced by the significant minority vote against the Independent Director appointment.
4. Management Guidance vs. Observed Performance
- Management stated FY27 began “on a strong note” with broad-based growth driven by volume growth, new product launches and execution across key markets, and reaffirmed focus on strengthening the portfolio, advancing the pipeline and delivering sustainable long-term growth.
- Observed performance supports the growth narrative: 26% revenue growth, 49% US growth, 33% API growth and 17% Ex-US growth all materialised in Q1 FY27.
- However, profitability trailed the headline: PAT grew 12% against 26% revenue growth, and EBITDA pre-R&D margin of 24% reflects the cost pressures noted above.
- Forward-looking pipeline commitments — 15+ US launches expected in FY27 — are partially evidenced by 7 launches and 10 approvals already achieved in Q1 FY27.
- The company guided to continued investment in R&D (peptide development, increased filings) and US branded expansion; R&D at 9% of revenue and up 29% YoY is consistent with that stated intent.
- No specific numerical guidance for full-year FY27 revenue, margin or PAT appears in the supplied material; the earnings call on 4 August 2026 was scheduled for management to discuss performance and take questions.
Broker Narrative
Early reports framed APLLTD as a US-generics laggard, with price erosion, high base, product-mix pressure, and rising opex as key headwinds, while domestic, ex-US, API, and specialty growth were the offsets. By the last report, the US business had become a positive surprise (US generics +49% YoY, limited-competition launches), but persistent gross margin contraction, higher depreciation/amortization, domestic acute weakness, and debt kept the call at Neutral with limited upside. The narrative shifted from US demand concerns to margin/cost absorption and India branded performance, while operating leverage improved.
Fears that came true
- The early fear of inferior product mix leading to YoY gross margin contraction materialized: the last report showed gross margin down 500bp YoY to 71.2%, and this margin pressure accompanied multiple negative actual returns/DISAPPOINTMENT outcomes (e.g., Aug-2024 Buy +11.0% predicted vs -19.4% actual).
- The early fear of incremental operating expenses from new facilities/businesses materialized as higher depreciation and tax rates, with ~70-75% of depreciation increase from amortizing intangibles for the US branded business, offsetting improved US traction and weighing on returns (e.g., 2025-08-05 Neutral +4.5% predicted vs -12.3% actual).
Optimism that failed
- The expectation of sustained domestic formulations growth (9% YoY and 10-12% FY24 guidance) did not hold: by 1QFY27 the domestic acute segment declined 2.1% YoY and remained a drag on the India branded business.
- The management guidance of ~15% EBITDA margin for FY24 did not materialize as a durable margin improvement; management later reiterated FY27 EBITDA margin dilution of ~150bps alongside the 500bp gross margin contraction.
Broker Timeline
7 broker calls · 2023-05-07 to 2026-01-05
CNBC-TV18: ratings, targets and commentary
No recorded CNBC-TV18 statements for this ticker.
Management comments
No recorded management comments with an explicit designation and affiliation for this ticker.
Copyright © 2023 SAS Data Analytics Pvt. Ltd. All rights reserved.