ANGELONE
Equity Metrics
September 24, 2026
Angel One Limited
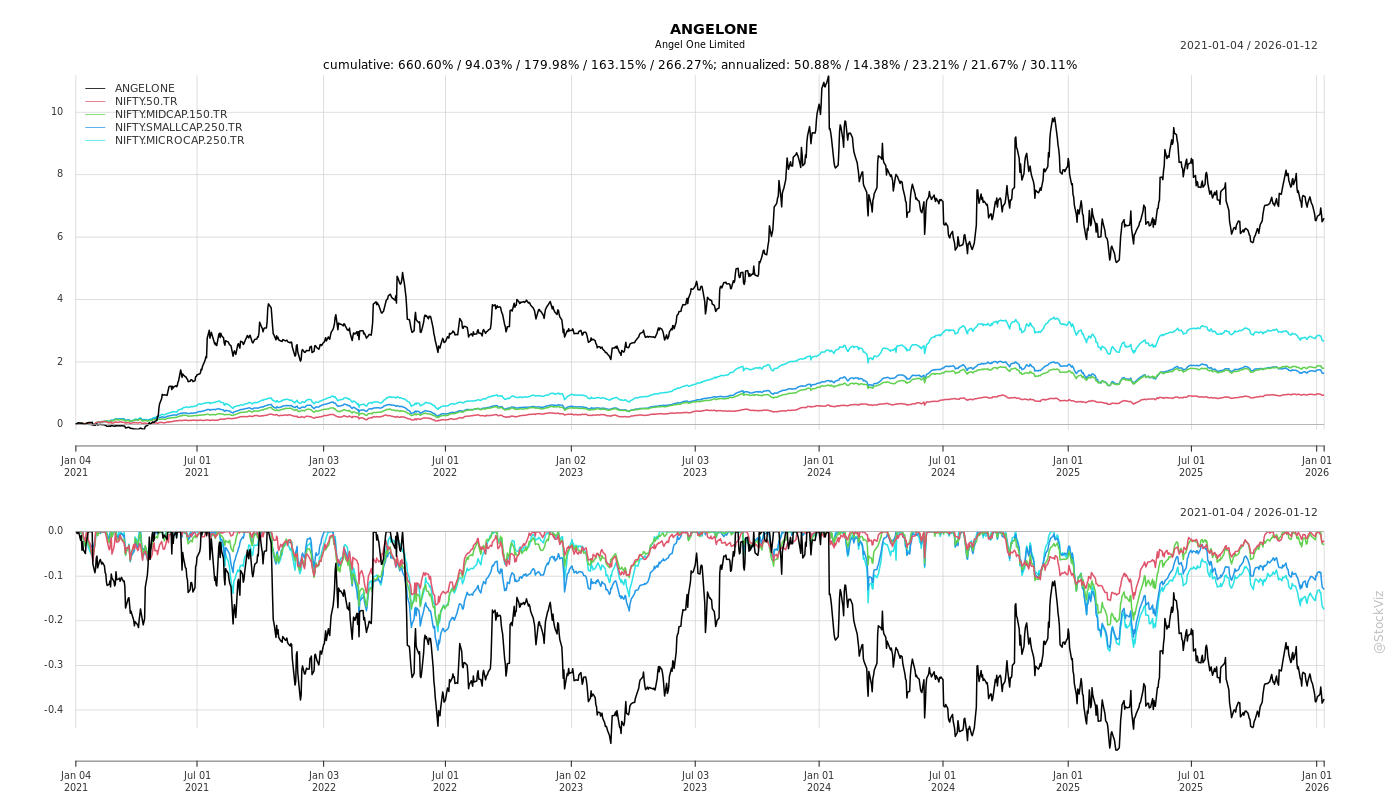
Annual Returns


Cumulative Returns and Drawdowns
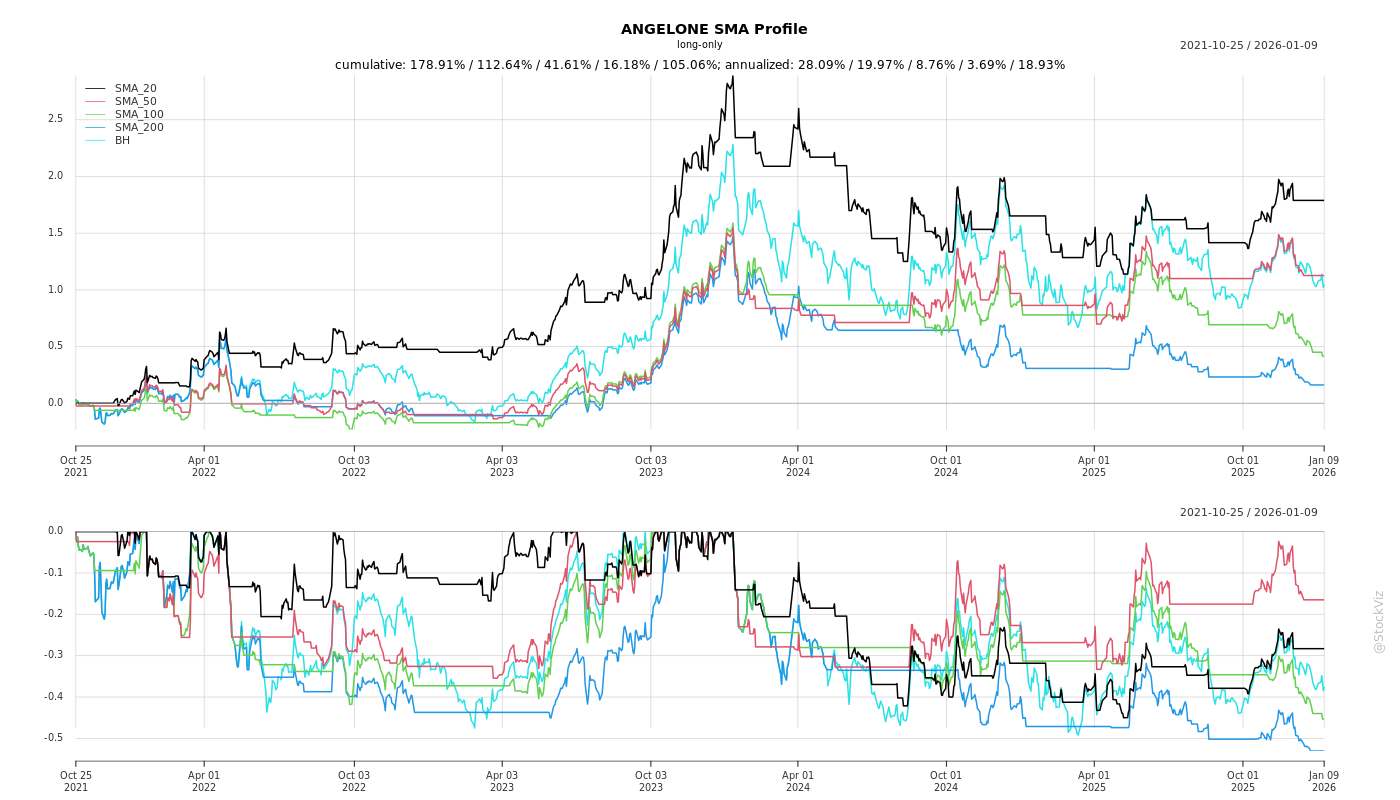
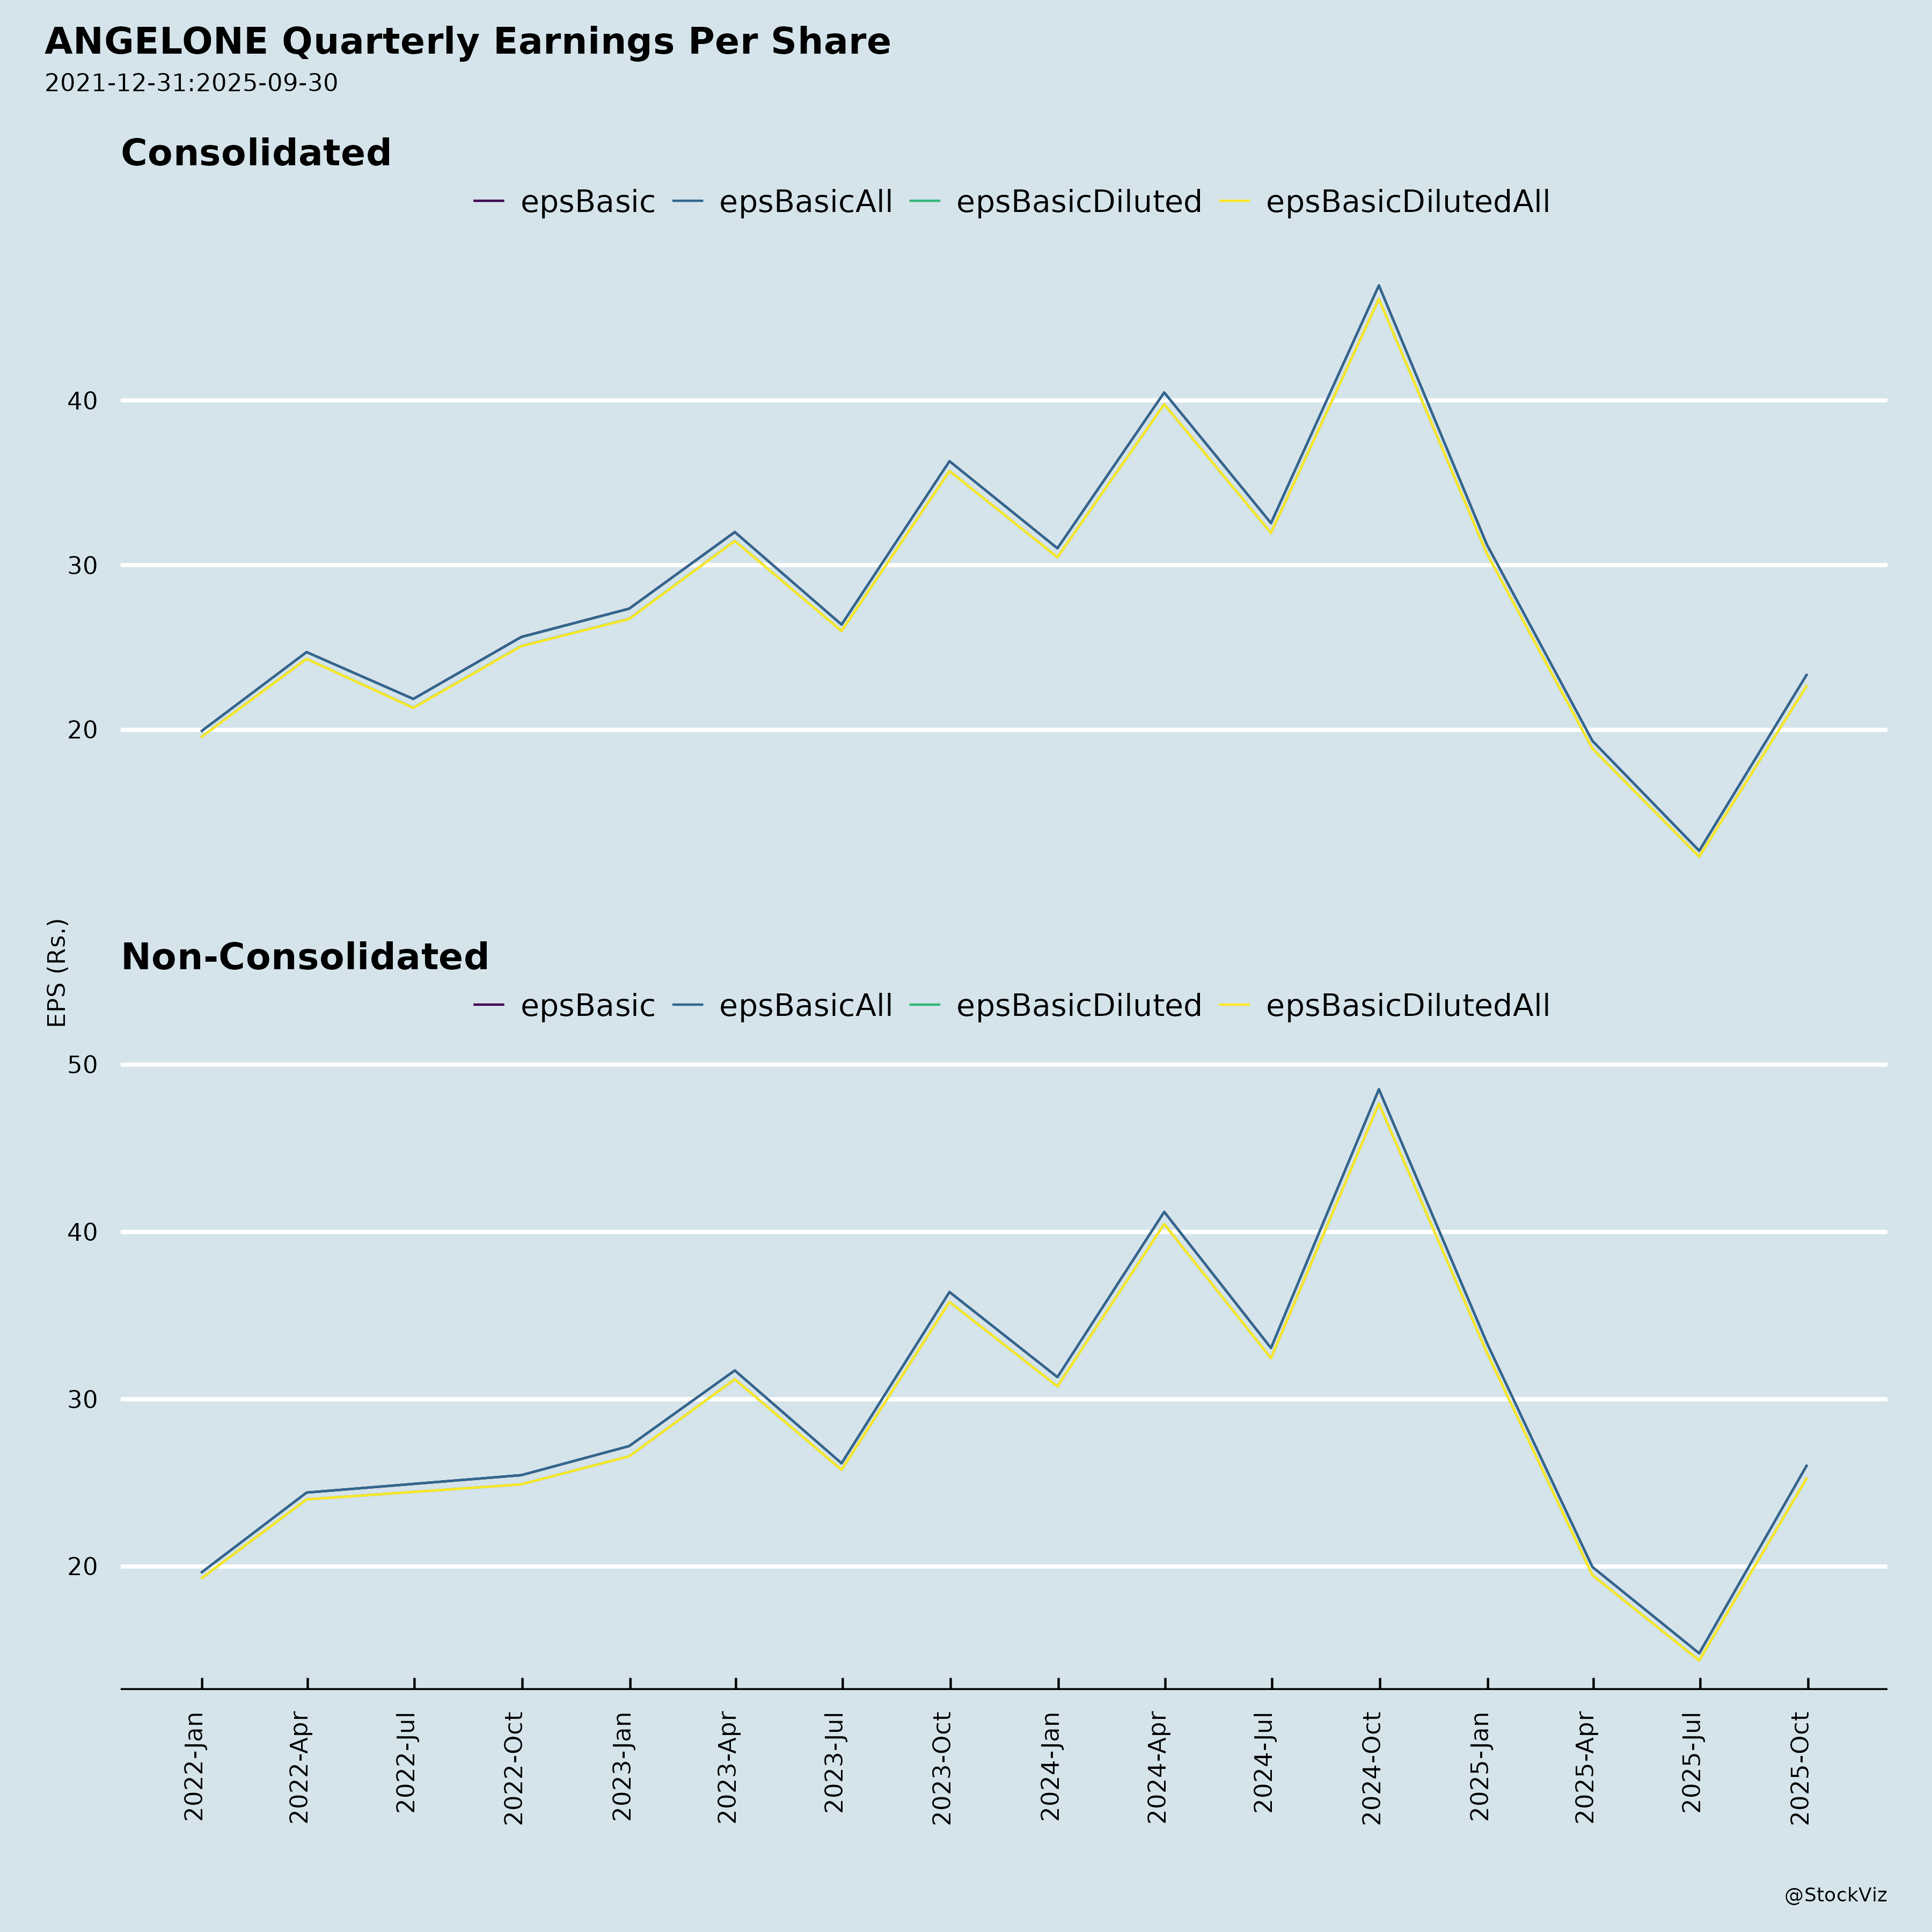
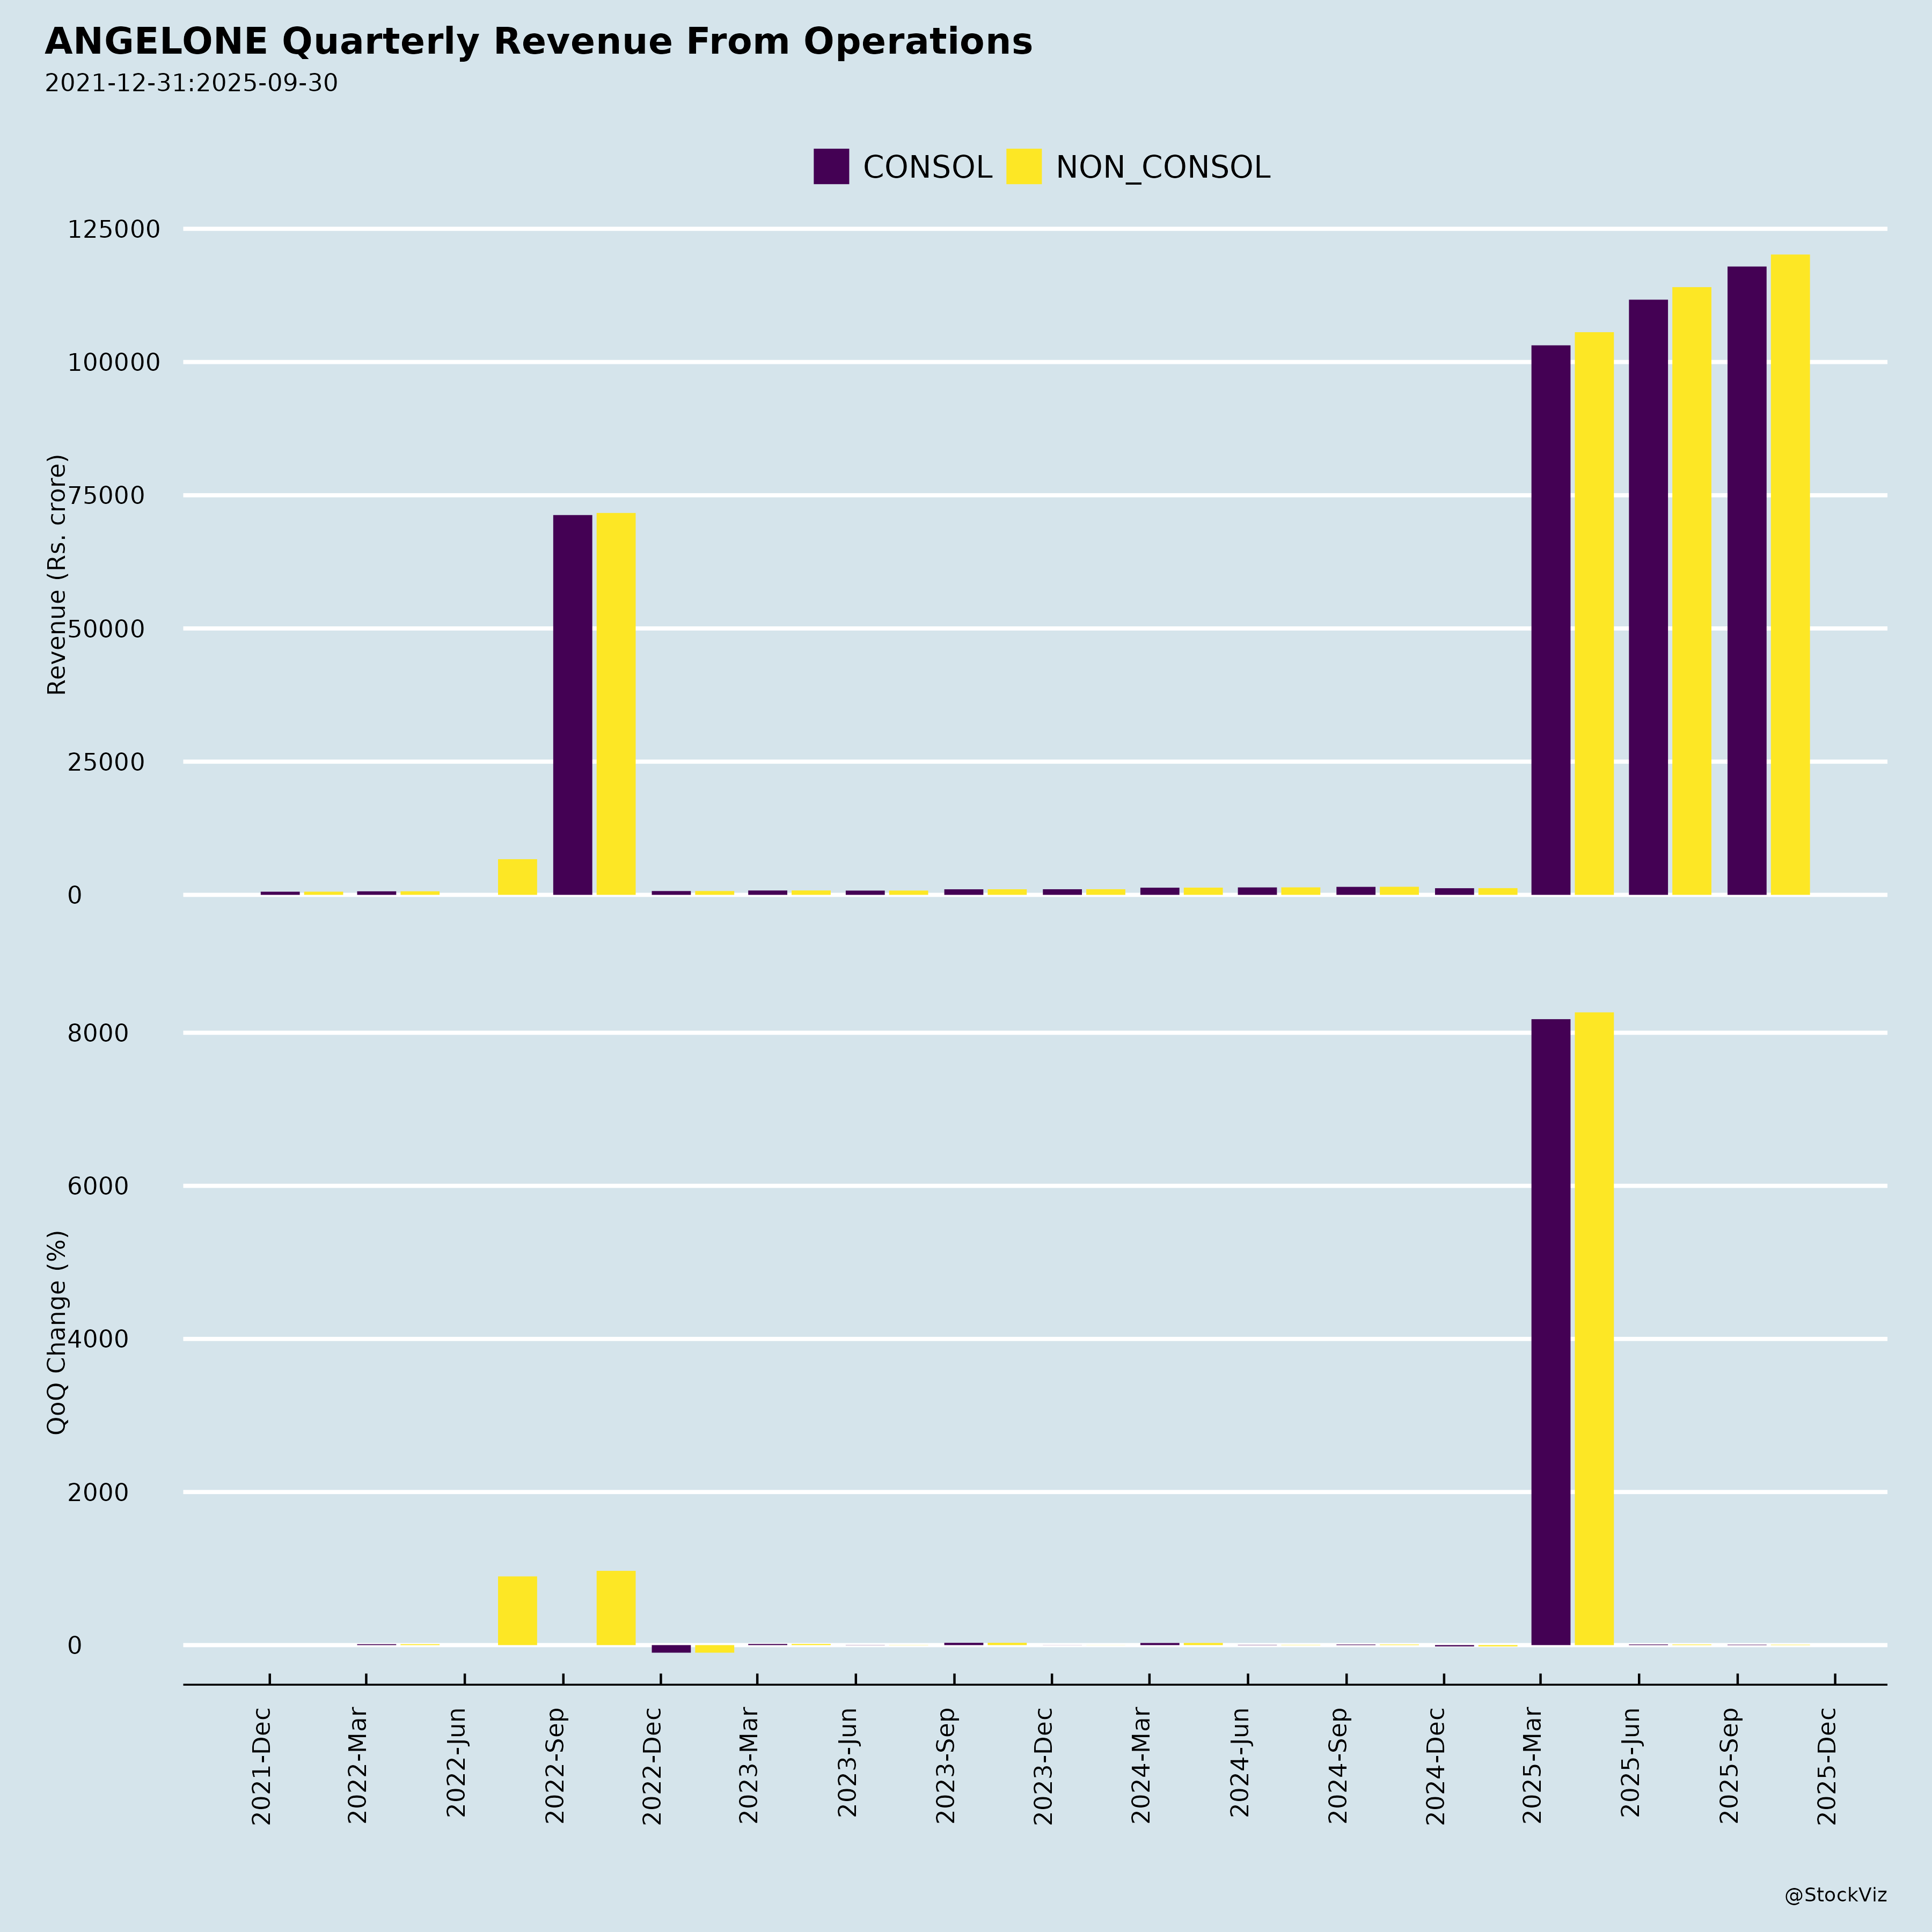
Fundamentals
Ownership

Margined
AI Summary
asof: 2026-09-16
Angel One: Headwinds, Tailwinds, Risks and Guidance vs Performance
1. Headwinds and Challenges
- Regulatory and structural changes in the broking mix. The investor presentation states that “Changes like True to Label, F&O regulations and softer macro impacted revenues in FY26.” This is visible in the FY26 consolidated numbers: total income declined 1.8% year-on-year to ₹51,522 Mn and reported PAT fell 21.9% to ₹9,151 Mn.
- Moderation in trading activity. In Q1 FY27, total orders fell 5.7% quarter-on-quarter to 406 Mn, with F&O orders down to 300 Mn from 320 Mn in Q4 FY26. Overall retail equity turnover market share slipped 17 bps QoQ to 20.2%. The August 2026 monthly update notes that “average daily orders and turnover market share moderated during the month.”
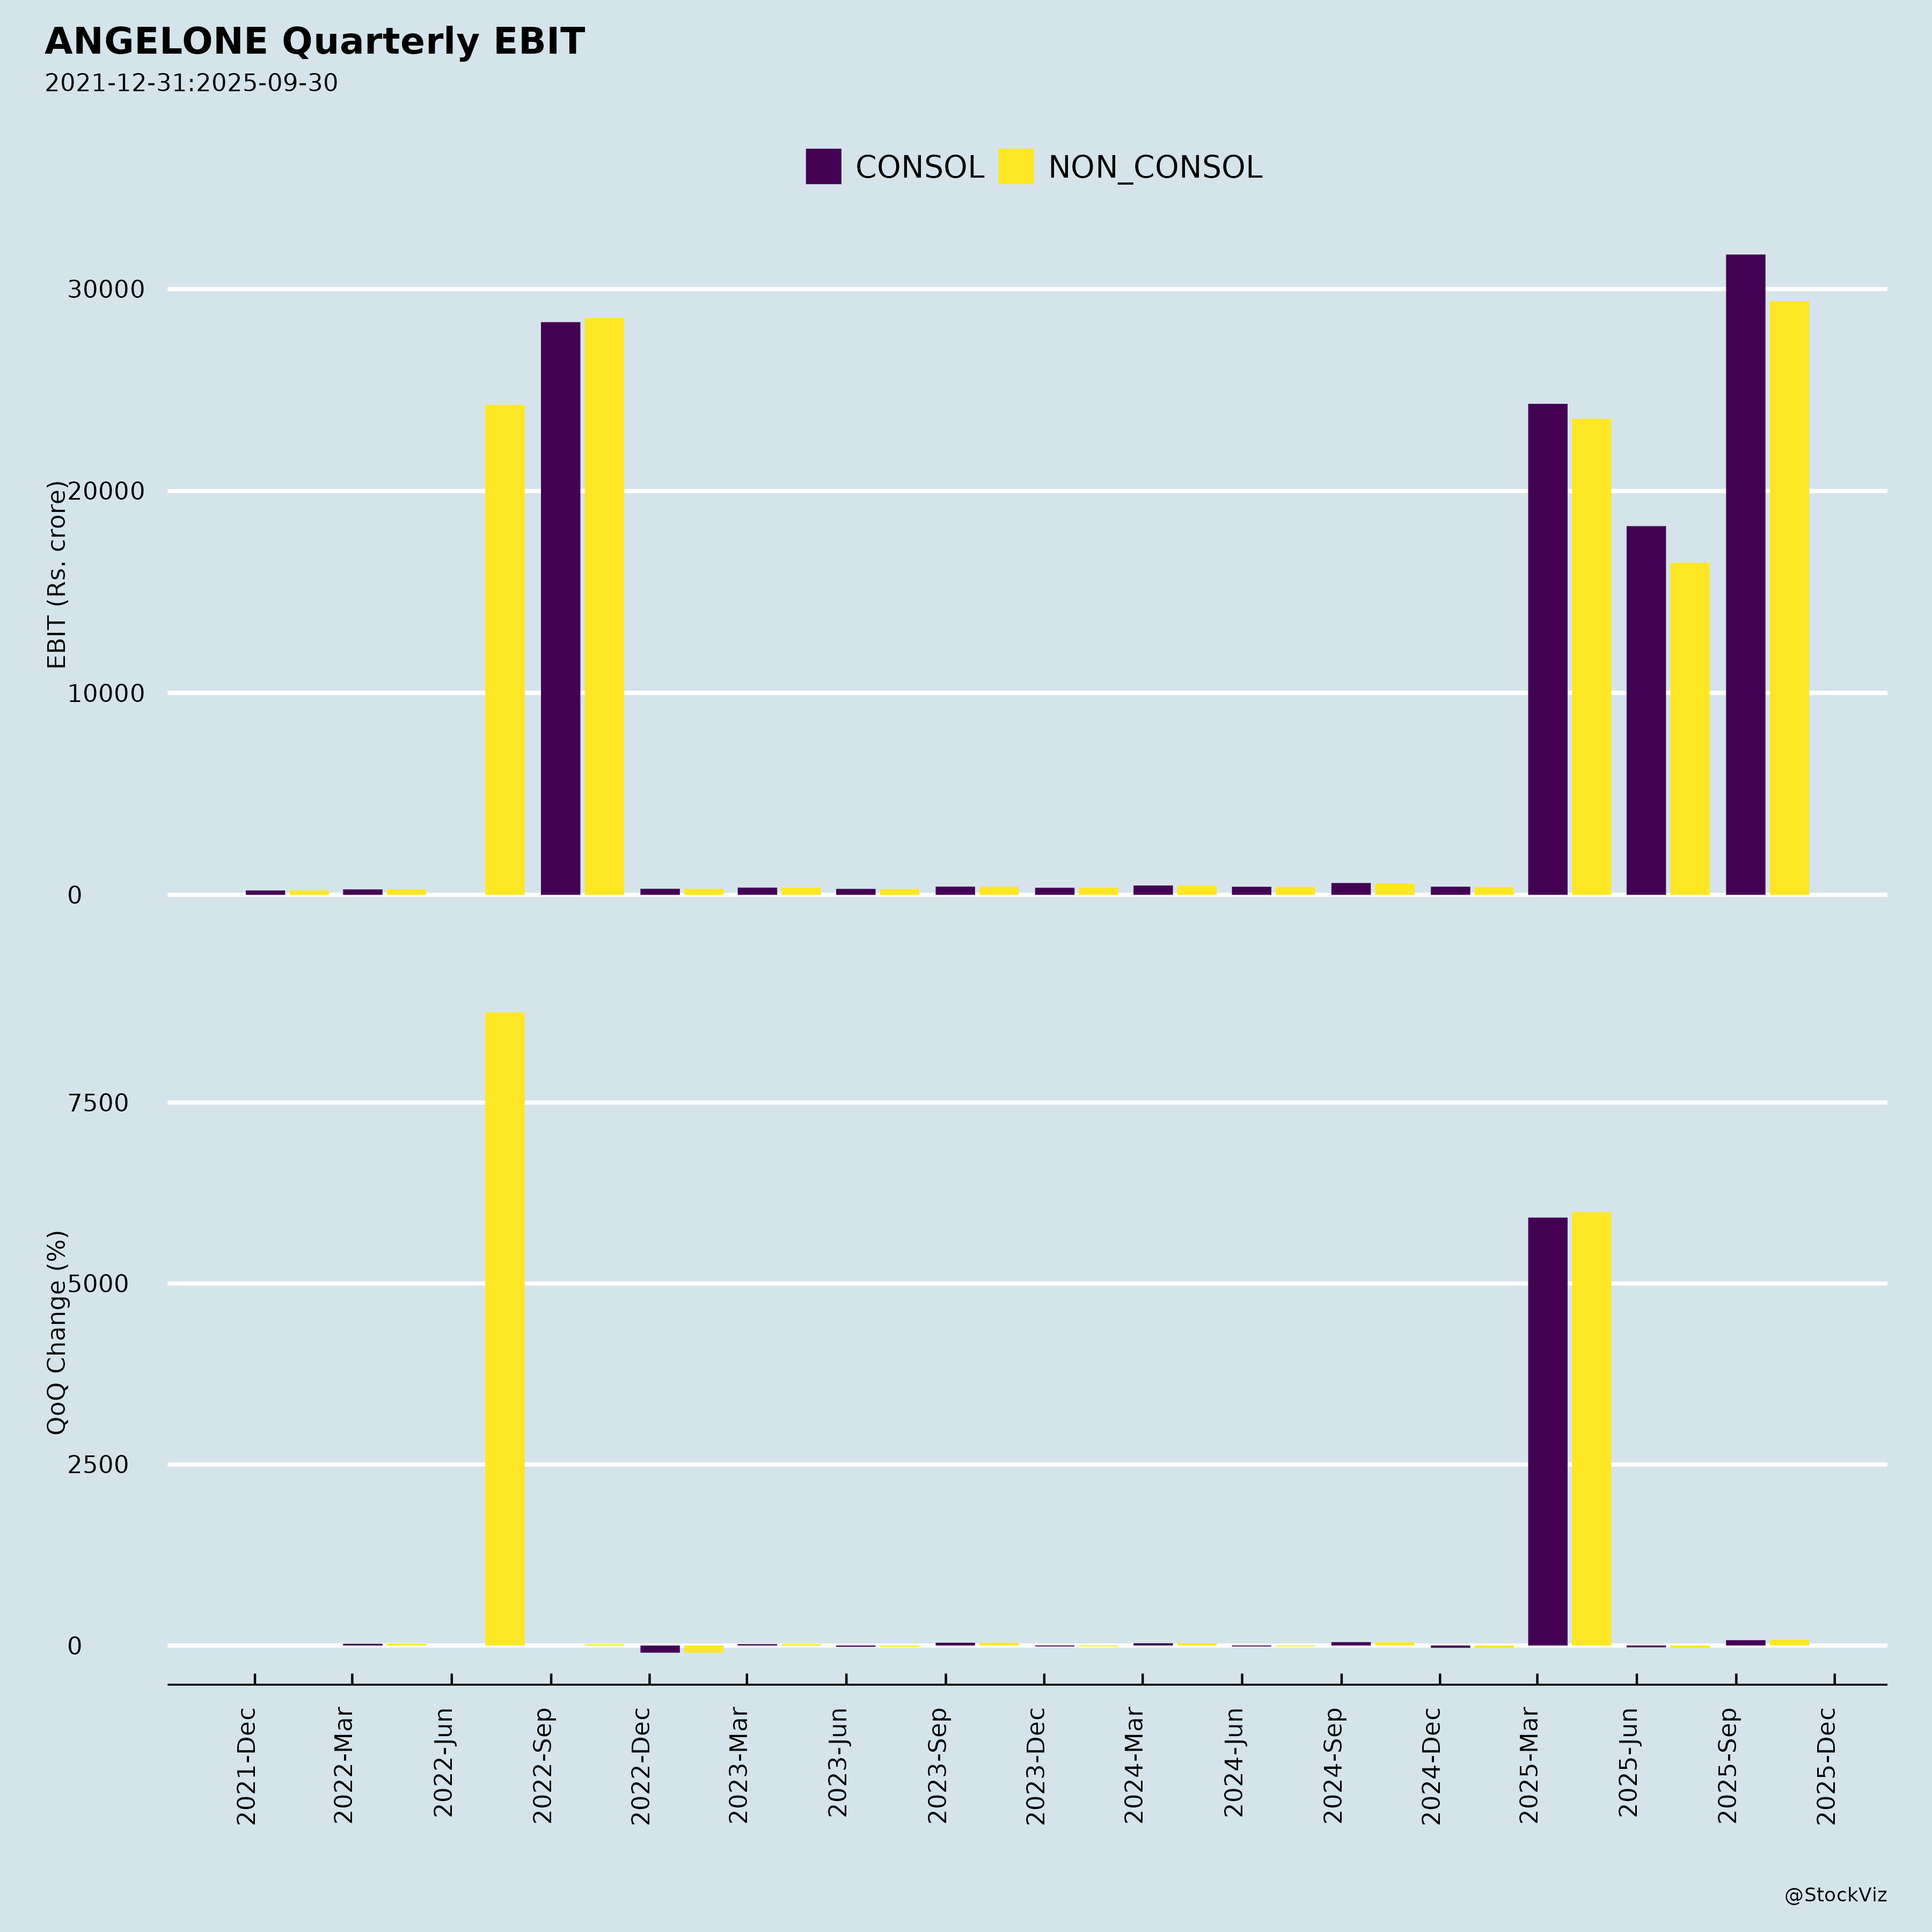
- Revenue softness in the most recent quarter. Consolidated total income of ₹14,337 Mn in Q1 FY27 was down 2.3% QoQ, and reported EBDAT of ₹3,597 Mn was down 23.9% QoQ. The EBDAT bridge attributes this to “decrease in revenues as user activity moderated.”
- Cost pressures. Q1 FY27 saw higher employee cost from annual increments and proportionate variable pay provisioning for FY27, plus higher ESOP expense from fresh grants issued during the quarter. Other expenses also included IPL-related spend.
- SIP registrations declining year-on-year. Unique SIPs registered in Q1 FY27 stood at 1.7 Mn, lower by 10.3% YoY (though up 18.8% QoQ).
- Credit distribution sequential decline. Credit distributed in Q1 FY27 was ₹5.3 Bn, down 12.2% QoQ even as it grew 129.7% YoY.
2. Tailwinds and Growth Prospects
- Large under-penetrated opportunity. Equity penetration is 3.1% of the total population; equity plus mutual funds are 15.1% of household gross financial assets (FY25). India’s wealth management industry is projected to grow at a 25–30% CAGR over 10 years.
- Digital infrastructure and demographics. Smartphone penetration is 76% rural and 86% urban; data cost fell from ₹308/GB (Mar’14) to ₹8 (Mar’26); internet connections rose from 252 Mn (Mar’14) to 1,029 Mn (Dec’25). Median age is ~29 years.
- User base scale and quality. 38.6 Mn total users, 1.3 Mn gross acquisitions in Q1 FY27 (up 26.7% QoQ), 16.7% share of India’s demat accounts, and ₹1.7 Trn assets under custody. About 90% of new users come from Tier 2, 3 and beyond, and 45%+ of acquisitions are under age 25.
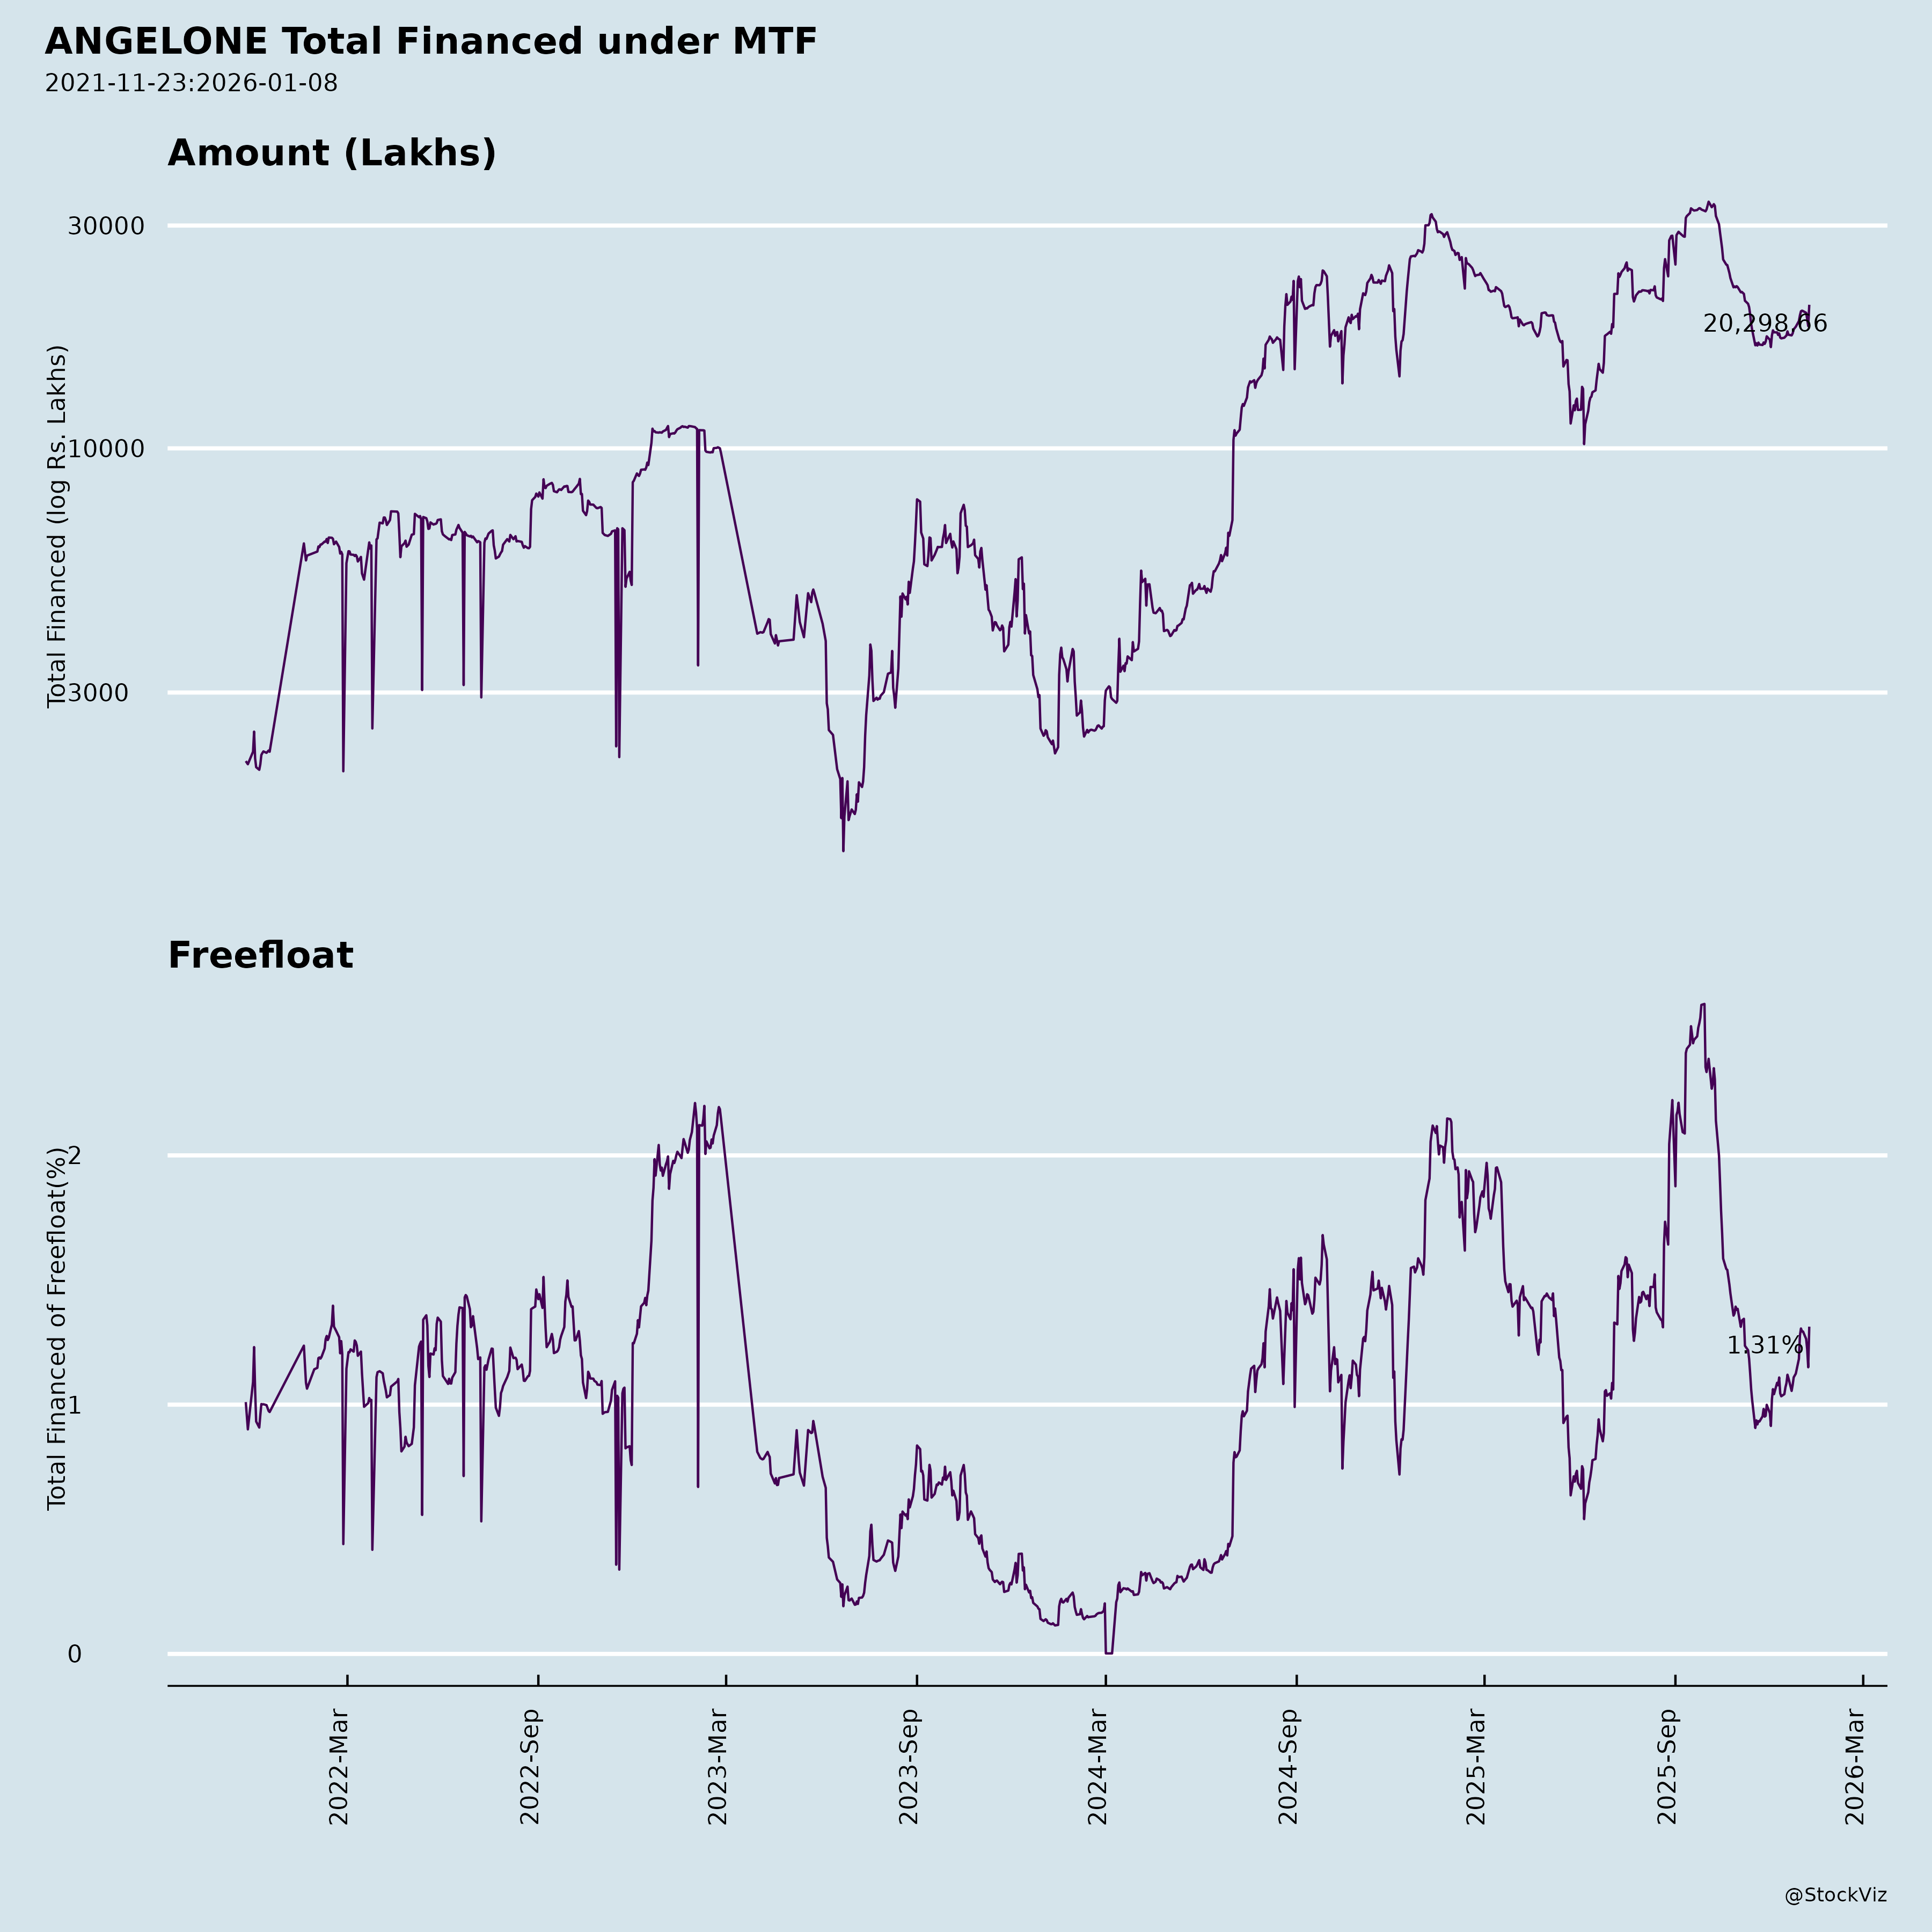
- Client funding book as a growth pillar. Average client funding book reached a record ₹61.4 Bn in Q1 FY27, up 45.9% YoY and 4.9% QoQ; period-ending book was ₹71.5 Bn. 83% of exposure is under ₹0.1 Mn and 85% of the book is less than 30 days old.
- Mutual fund distribution momentum. #2 position in India’s incremental SIPs; ~3.6 Mn MF ever users, with >70% having more than one SIP and ~39% of MF ever users activated by MF.
- Wealth management scaling. AUM of ₹134.4 Bn, up 33.3% QoQ and 165.3% YoY, with 2,400+ clients; UHNI families grew from 80 (Mar’25) to 170 (Mar’26) to 263 (Jun’26).
- Asset management annuity. AMC AUM of ₹6.2 Bn as of 30 June 2026, up 70.6% QoQ and 81.4% YoY, across 255+ k folios and 17.7 k pincodes.
- Credit distribution opportunity. Loans taken by Angel One users from the market exceed ₹1,000 Bn (FY26), against ₹32.4 Bn lifetime credit distributed — indicating significant headroom. 151+ k users have ever taken credit.
- AI-led efficiency. Ask Angel has 1.1+ Mn users; KYC face match at >99% accuracy; STP rejection rate cut from 3.2% to 0.5%; 33% of emails and 17% of tickets closed per month via automation; >75% of code enabled by AI for engineers using AI tools.
- August 2026 monthly trends. Client base rose to 39.56 Mn, gross client acquisition was 0.57 Mn, average client funding book hit an all-time high of ₹74.21 Bn, with 109.50 Mn total orders and 5.21 Mn average daily orders.
3. Key Risks
- Regulatory risk. The presentation explicitly cites True to Label and F&O regulations as revenue-impacting. The compliance section notes SEBI CSCRF alignment, DPDPA-aligned privacy governance, and guardrails on social media and non-approved communication channels.
- Market and macro risk. The safe harbour section lists risks including performance of the Indian and international economies, broking industry performance, competition, strategy implementation, growth and expansion levels, technological changes, revenue/income/cash flow changes, market preferences and market risk exposure.
- Activity-linked revenue concentration. Gross broking contributed 60% of total gross revenues in Q1 FY27, with F&O the largest component at 45% of gross income split. A decline in trading activity directly pressures revenue, as seen in Q1 FY27.
- Credit book risk. The client funding book is self-collateralized through users’ demat holdings, with 83% of exposure under ₹0.1 Mn and 85% aged under 30 days. Impairment on financial instruments was ₹6 Mn in Q1 FY27.
- Cost and margin volatility. EBDAT margin fell from 44.6% in Q4 FY26 to 36.6% in Q1 FY27 on a standalone basis; normalised EBDAT margin declined 81 bps QoQ to 43.6%.
- Execution risk in new businesses. Wealth, AMC, credit distribution and the announced JV with LivWell Holdings are earlier-stage and scale-dependent.
- Auditor transition. The term of current statutory auditors S. R. Batliboi & Co. LLP expires at the conclusion of the ensuing 31st AGM; Deloitte Haskins & Sells LLP is proposed for a five-year term from FY2027-28, subject to shareholder and regulatory approvals.
4. Management Guidance vs Observed Performance
- Management commentary (Q1 FY27). Chairman & MD Dinesh Thakkar stated the strategy is to build “India’s most trusted fintech, serving users across every stage of their financial journey,” with compounding of technology, data and user intelligence as a “defining competitive advantage,” and a focus on “long-term value creation rather than near-term monetisation.” Group CEO Ambarish Kenghe cited “multiple growth engines,” scaling AI across the platform, proprietary credit intelligence, and “durable, profitable growth over the long term.”
- Observed performance against this framing. Q1 FY27 consolidated gross revenues grew 25.4% YoY to ₹14,337 Mn, EBDAT grew 85.1% YoY to ₹3,597 Mn, and PAT grew 102.1% YoY to ₹2,314 Mn — but all three declined sequentially (revenues -2.3% QoQ, EBDAT -23.9% QoQ, PAT -27.7% QoQ). The sequential decline is attributed to moderated user activity and higher employee/ESOP costs.
- Multi-engine progress. Wealth AUM (+33.3% QoQ, +165.3% YoY), AMC AUM (+70.6% QoQ, +81.4% YoY) and credit distribution (+129.7% YoY) show the diversification thesis advancing, while credit distribution fell 12.2% QoQ and SIP registrations fell 10.3% YoY.
- Cohort economics. The presentation states mature cohorts create a “consistent and recurring revenue base,” with CAC incurred once and minimal cost to serve from year two onward. FY26 cohort revenue was impacted by True to Label, F&O regulations and softer macro.
- Forward-looking disclosure. The safe harbour states forward-looking statements are not guarantees of future performance and the company assumes no obligation to update them. The August 2026 monthly update states the company intends to provide updates on a monthly basis.
- Investor engagement. Management is scheduled to interact with investors/analysts at the UBS India Summit 2026 on September 10, 2026, and the JP Morgan India Financials Tour on September 23, 2026, based on publicly available information and the July 15, 2026 Investor Presentation, with no unpublished price sensitive information intended to be discussed.
- Capital return. The Board declared a 1st interim dividend for FY2026-27 of Re. 1 per equity share of face value Re. 1, with a record date of July 21, 2026 and payment on or before August 14, 2026.
Broker Narrative
The broker narrative evolved from early fears of Q1FY24 seasonal revenue declines and MTF book contraction toward a later focus on structural growth driven by explosive MTF expansion (INR71.5b exit book), super-app cross-sell monetization, and platform diversification (~40% non-broking client sourcing). Persistent themes included market share gains, client acquisition efficiency, and technology upgrades, while early concerns about MTF book decline reversed into a powerful tailwind by FY26. The diversification thesis shifted from ‘gestation’ skepticism to tangible AUM growth (mutual fund AUM INR206b, wealth AUM +33% QoQ).
Fears that came true
- Sequential revenue and volume pressure flagged in the first report materialized across multiple quarters, correlating with DISAPPOINTMENT outcomes such as 2024-01-17 (-29.1% actual) and 2024-04-19 (-11.5% actual) when market activity slowed sharply.
- Operational and cost risks flagged as ‘potential higher-than-anticipated operating costs, including employee expenses and borrowing costs’ materialized as elevated IPL-related marketing spends and fresh ESOP expenses pressured profitability in the last report period (2026-07-16 DISAPPOINTMENT).
- Distribution income seasonal weakness, flagged in the last report as a 27% QoQ decline from insurance sales softness and softer credit distribution, correlated with periods of negative actual returns and DISAPPOINTMENT outcomes.
- Lender risk-appetite recalibration causing quarter-to-quarter volatility in credit disbursements materialized repeatedly, contributing to negative outcomes in several DISAPPOINTMENT quarters.
Optimism that failed
- Sustained strong performance recovery optimism was repeatedly disappointed: multiple Buy calls predicted +20-50% returns but delivered negative actuals (e.g., 2024-01-17 Motilal Buy +20.2% predicted vs -29.1% actual; 2024-04-19 ICICI Buy +24.2% predicted vs -11.5% actual), showing recovery expectations were premature in several quarters.
- Over-optimistic price targets relative to near-term earnings delivery failed repeatedly, as seen in the 2024-04-18 Motilal Buy call predicting +50.4% but delivering only +9.3% actual return.
- Distribution income growth optimism from the super-app and diversified platform thesis was undercut by the 27% QoQ decline flagged in the last report due to seasonal insurance weakness and softer credit distribution.
Broker Timeline
36 broker calls · 2023-06-06 to 2026-07-16
Copyright © 2023 SAS Data Analytics Pvt. Ltd. All rights reserved.