ADANIPOWER
Equity Metrics
October 23, 2026
Adani Power Limited
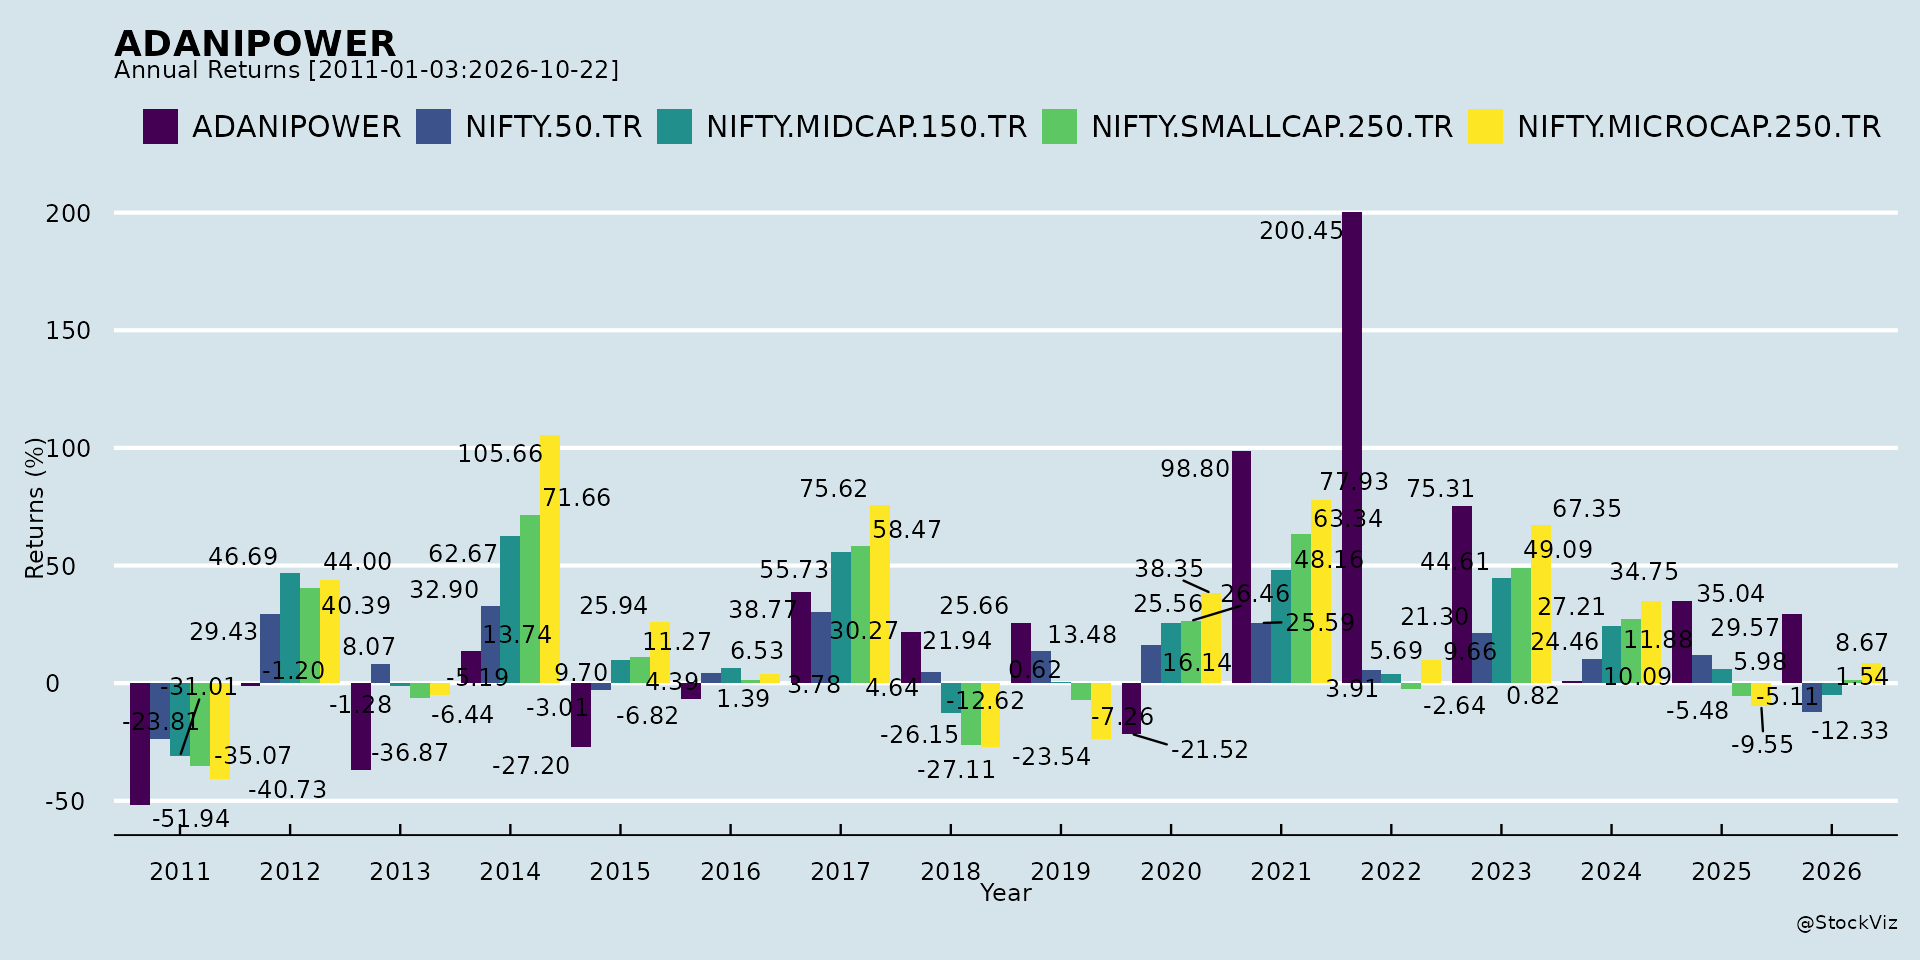
Annual Returns
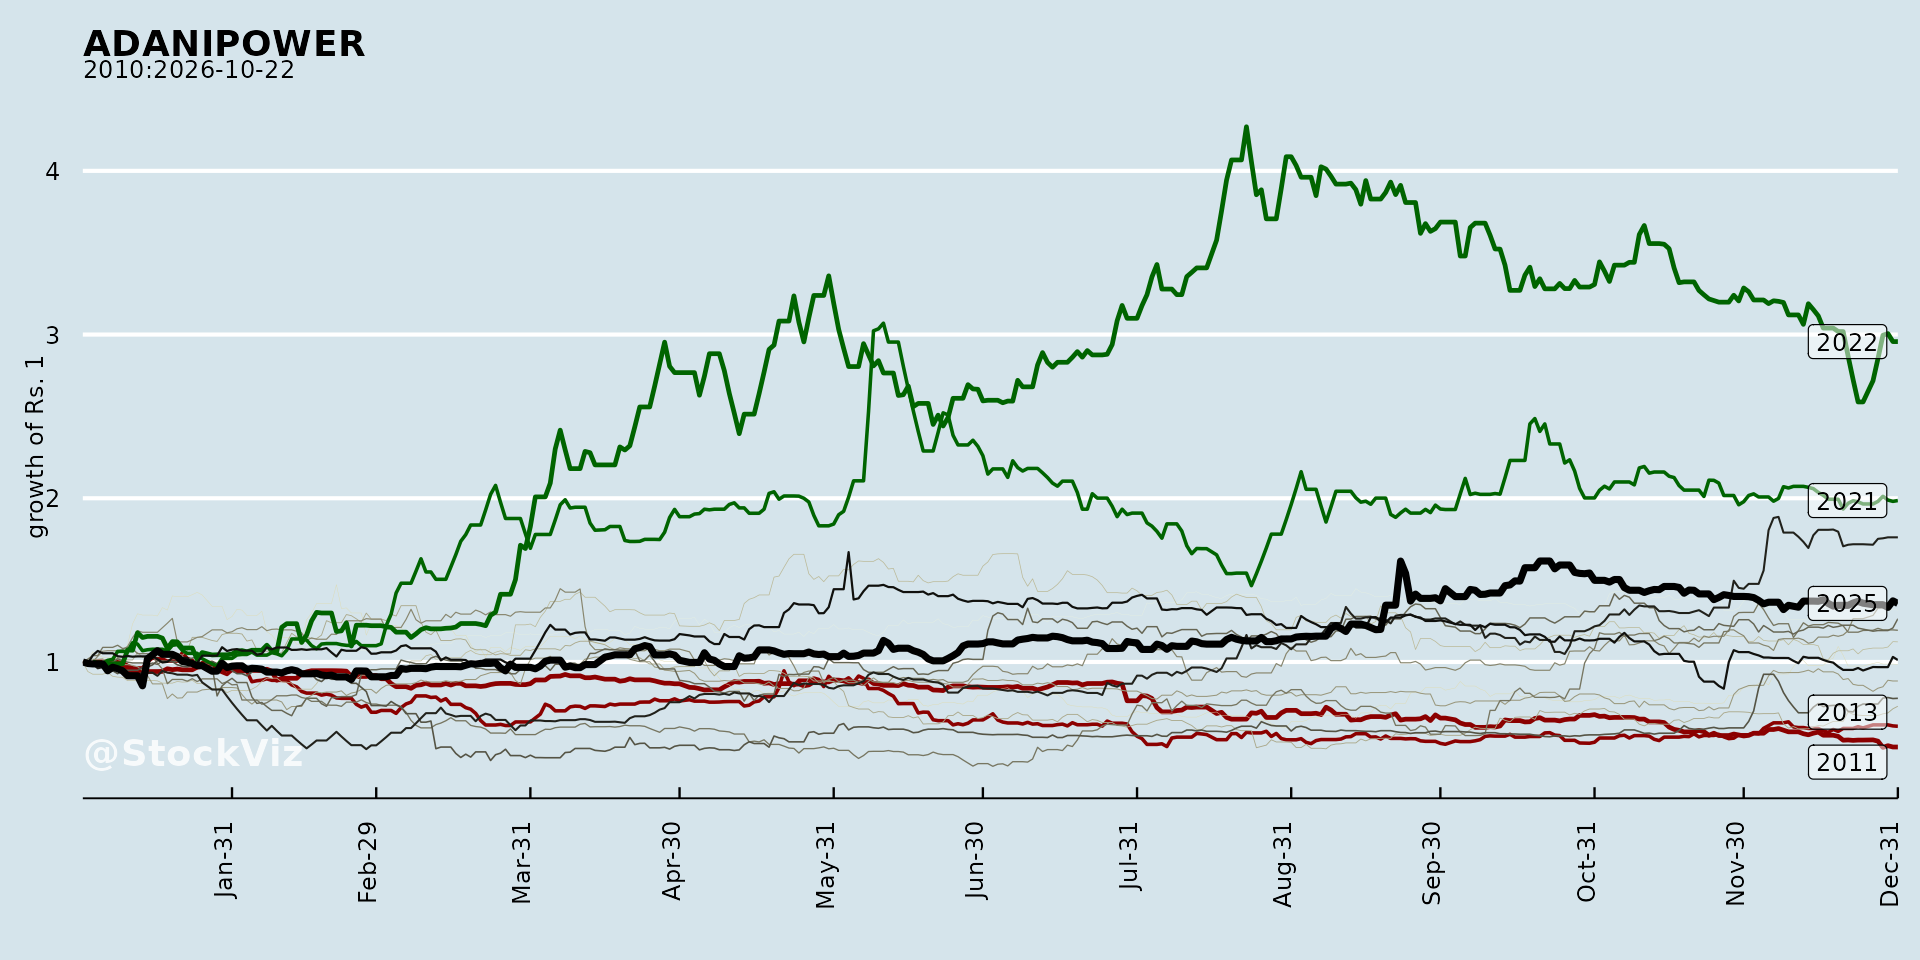
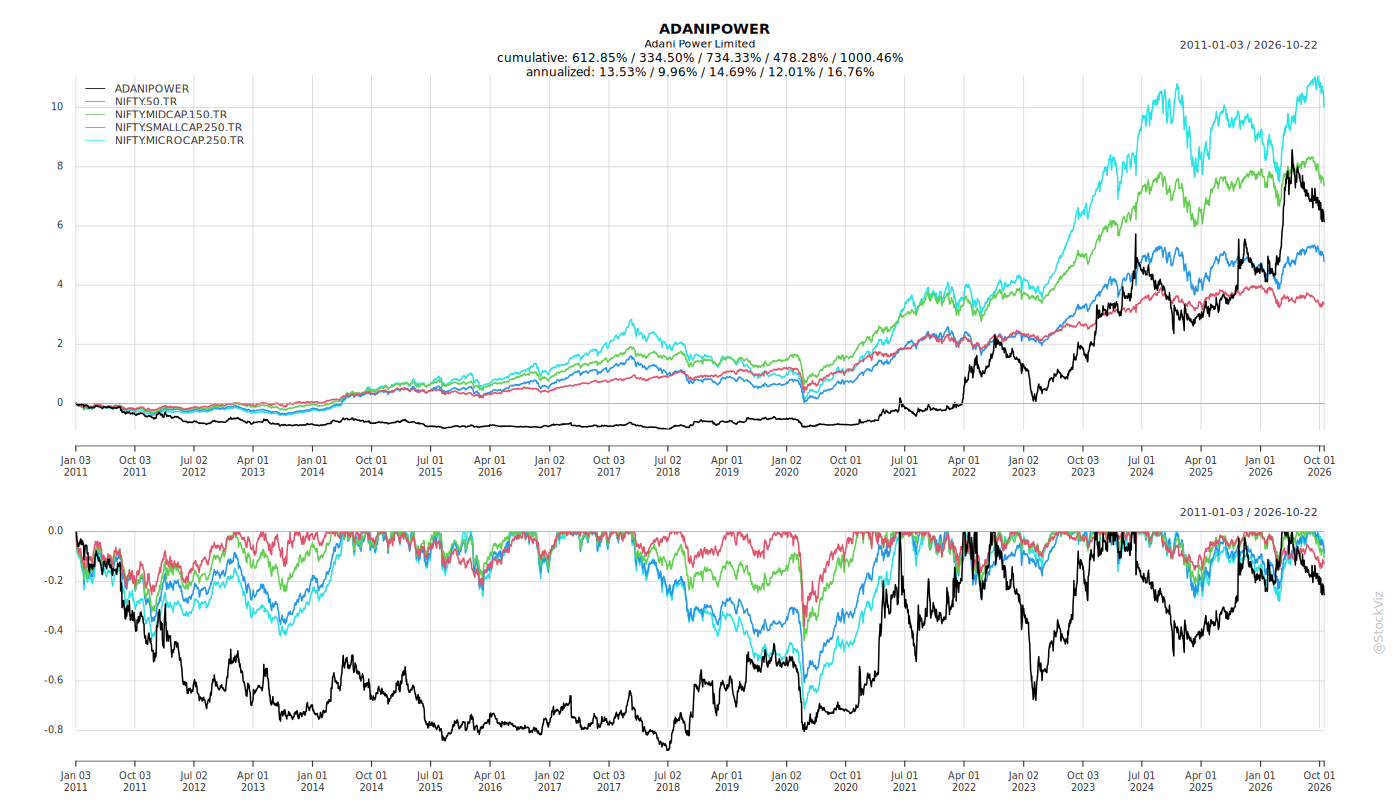
Cumulative Returns and Drawdowns
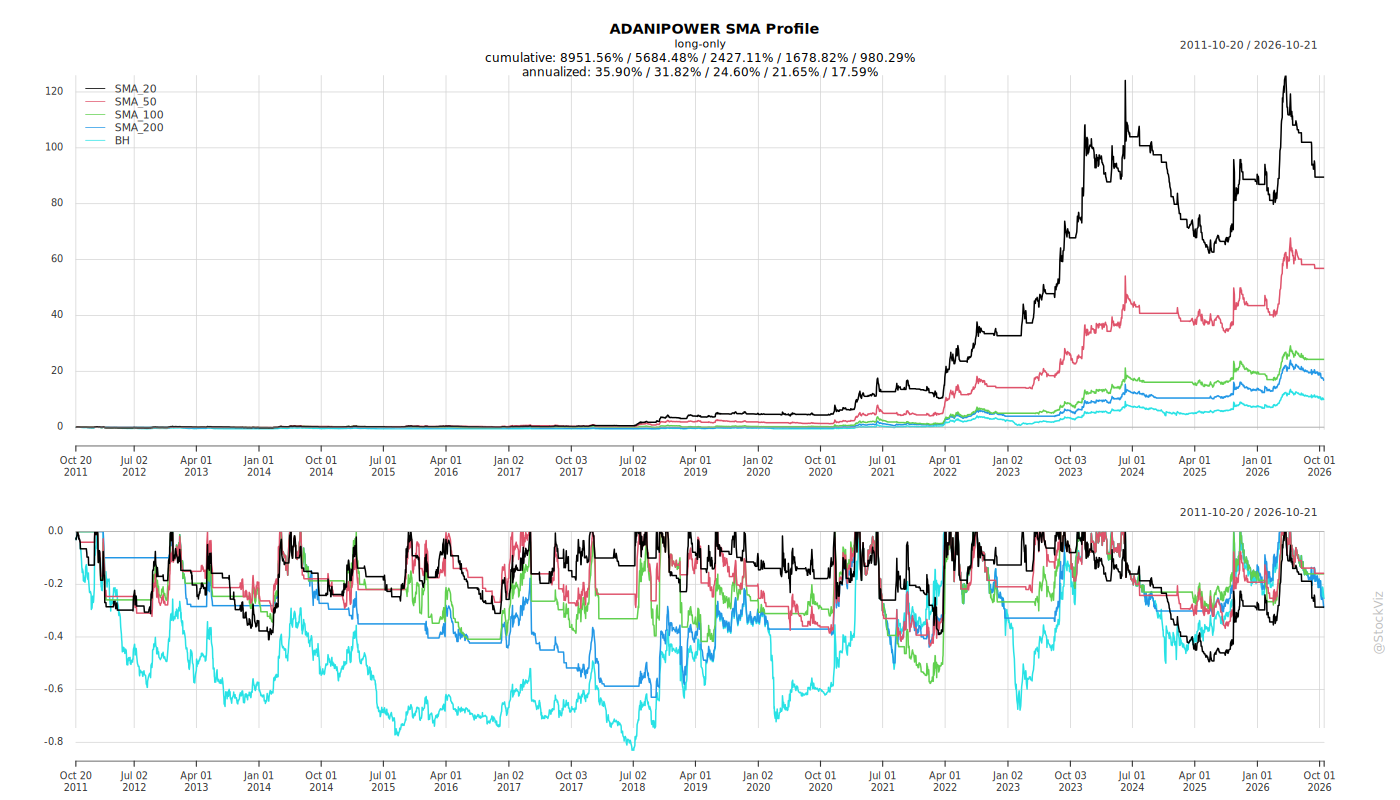
Fundamentals
Ownership
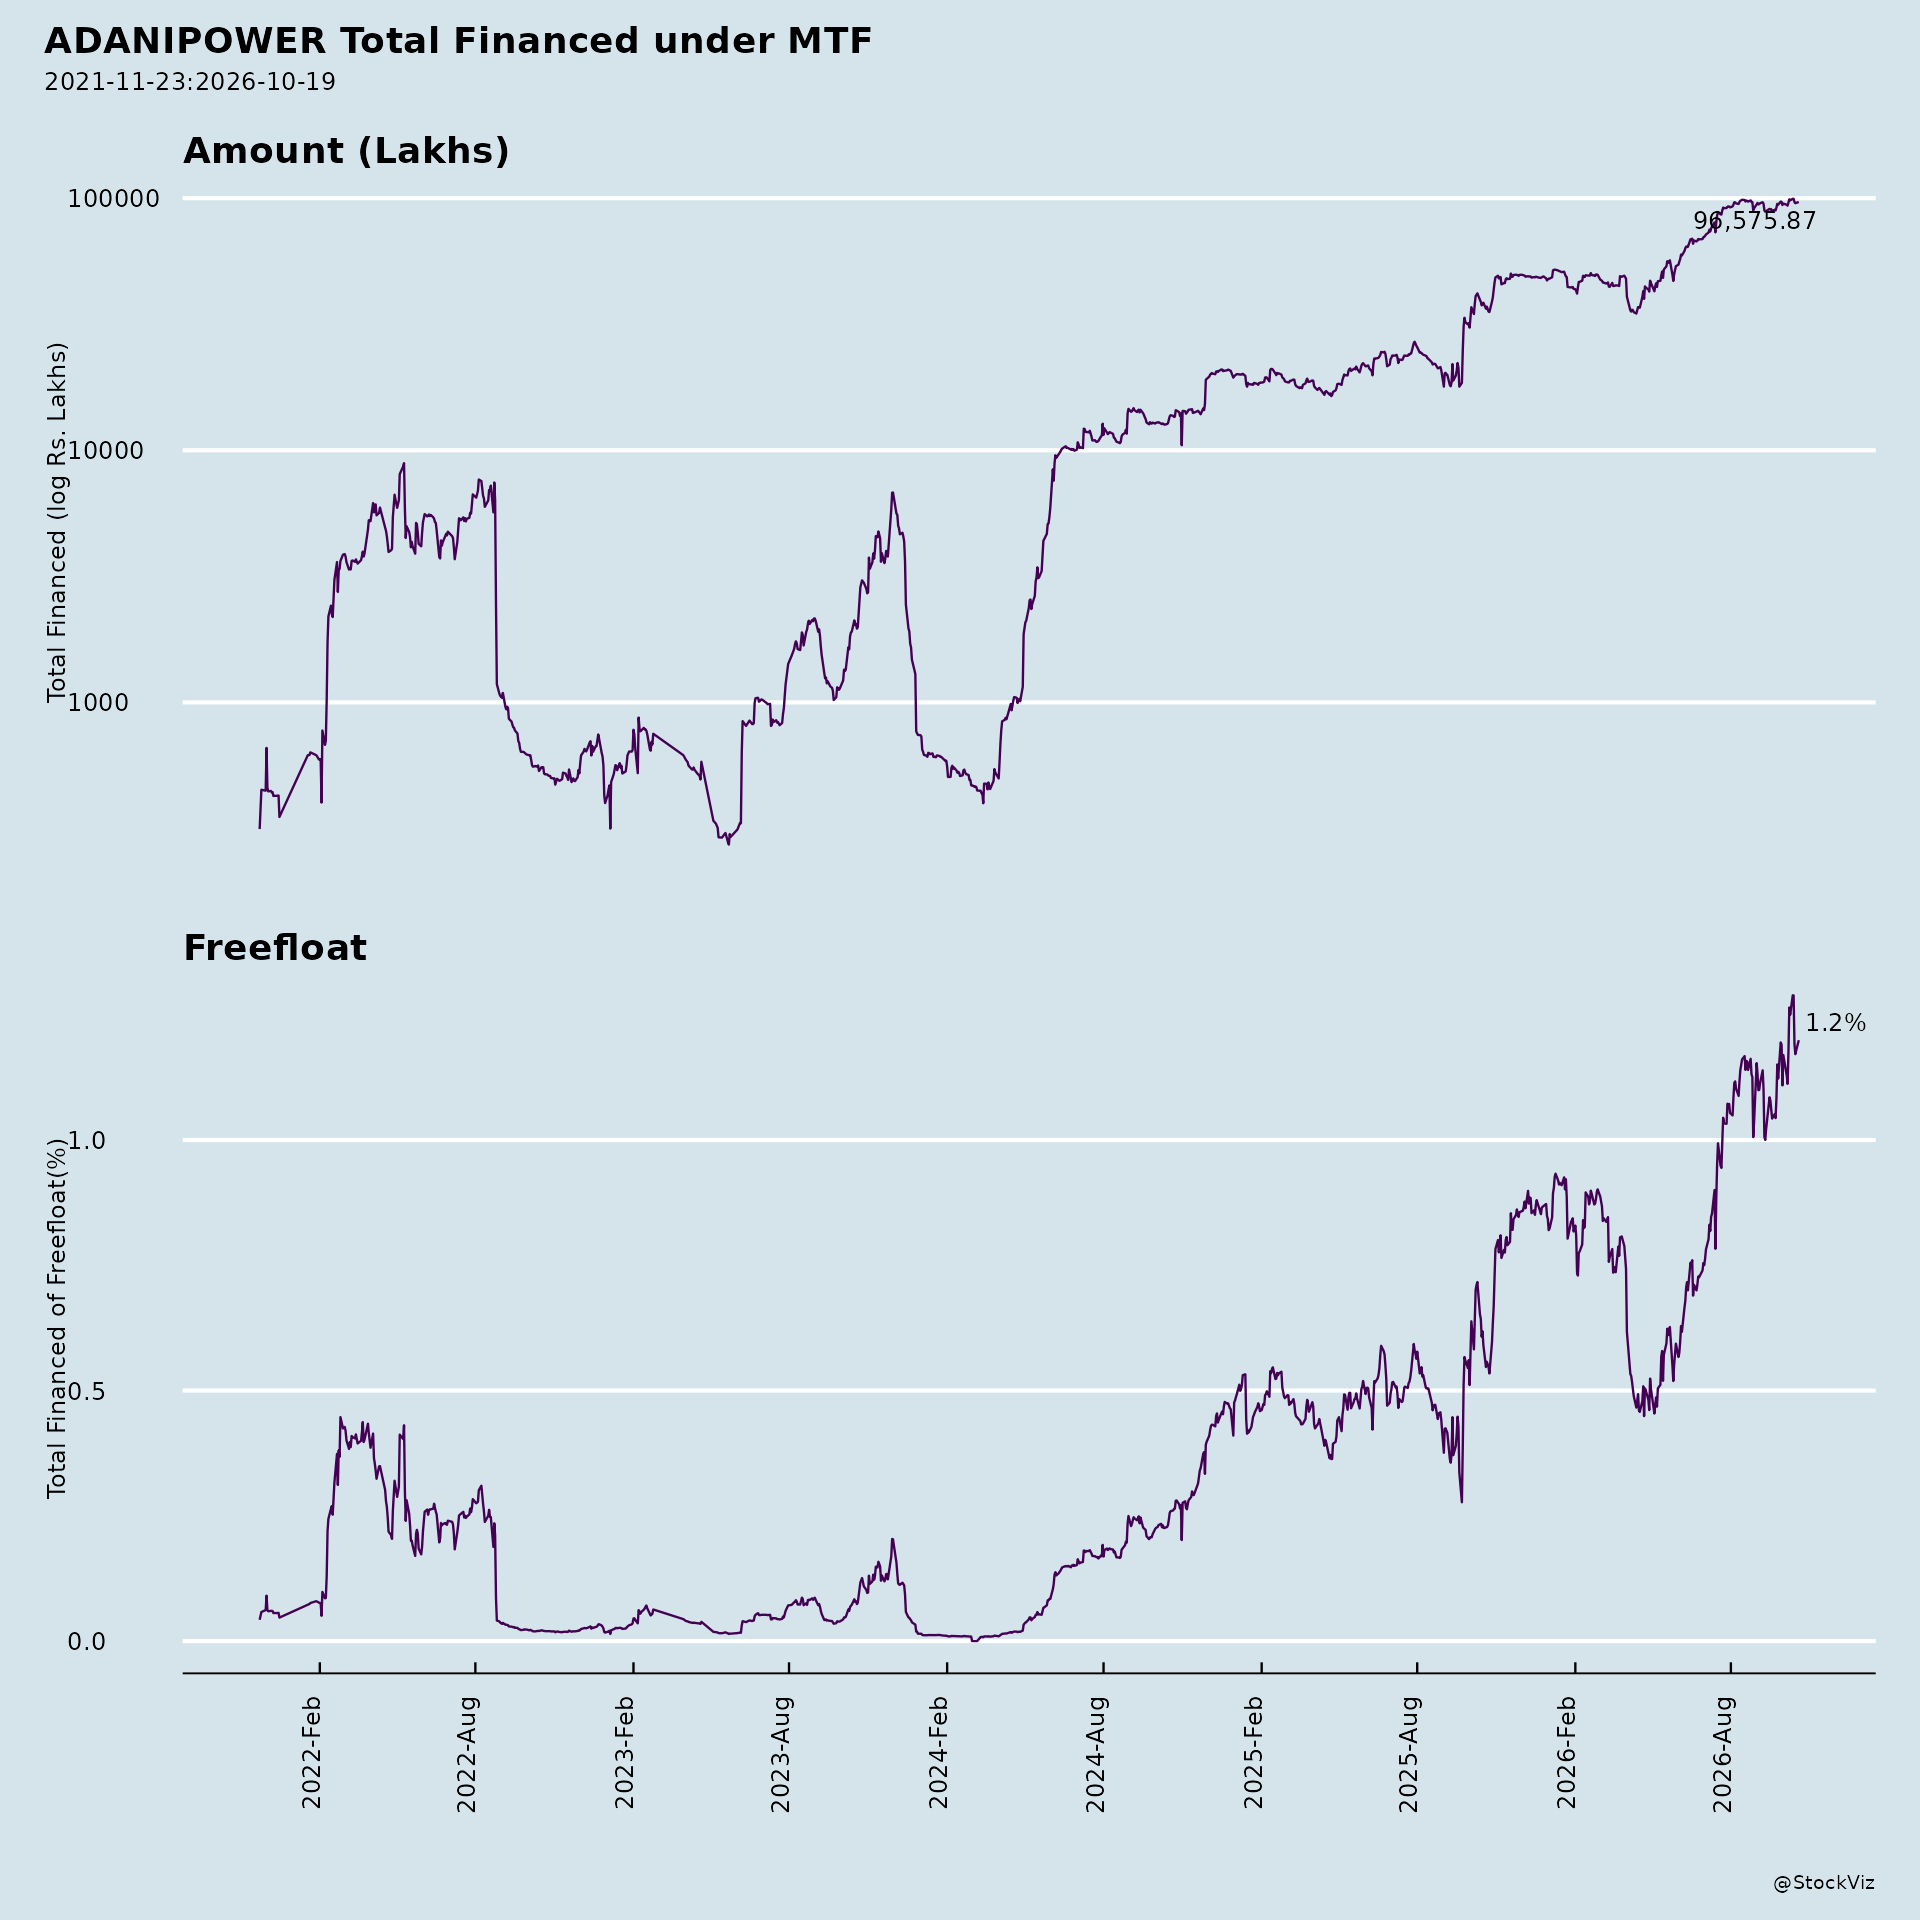
Margined
AI Summary
asof: 2026-09-14
Adani Power Limited — Recent Corporate Announcements Analysis
1. Headwinds and Challenges
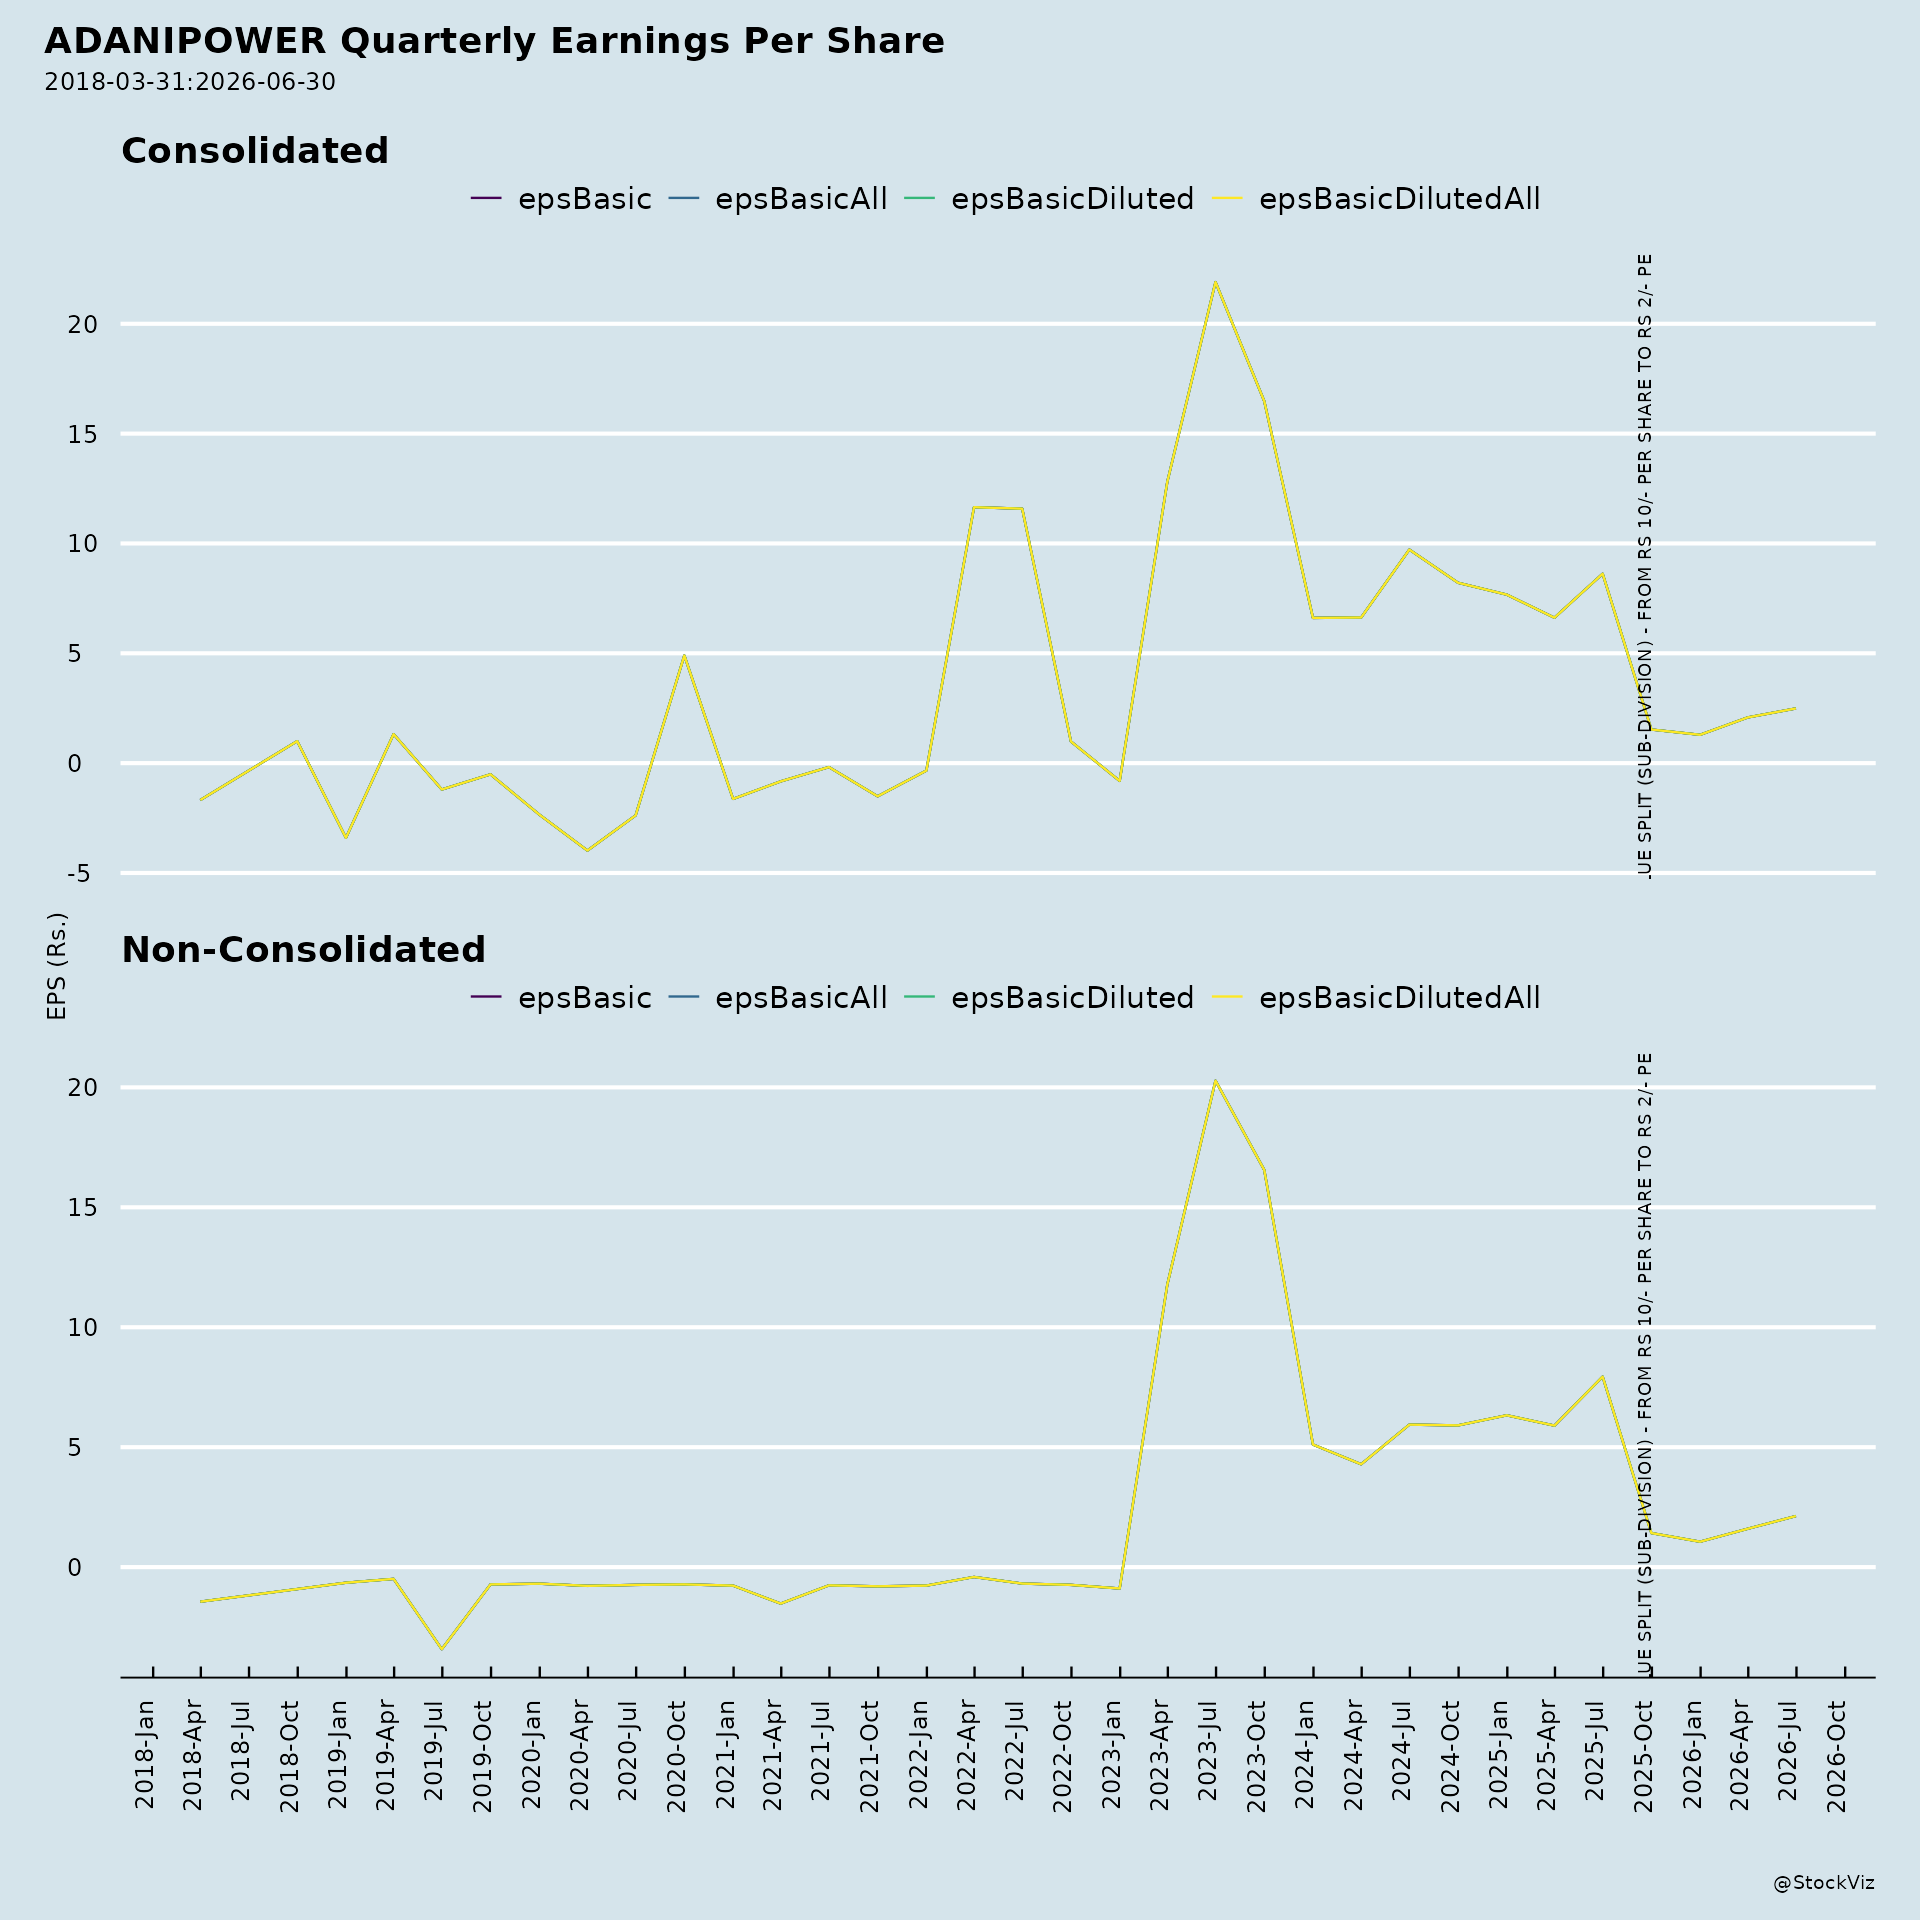
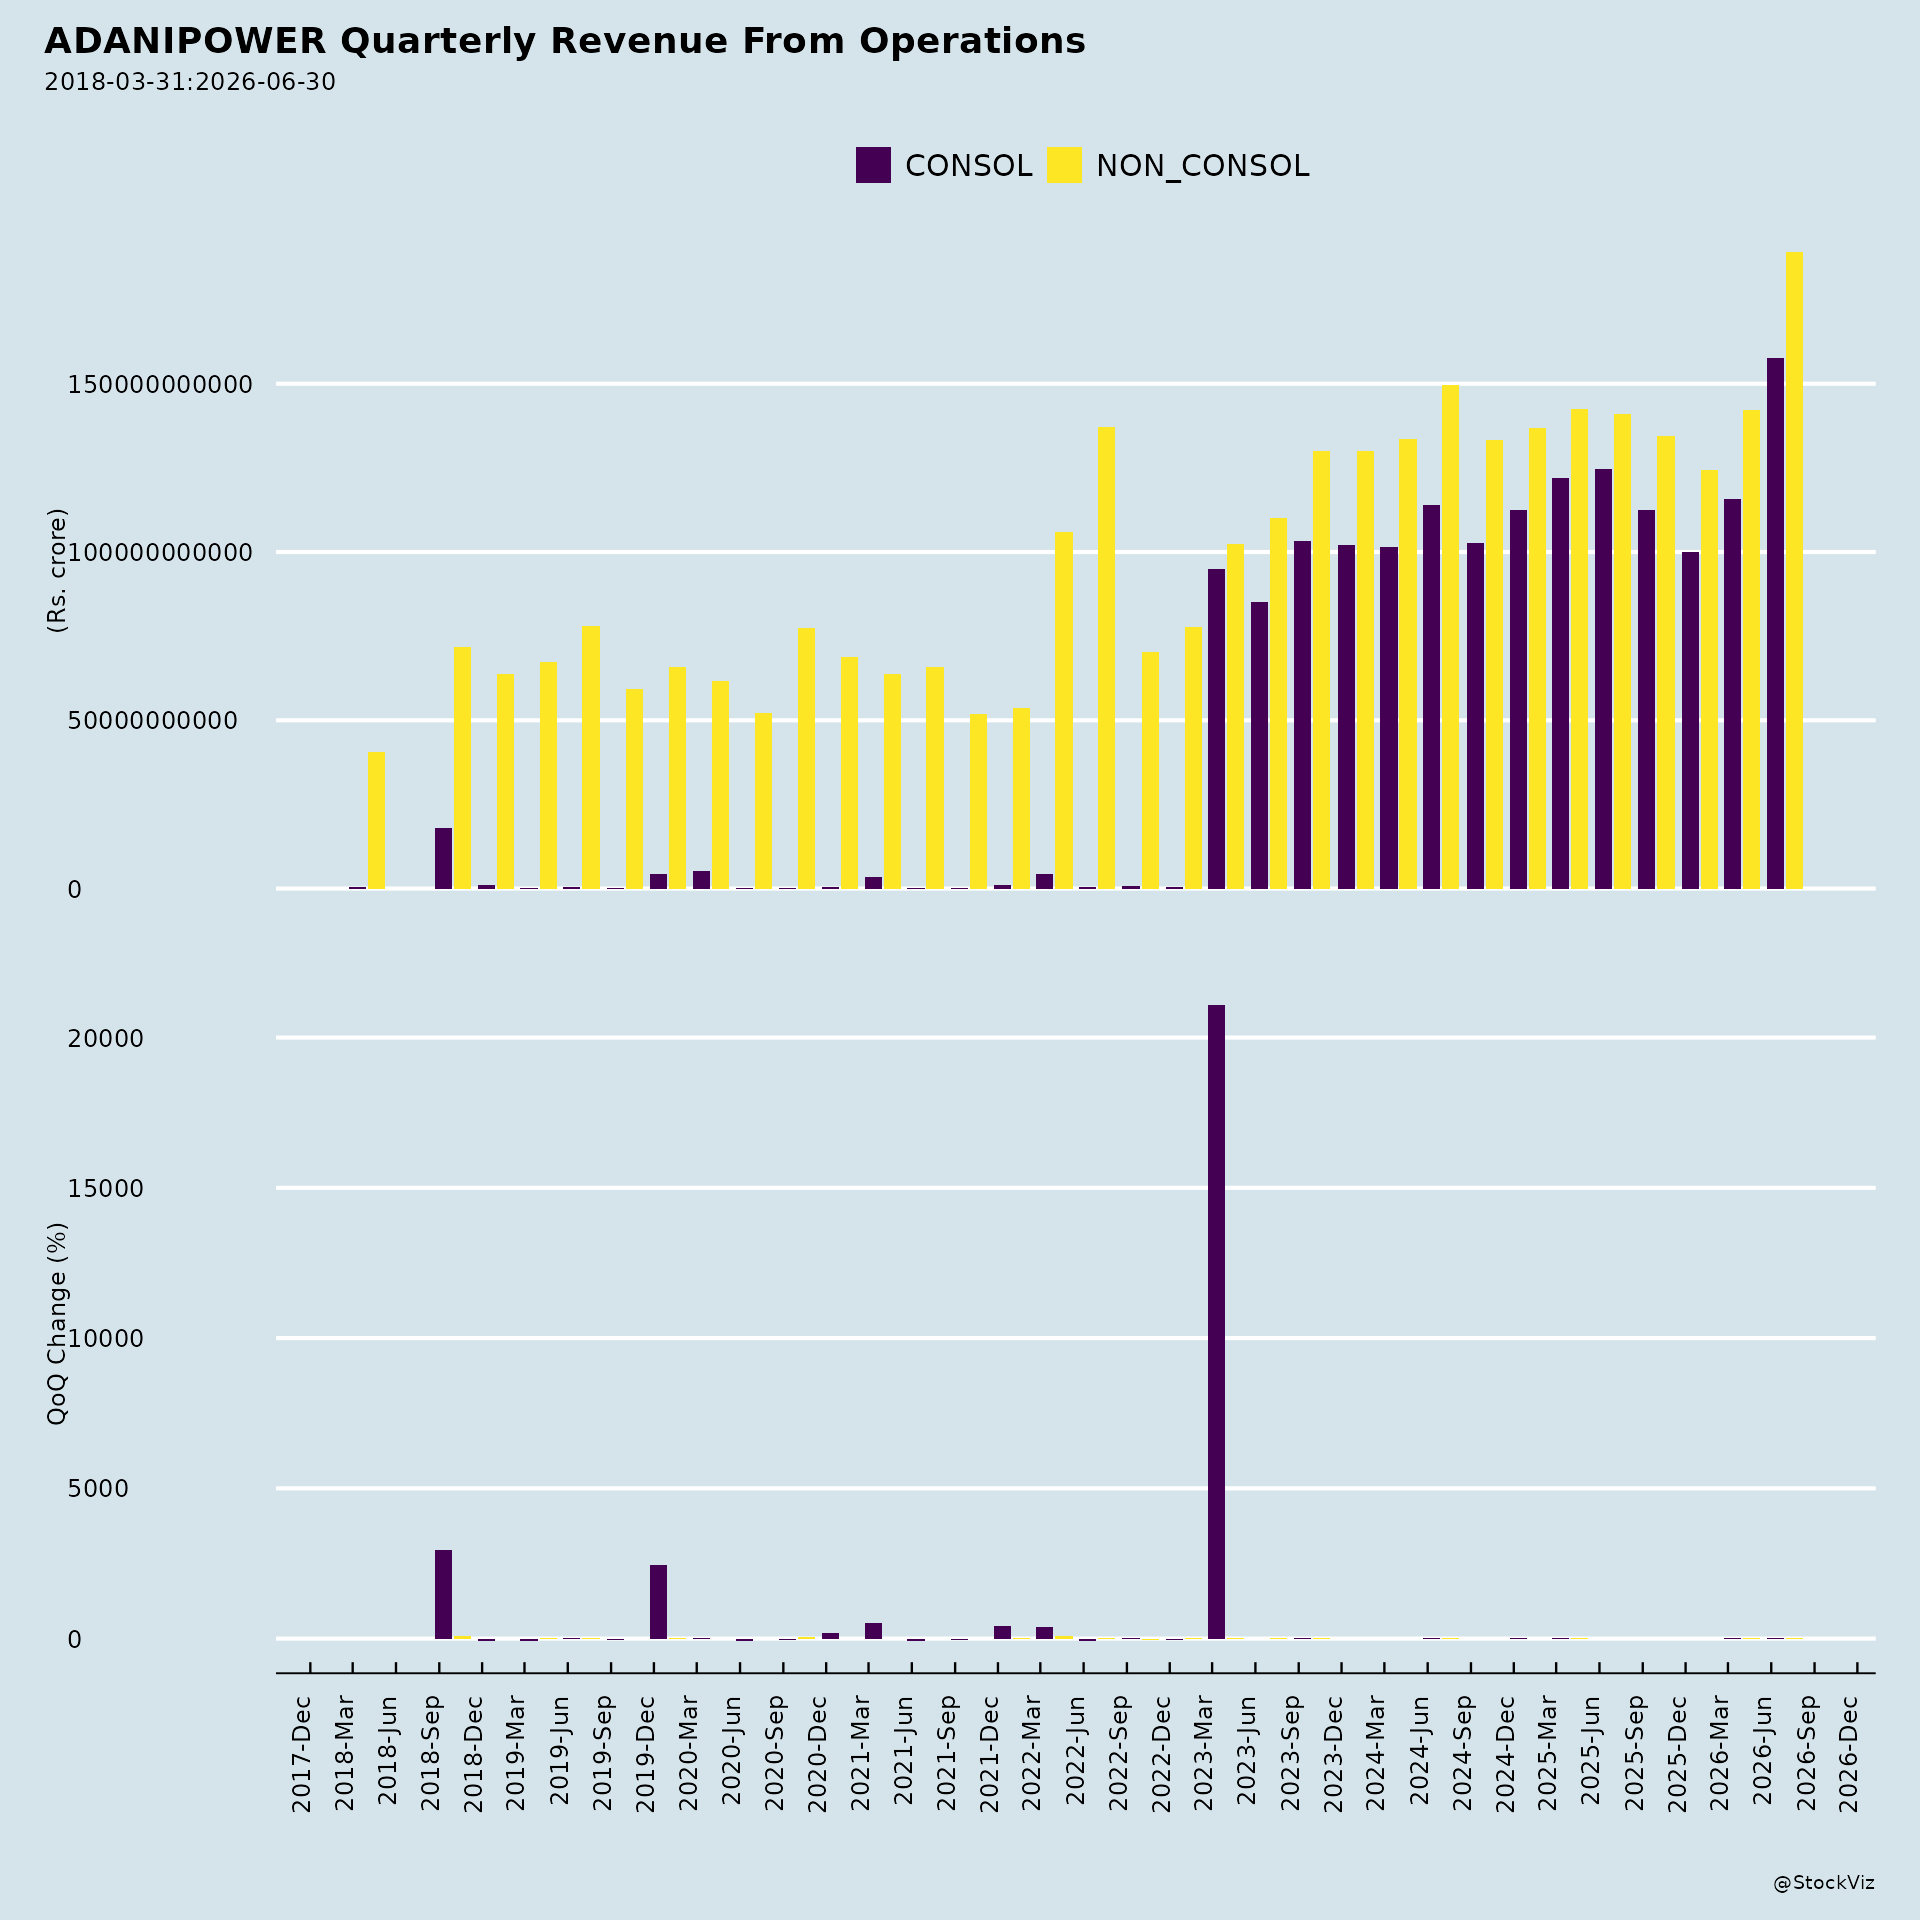
Revenue and EBITDA pressure in FY26 and Q1 FY27. The investor presentation reports FY26 revenue of $6,553 Mn, down 5% YoY, with EBITDA also down 5% YoY at $2,653 Mn. Q1 FY27 revenue of $1,996 Mn and PAT of $501 Mn are shown as down 5% and 1% YoY respectively. Continuing EBITDA for Q1 FY27 was $737 Mn, down 5% YoY, while FY26 continuing EBITDA of $2,395 Mn was up 10% YoY.
Declining plant availability and PLF trends. Plant availability declined from 95% in FY22 to 89% in FY26, recovering to 96% in Q1 FY27. PLF moved from 52% (FY22) to 67% (FY26), then 78% in Q1 FY27. PPA realisation declined from ₹6.46/kWh in FY23 to ₹5.53/kWh in FY26, though it recovered to ₹5.93/kWh in Q1 FY27. Merchant realisation fell from ₹6.98/kWh in FY23 to ₹5.30/kWh in FY26, recovering to ₹7.05/kWh in Q1 FY27.
Rising leverage. Net debt increased from $5,030 Mn (June 2026) versus $5,098 Mn (FY26), with net debt to continuing EBITDA at 2.12x as of June 2026. Long-term borrowings rose from $3,232 Mn (FY25) to $5,038 Mn (FY26). Finance costs remain significant at $95 Mn in Q1 FY27 and $381 Mn in FY26.
ESG risk rating concern. Morningstar Sustainalytics assigned APL an ESG Risk Rating of 32.03 (High Risk), even as other agencies rated the company favourably.
Execution and fuel-related risks flagged. The presentation identifies execution risk (vendor ecosystem, construction monitoring, supply chain), credit risk (vendor onboarding, performance benchmarking), time and cost overrun risk, liquidity risk, and fuel-related risks including availability risk (FSA coal shortfall), price risk, and the need for pass-through mechanisms.
2. Tailwinds and Growth Prospects
India’s power sector opportunity. India’s installed capacity is projected to grow from 532 GW (FY26) to ~1,000 GW by FY32 at 11% CAGR, with a $500 Bn+ investment opportunity. Peak demand is projected at 388 GW in FY32 versus 245 GW in FY26. Additional coal capacity required is 80 GW by FY32 and 97 GW by FY35. Coal allocations to states under the SHAKTI policy cover 30 GW of fresh PPA bids, with 20.9 GW of PPAs awarded by state DISCOMs and 13.9 GW awarded to APL.
Capacity expansion. APL’s operating capacity stands at 18,330 MW (13 assets), with locked-in capacity of 23,720 MW (13 projects) and a target capacity of 42,050 MW by FY32. The company reports 95%+ of operating capacity tied up under PPAs and 13,320 MW of new PPAs tied up for locked-in capacity. Capacity expansion timeline shows additions of 1,600 MW (FY27), 1,320 MW (FY28), 4,000 MW (FY29), 4,800 MW (FY30), 6,400 MW (FY31), and 5,600 MW (FY32).
Locked-in growth execution advantages. 60% of upcoming capacity is brownfield, 63% is near-pithead, with 100% land available and 100% BTG ordering for 23.7 GW. The company has advance-ordered 22.4 GW of BTG sets. 87% of domestic coal-based capacity has fuel security via long-term FSAs.
Fuel management strengths. APL is described as the only IPP in India with in-house mine-to-plant logistics capability, handling approximately 74 MTPA coal and 22 MTPA fly ash, with entry into commercial mining with 14 MTPA capacity across four coal mines.
Financial capacity for growth. FFO for FY26 was $2,293 Mn, with cash balance of $966 Mn. The presentation states the existing fleet will generate aggregate FFO of $16 Bn over seven years, funding a large portion of ~$19 Bn capex, with majority of expansion capex funded through internal accruals. APL has the ability to fund $21 Bn capex over seven years.
Rating upgrades. APL’s ratings improved from A/Positive (March 2023) to AA+/Stable (August 2026) across agencies, described as 8-9 notches upgrade in six years with coverage expanded from one to four rating agencies.
Fundraising approvals. The Board on July 22, 2026 approved raising up to Rs. 15,000 crore via QIP or other permissible mode, and increasing borrowing limits from Rs. 75,000 crore to Rs. 1,00,000 crore. All four special resolutions were passed at the EGM held August 14, 2026 with requisite majority.
3. Key Risks
Fuel and offtake risks. The presentation identifies availability risk where coal linkages are earmarked by DISCOMs for each PPA bid, and additional FSA mechanisms address shortfall in FSA coal. Price risk is mitigated through pass-through of fuel cost with change-in-law protection and alternate fuel supply cost recovery.
Execution risks. Project execution risks include vendor ecosystem, construction monitoring, supply chain management, time and cost overruns, and liquidity gaps. The PMAG structure and multi-layered risk governance are cited as mitigants.
Merchant market exposure. Approximately 5% of existing capacity is open (untied), exposing APL to merchant and bilateral market volatility. Merchant volumes and tariffs are shown to fluctuate across years.
Regulatory and policy dependence. The business relies on SHAKTI policy coal allocations, state DISCOM PPA awards, and regulatory approvals for alternate fuel usage. The presentation notes regulatory approvals enable efficient cost recovery.
Concentration in coal-based generation. Coal provides 83% of India’s base load supply mix, and APL’s portfolio is predominantly thermal. The presentation notes coal imports account for 50% of consumption, with imported LNG costing INR 6-8/kWh versus INR 2-3/kWh for domestic coal.
ESG risk rating. The Morningstar Sustainalytics High Risk rating of 32.03 contrasts with stronger ratings from S&P Global (69/100), FTSE Russell (4.3/5.0), and CareEdge (80/100).
4. Management Guidance Versus Observed Business Performance
Capacity guidance versus actuals. The presentation targets 42,050 MW by FY32 from 18,330 MW operating and 23,720 MW locked-in. Historical effective capacity grew from 12,450 MW (FY22) to 18,150 MW (Q1 FY27) at 10% CAGR. The company has demonstrated acquisition and turnaround of 7,450 MW of inorganic capacity, including Mahan (acquired March 2022, EBITDA from $72 Mn FY22 to $68 Mn in Q1 FY27 alone, with ~$816 Mn cumulative EBITDA since acquisition), Raipur (acquired August 2019, EBITDA from $28 Mn FY20 to $100 Mn FY26, ~$1,274 Mn cumulative), and Raigarh (acquired July 2019, EBITDA from negative $13 Mn FY20 to $43 Mn Q1 FY27, ~$492 Mn cumulative).
PPA tie-up guidance versus actuals. The presentation states 95%+ of operating capacity has PPAs tied up, with 13,320 MW of new PPAs tied up for locked-in capacity. States have awarded 19.3 GW of PPAs in the last two financial years, of which APL won 12.6 GW. Upcoming long-term PPA bids total 16,380 MW across Uttar Pradesh, Gujarat, Uttarakhand, West Bengal, and Rajasthan.
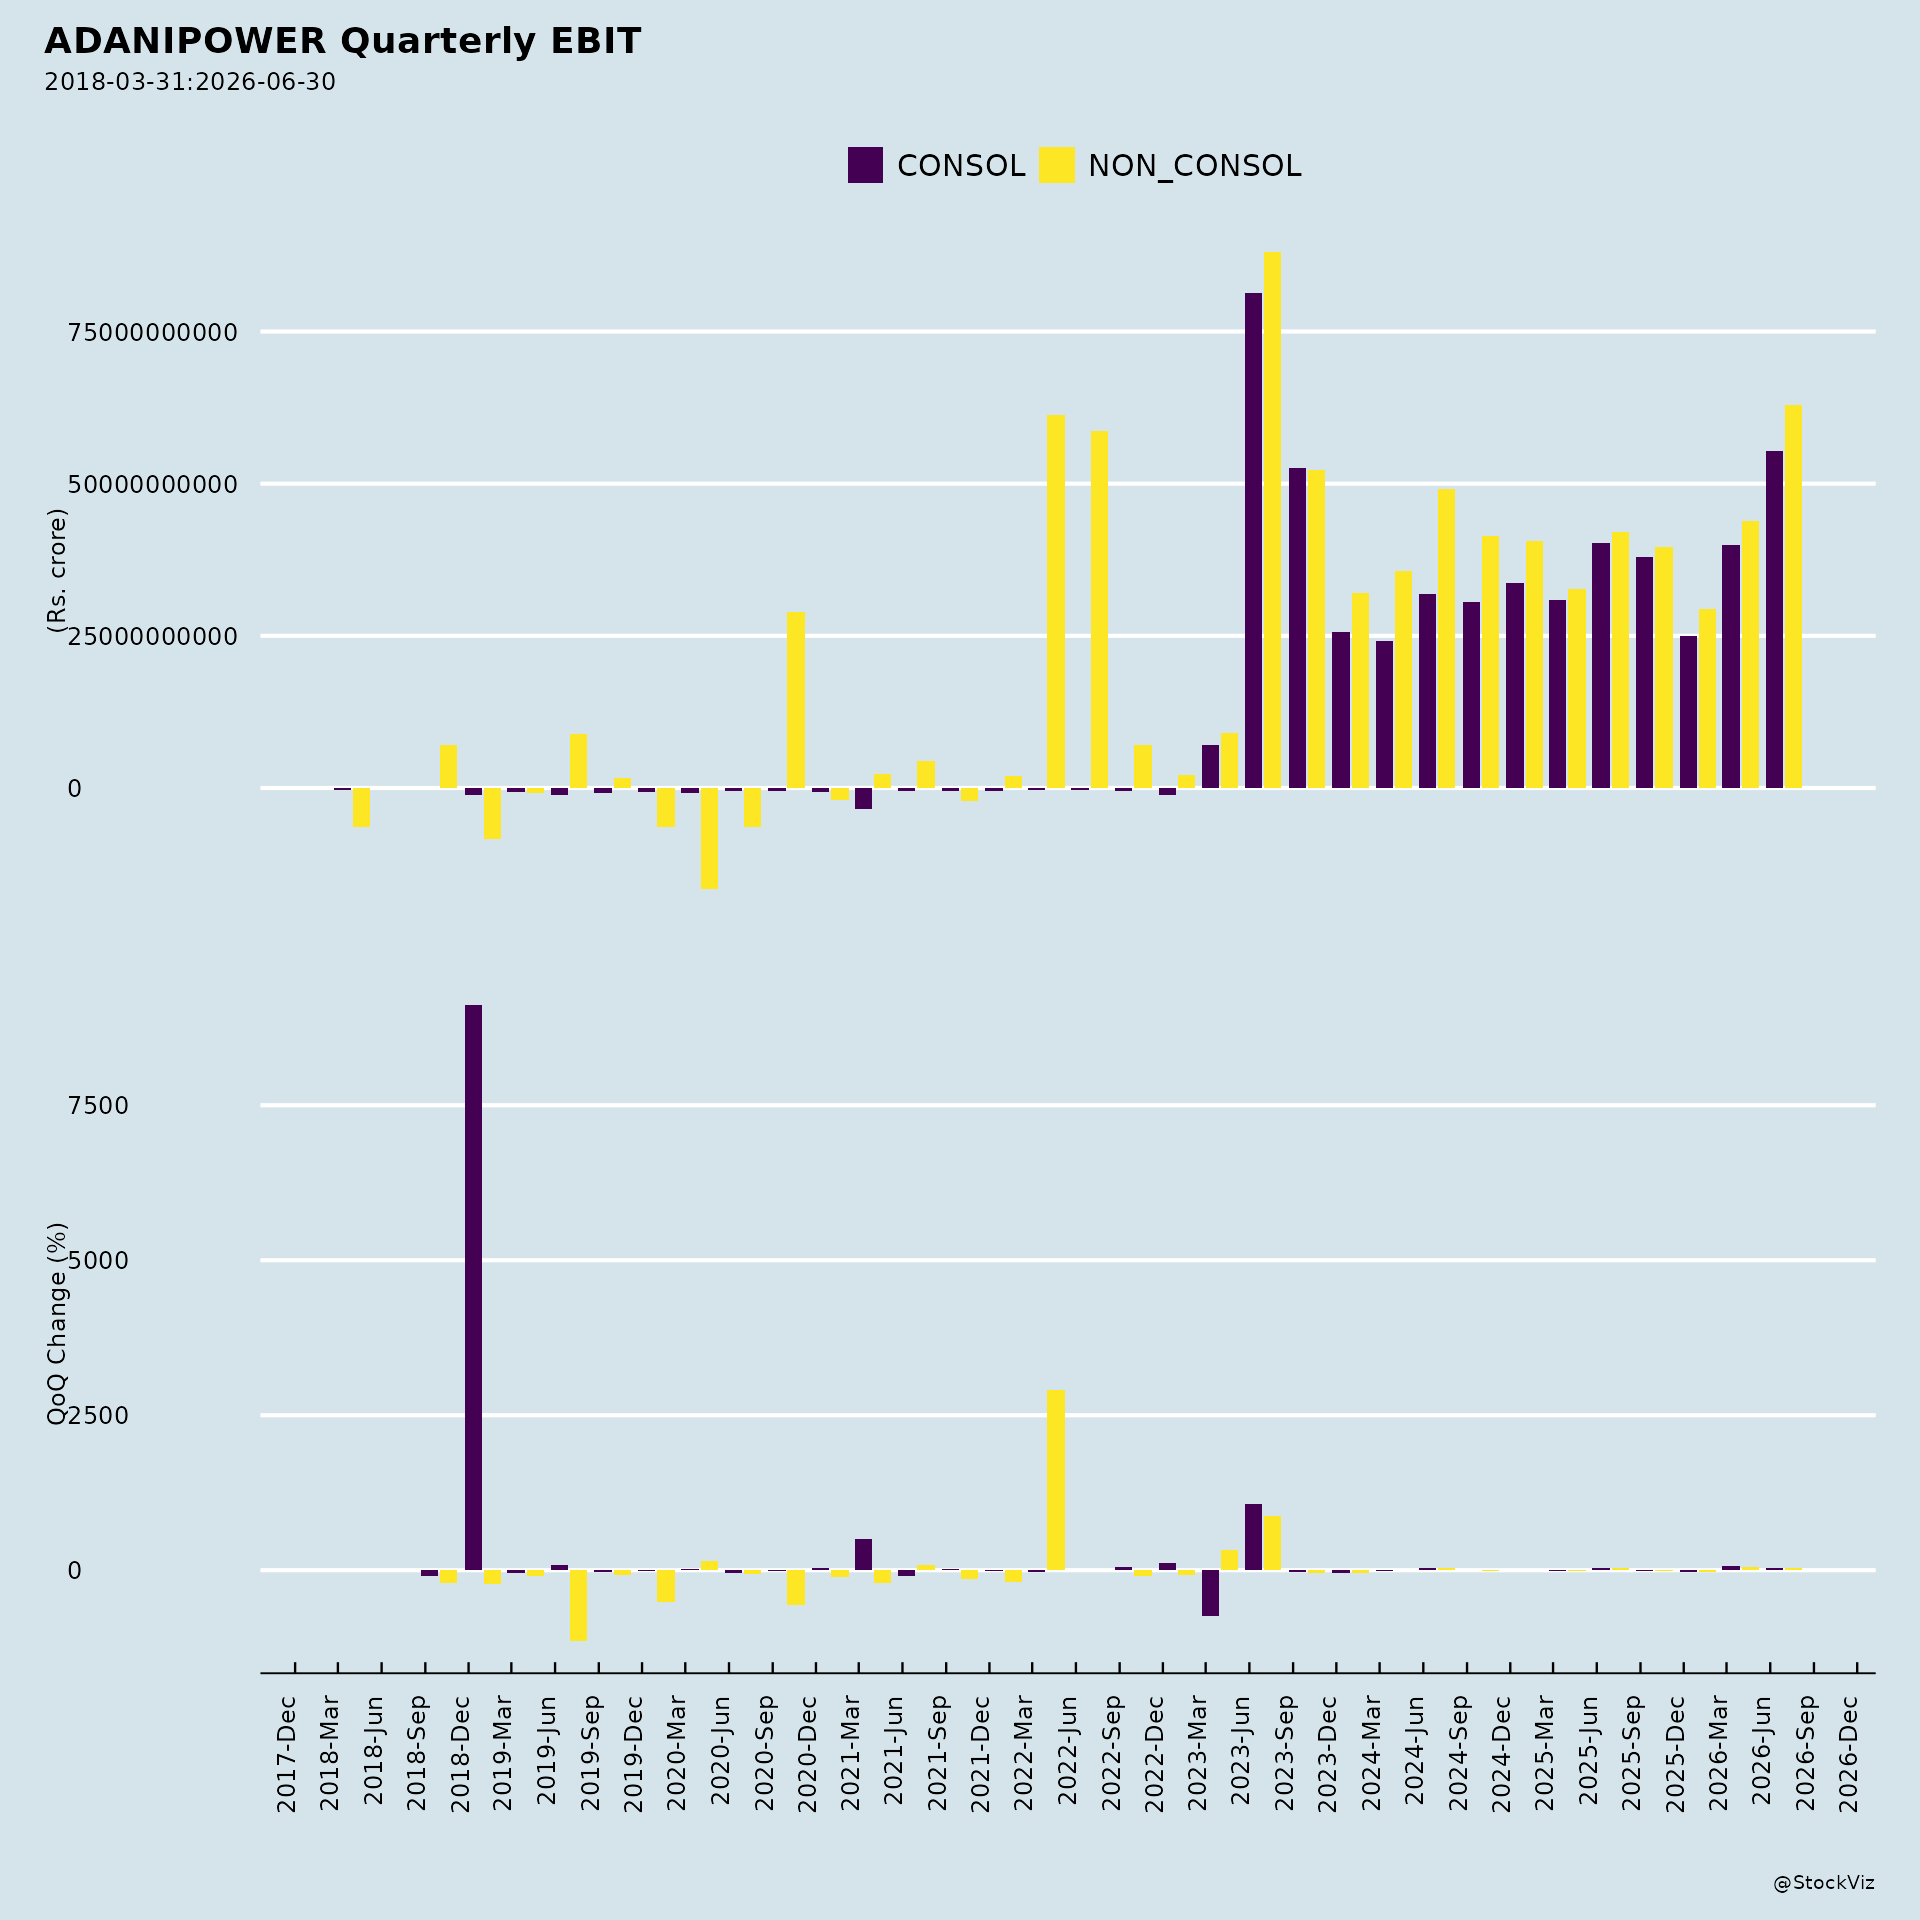
Financial performance versus guidance. FY26 revenue declined 5% YoY to $6,553 Mn and EBITDA declined 5% YoY to $2,653 Mn, while continuing EBITDA rose 10% YoY to $2,395 Mn. Q1 FY27 showed revenue of $1,996 Mn (down 5% YoY), EBITDA of $884 Mn (down 5% YoY), continuing EBITDA of $737 Mn (up 10% YoY), and PAT of $514 Mn (up 33% YoY). The presentation cites 15% 3Y EBITDA CAGR and 3% 3Y PAT CAGR.
Leverage guidance versus actuals. Net debt to continuing EBITDA improved from 9.43x (FY19) to 2.12x (June 2026), with net debt reduced from $6,644 Mn (FY19) to $5,030 Mn (June 2026). The presentation states all debt maturities are within the cash after-tax (FFO) envelope, with each year’s debt maturity covered by FFO and cash balance.
Fundraising execution. The Board approved QIP of up to Rs. 15,000 crore and borrowing limit increase to Rs. 1,00,000 crore on July 22, 2026. The EGM on August 14, 2026 passed all four special resolutions: increase in borrowing limits (99.89% in favour), creation of mortgage/charge (99.62% in favour), conversion of loan into equity (99.69% in favour), and raising capital from eligible investors (100.00% in favour).
Broker Narrative
The narrative shifted from celebrating near-term operational wins (PLF +600bps, generation +21%, internal funding) to a massive 23.72GW expansion story with higher tariff economics (~INR3.9/kWh). Persistent themes included thermal capacity expansion and India’s power demand growth. The headwinds evolved from specific operational issues (Godda receivables, ESG score) to broader regulatory/commodity/execution risks, while the tone grew more speculative on future expansion execution.
Fears that came true
- Construction delays across the 12.5 GW under-construction portfolio flagged in the first report materialized as execution concerns weighed on sentiment, contributing to the -0.8% actual return vs +20.2% predicted in the Motilal Oswal report.
- Merchant price volatility and spot power exposure flagged early appeared to impact economics, as the stock failed to sustain momentum and delivered flat/near-flat returns despite bullish predictions.
Optimism that failed
- The assumption of 100% internal funding with no new debt for massive capex expansion proved overly optimistic, as the market punished the stock with flat/near-flat returns reflecting skepticism about balance sheet capacity.
- The EBITDA CAGR of 21% and PAT CAGR of 15% growth projections failed to materialize in market expectations, with actual returns of -0.8% and +1.6% versus predicted +20.2% and +30.2%.
Broker Timeline
6 broker calls · 2025-05-01 to 2026-09-24
Copyright © 2023 SAS Data Analytics Pvt. Ltd. All rights reserved.