ADANIPORTS
Equity Metrics
September 24, 2026
Adani Ports and Special Economic Zone Limited
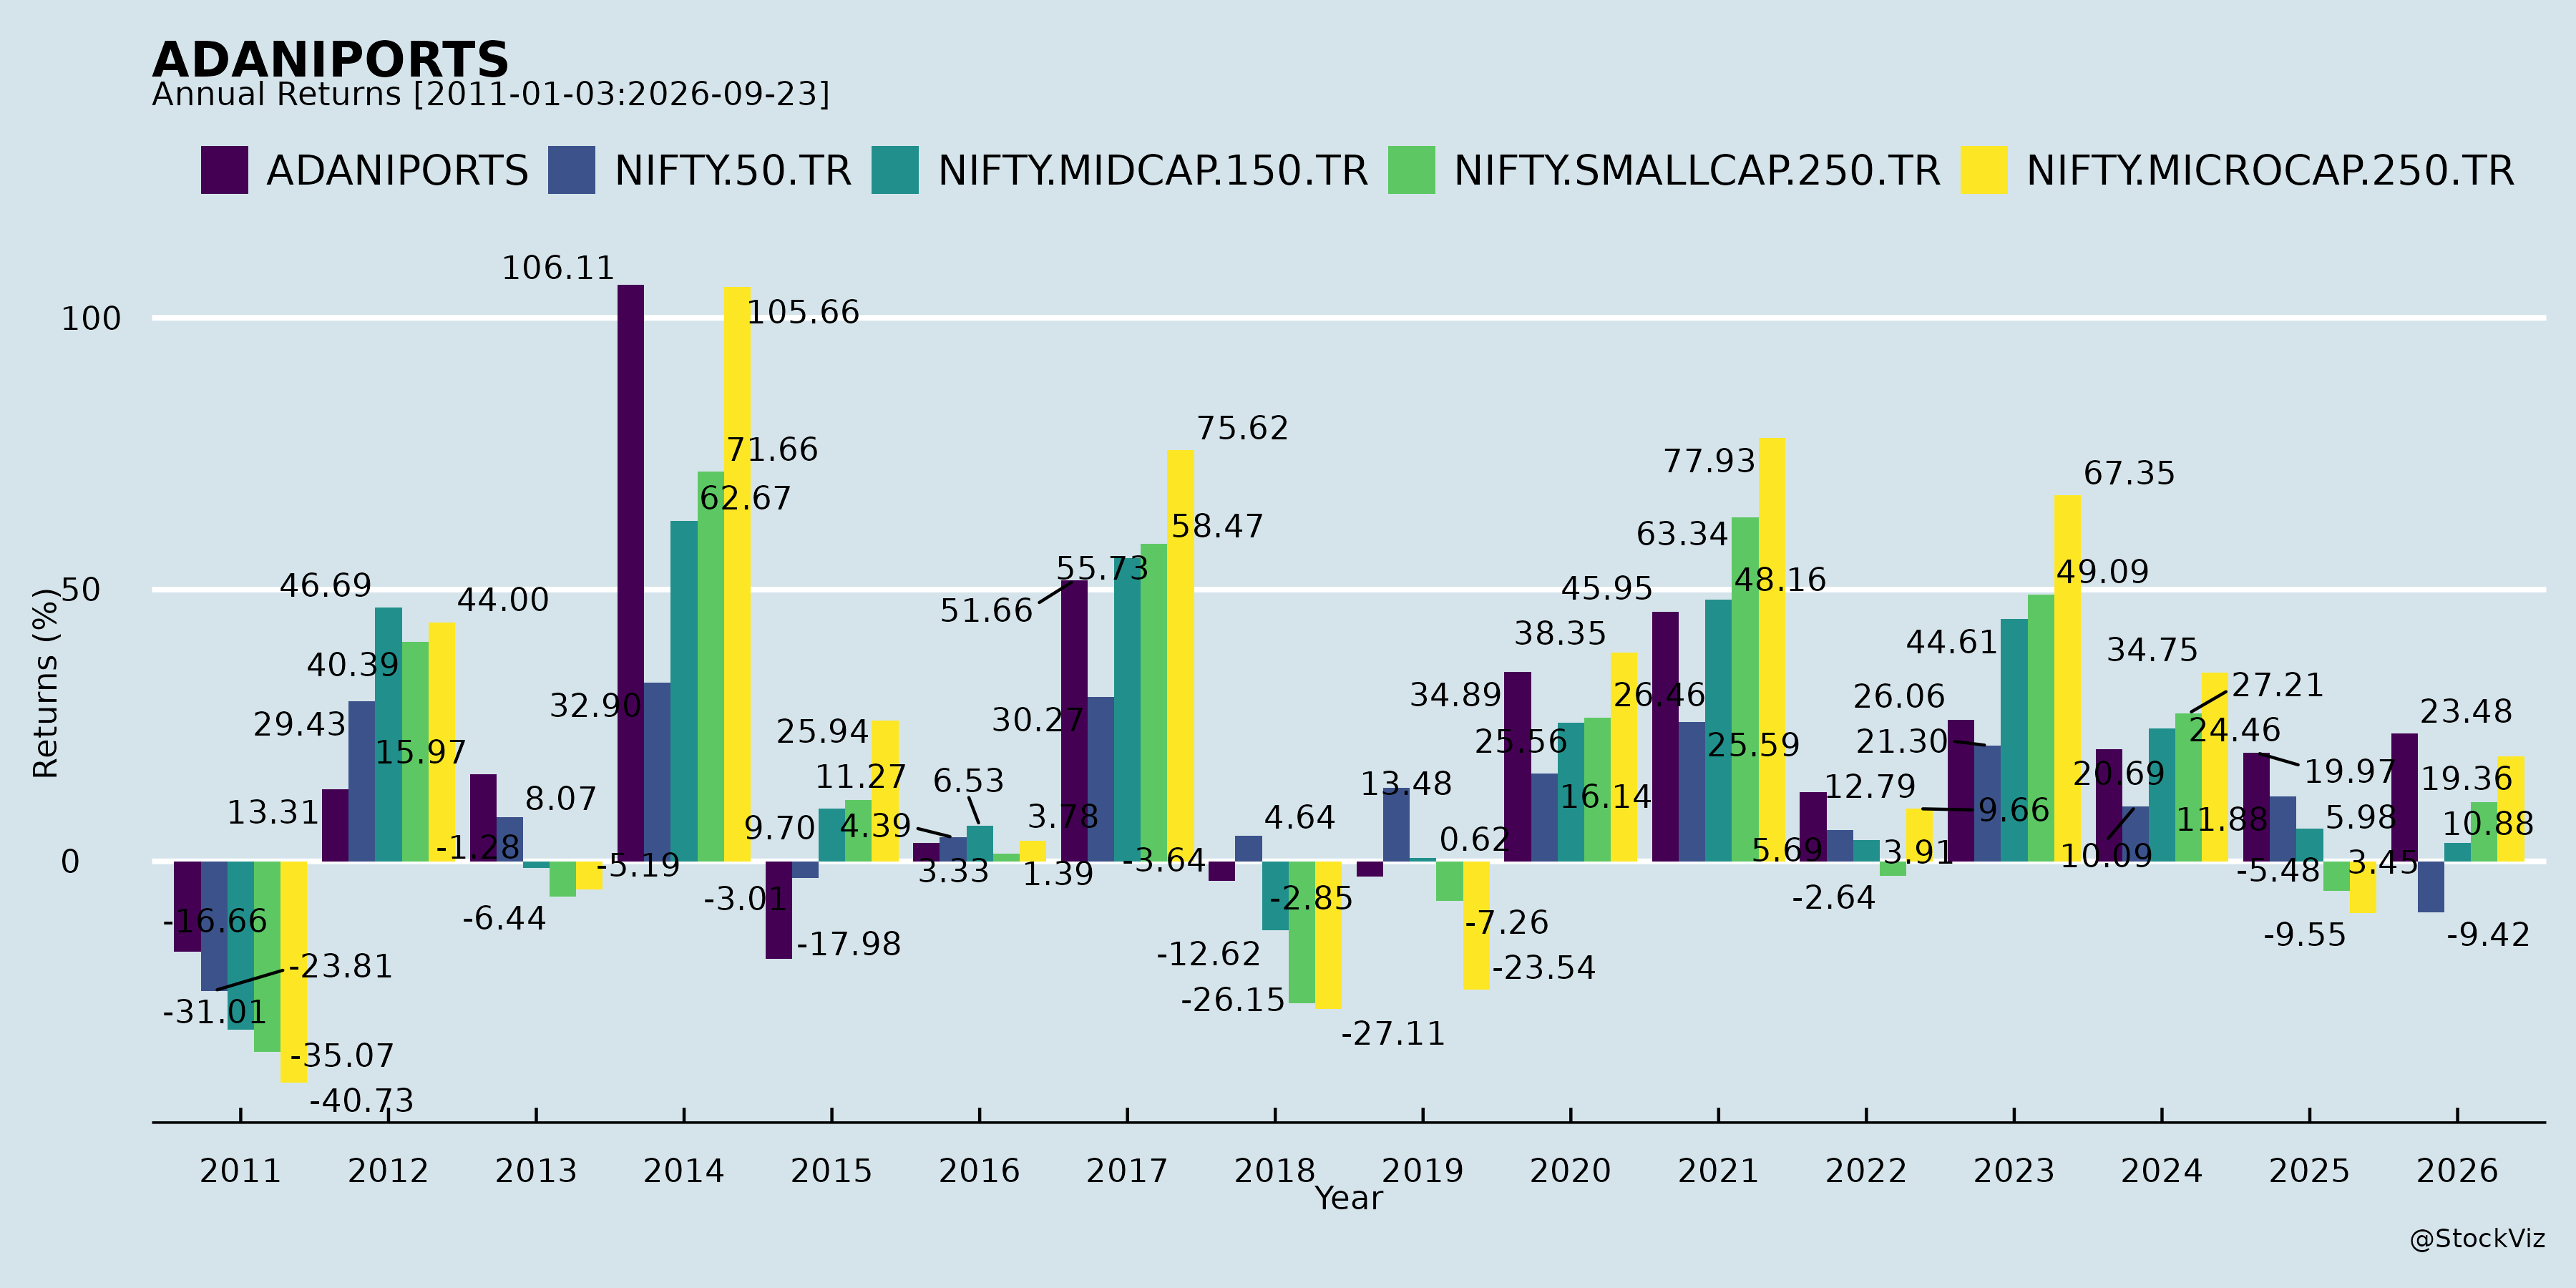
Annual Returns
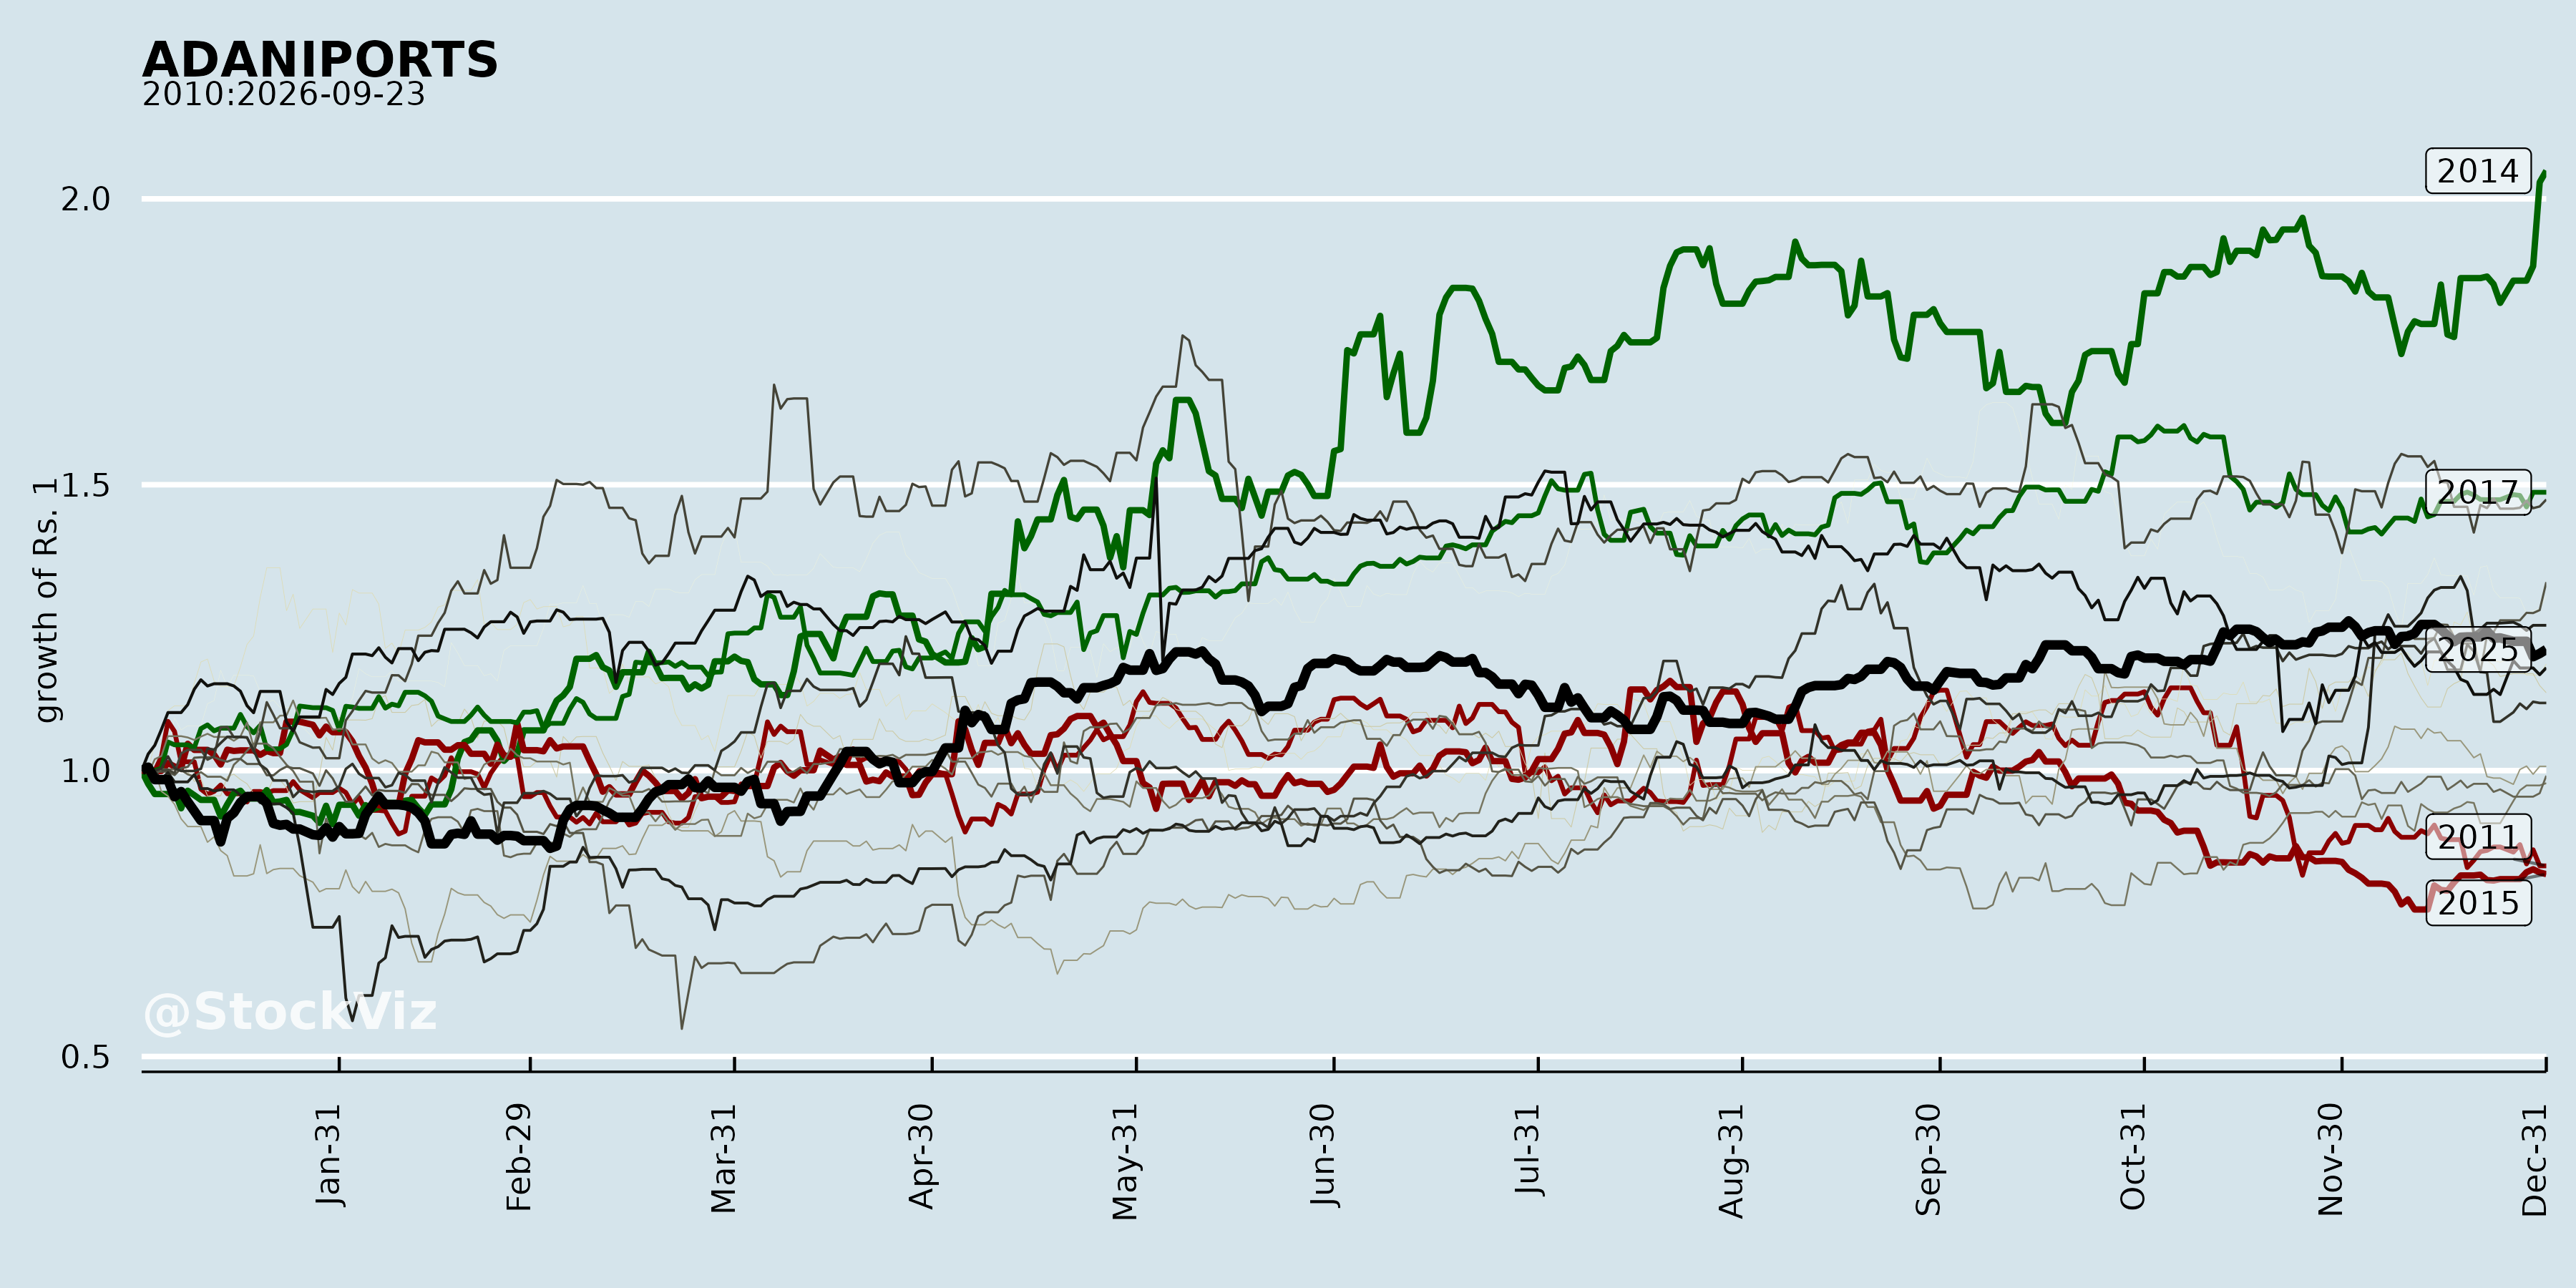
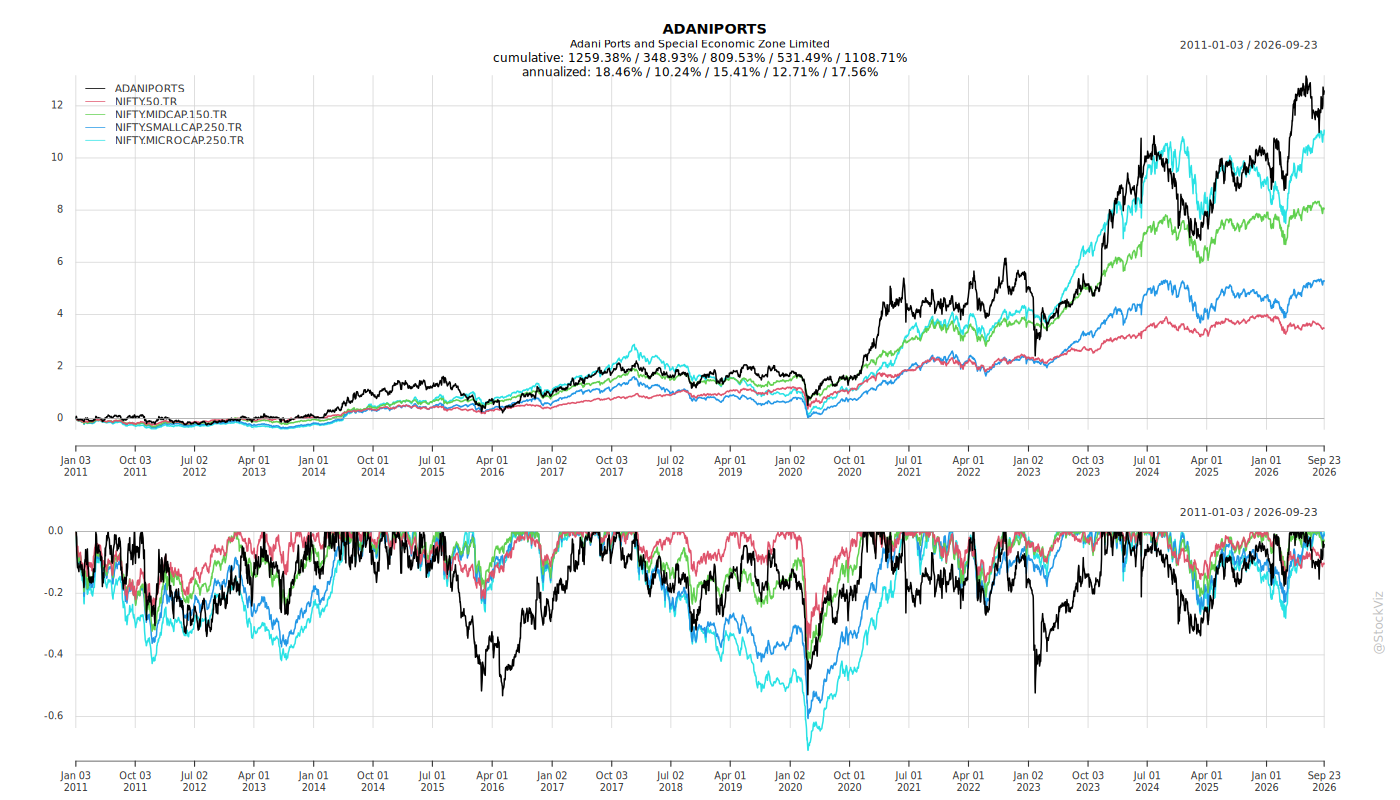
Cumulative Returns and Drawdowns
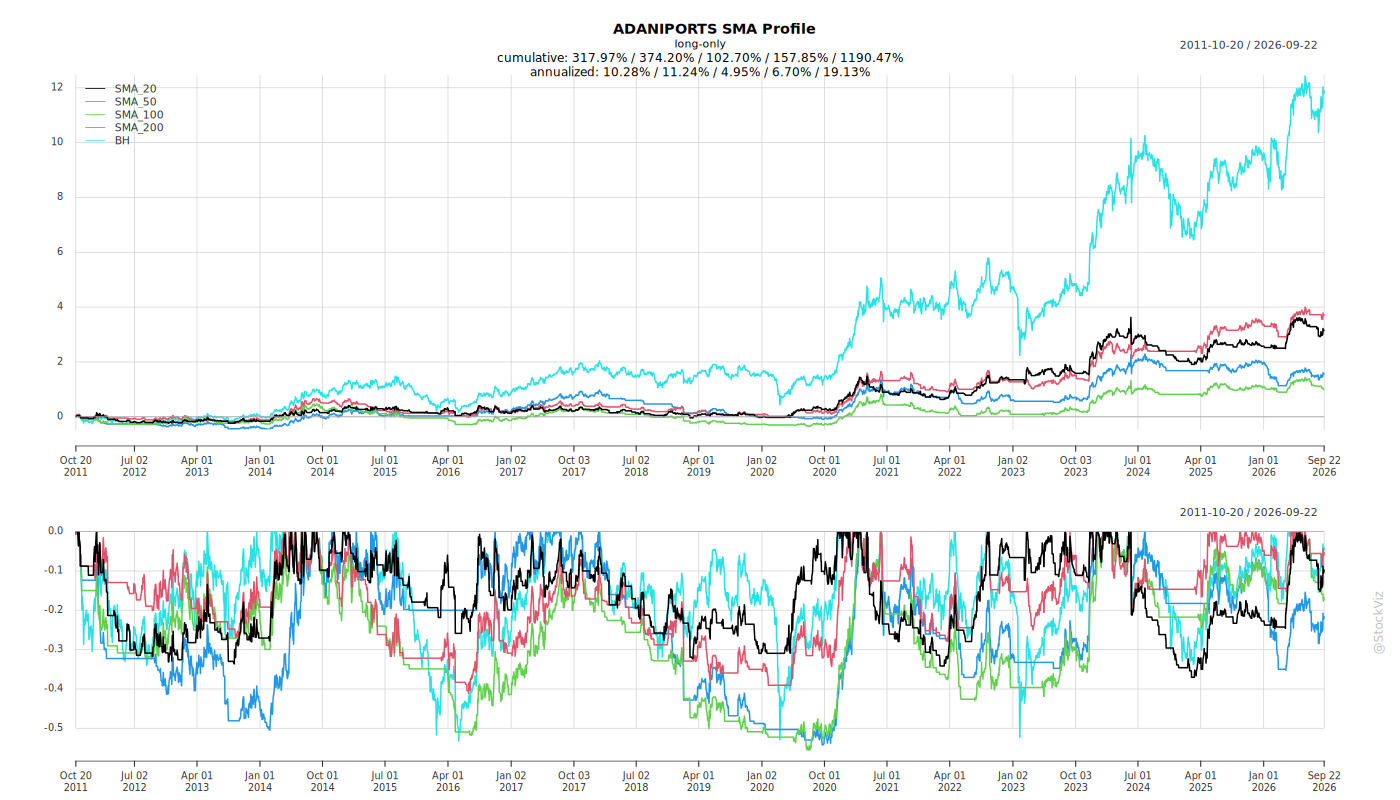
Fundamentals
Ownership
Margined
AI Summary
asof: 2026-09-14
ADANIPORTS: Q1 FY27 Announcements Summary
1. Headwinds and Challenges
- Logistics rail volumes under pressure: Container rail volume fell 19% YoY to 145,310 TEUs in Q1 FY27 (179,479 TEUs in Q1 FY26). The company attributes this to the ongoing Middle East crisis. GPWIS volume also declined 6.9% YoY (5.3 MMT vs. 5.7 MMT).
- Logistics growth stalled: Logistics revenue was nearly flat at ₹1,173 Cr (+0.3% YoY) and EBITDA rose only 3% YoY to ₹219 Cr.
- Port development & SEZ decline: Segment revenue fell 85% YoY to ₹36 Cr and EBITDA fell 75% YoY to ₹36 Cr.
- South Coast weakness: South Coast domestic volume declined 10% YoY to 28.3 MMT, with Krishnapatnam down 19% (13.4 MMT vs. 16.5 MMT) and Karaikal down 24% (3.1 MMT vs. 4.0 MMT).
- Coal volume decline: Domestic coal volumes fell to 38.4 MMT from 41.8 MMT, with Mundra coal down to 6.2 MMT from 7.1 MMT.
- Market share erosion: All-India cargo market share slipped to 27.6% (from 27.8%), and container cargo share slipped to 44.8% (from 45.2%).
- International port volume softness at Haifa: Haifa volume declined 24% YoY to 2.2 MMT (from 2.9 MMT).
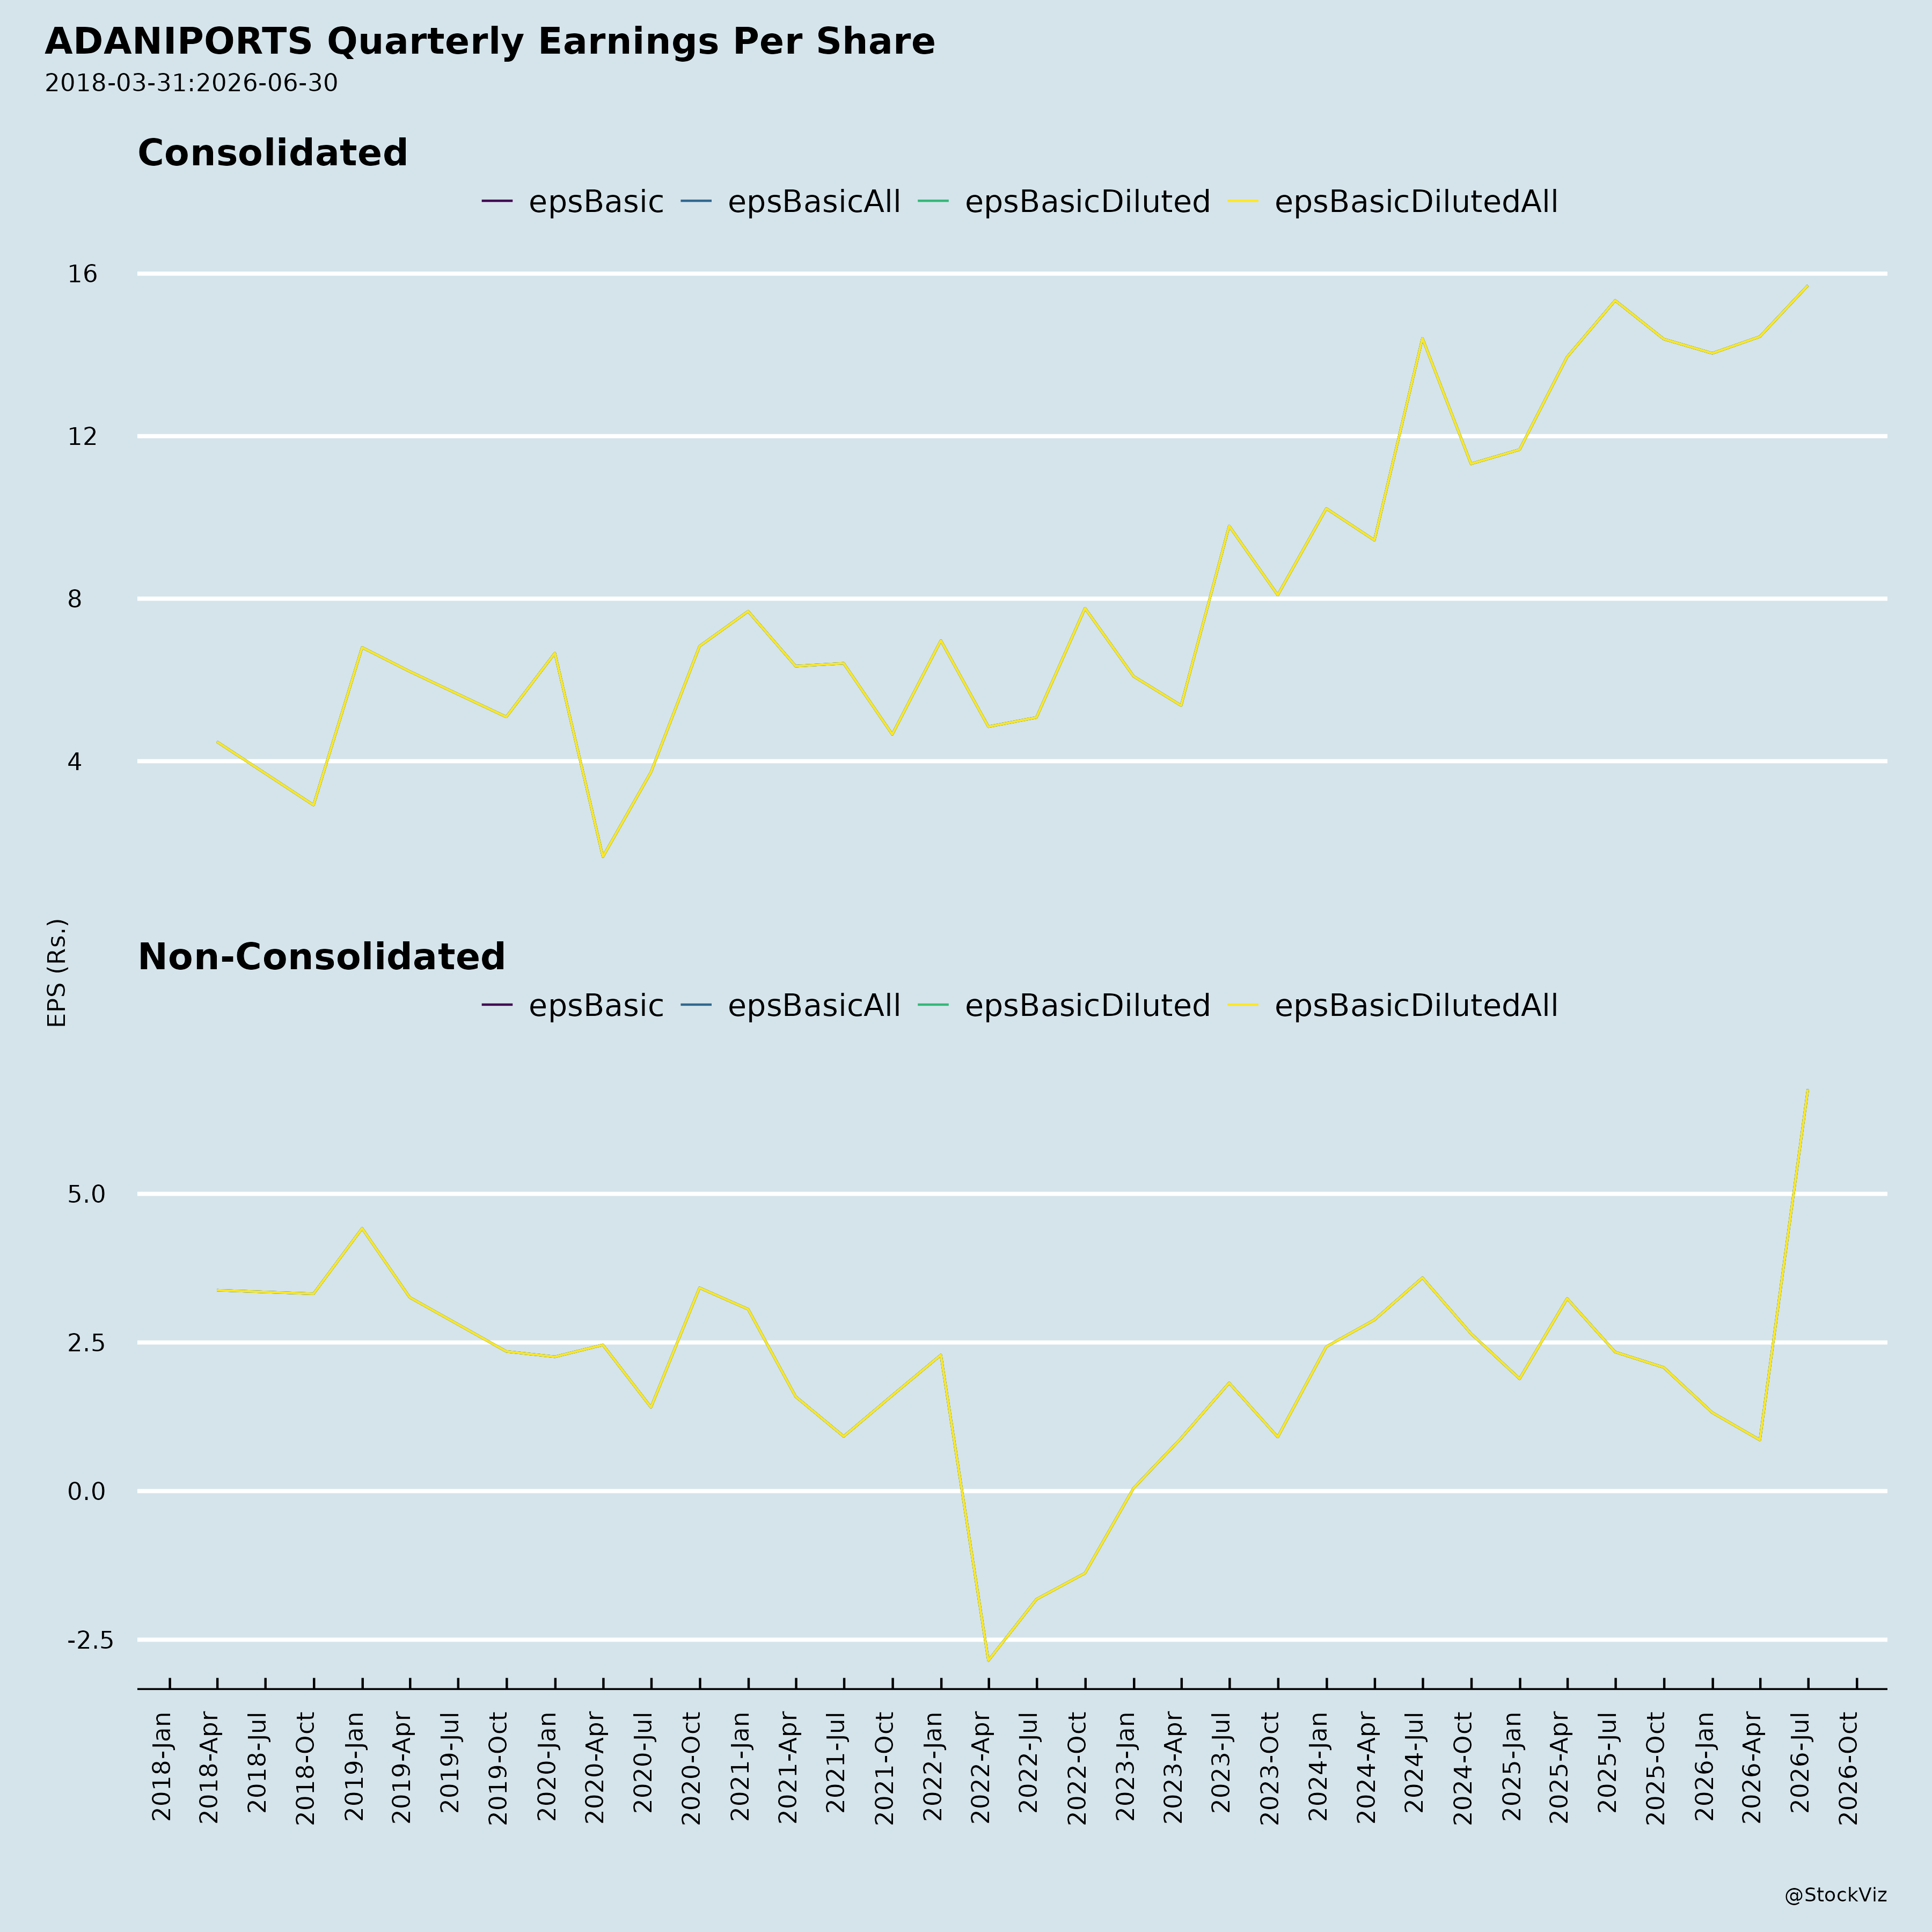
- PAT growth lagging EBITDA: PAT grew 10% YoY versus 19% EBITDA growth, with share of profit from JVs and associates swinging to a loss of ₹288 Cr from a profit of ₹142 Cr in FY26 (full-year comparison) and derivative losses of ₹360 Cr in Q1 FY27.
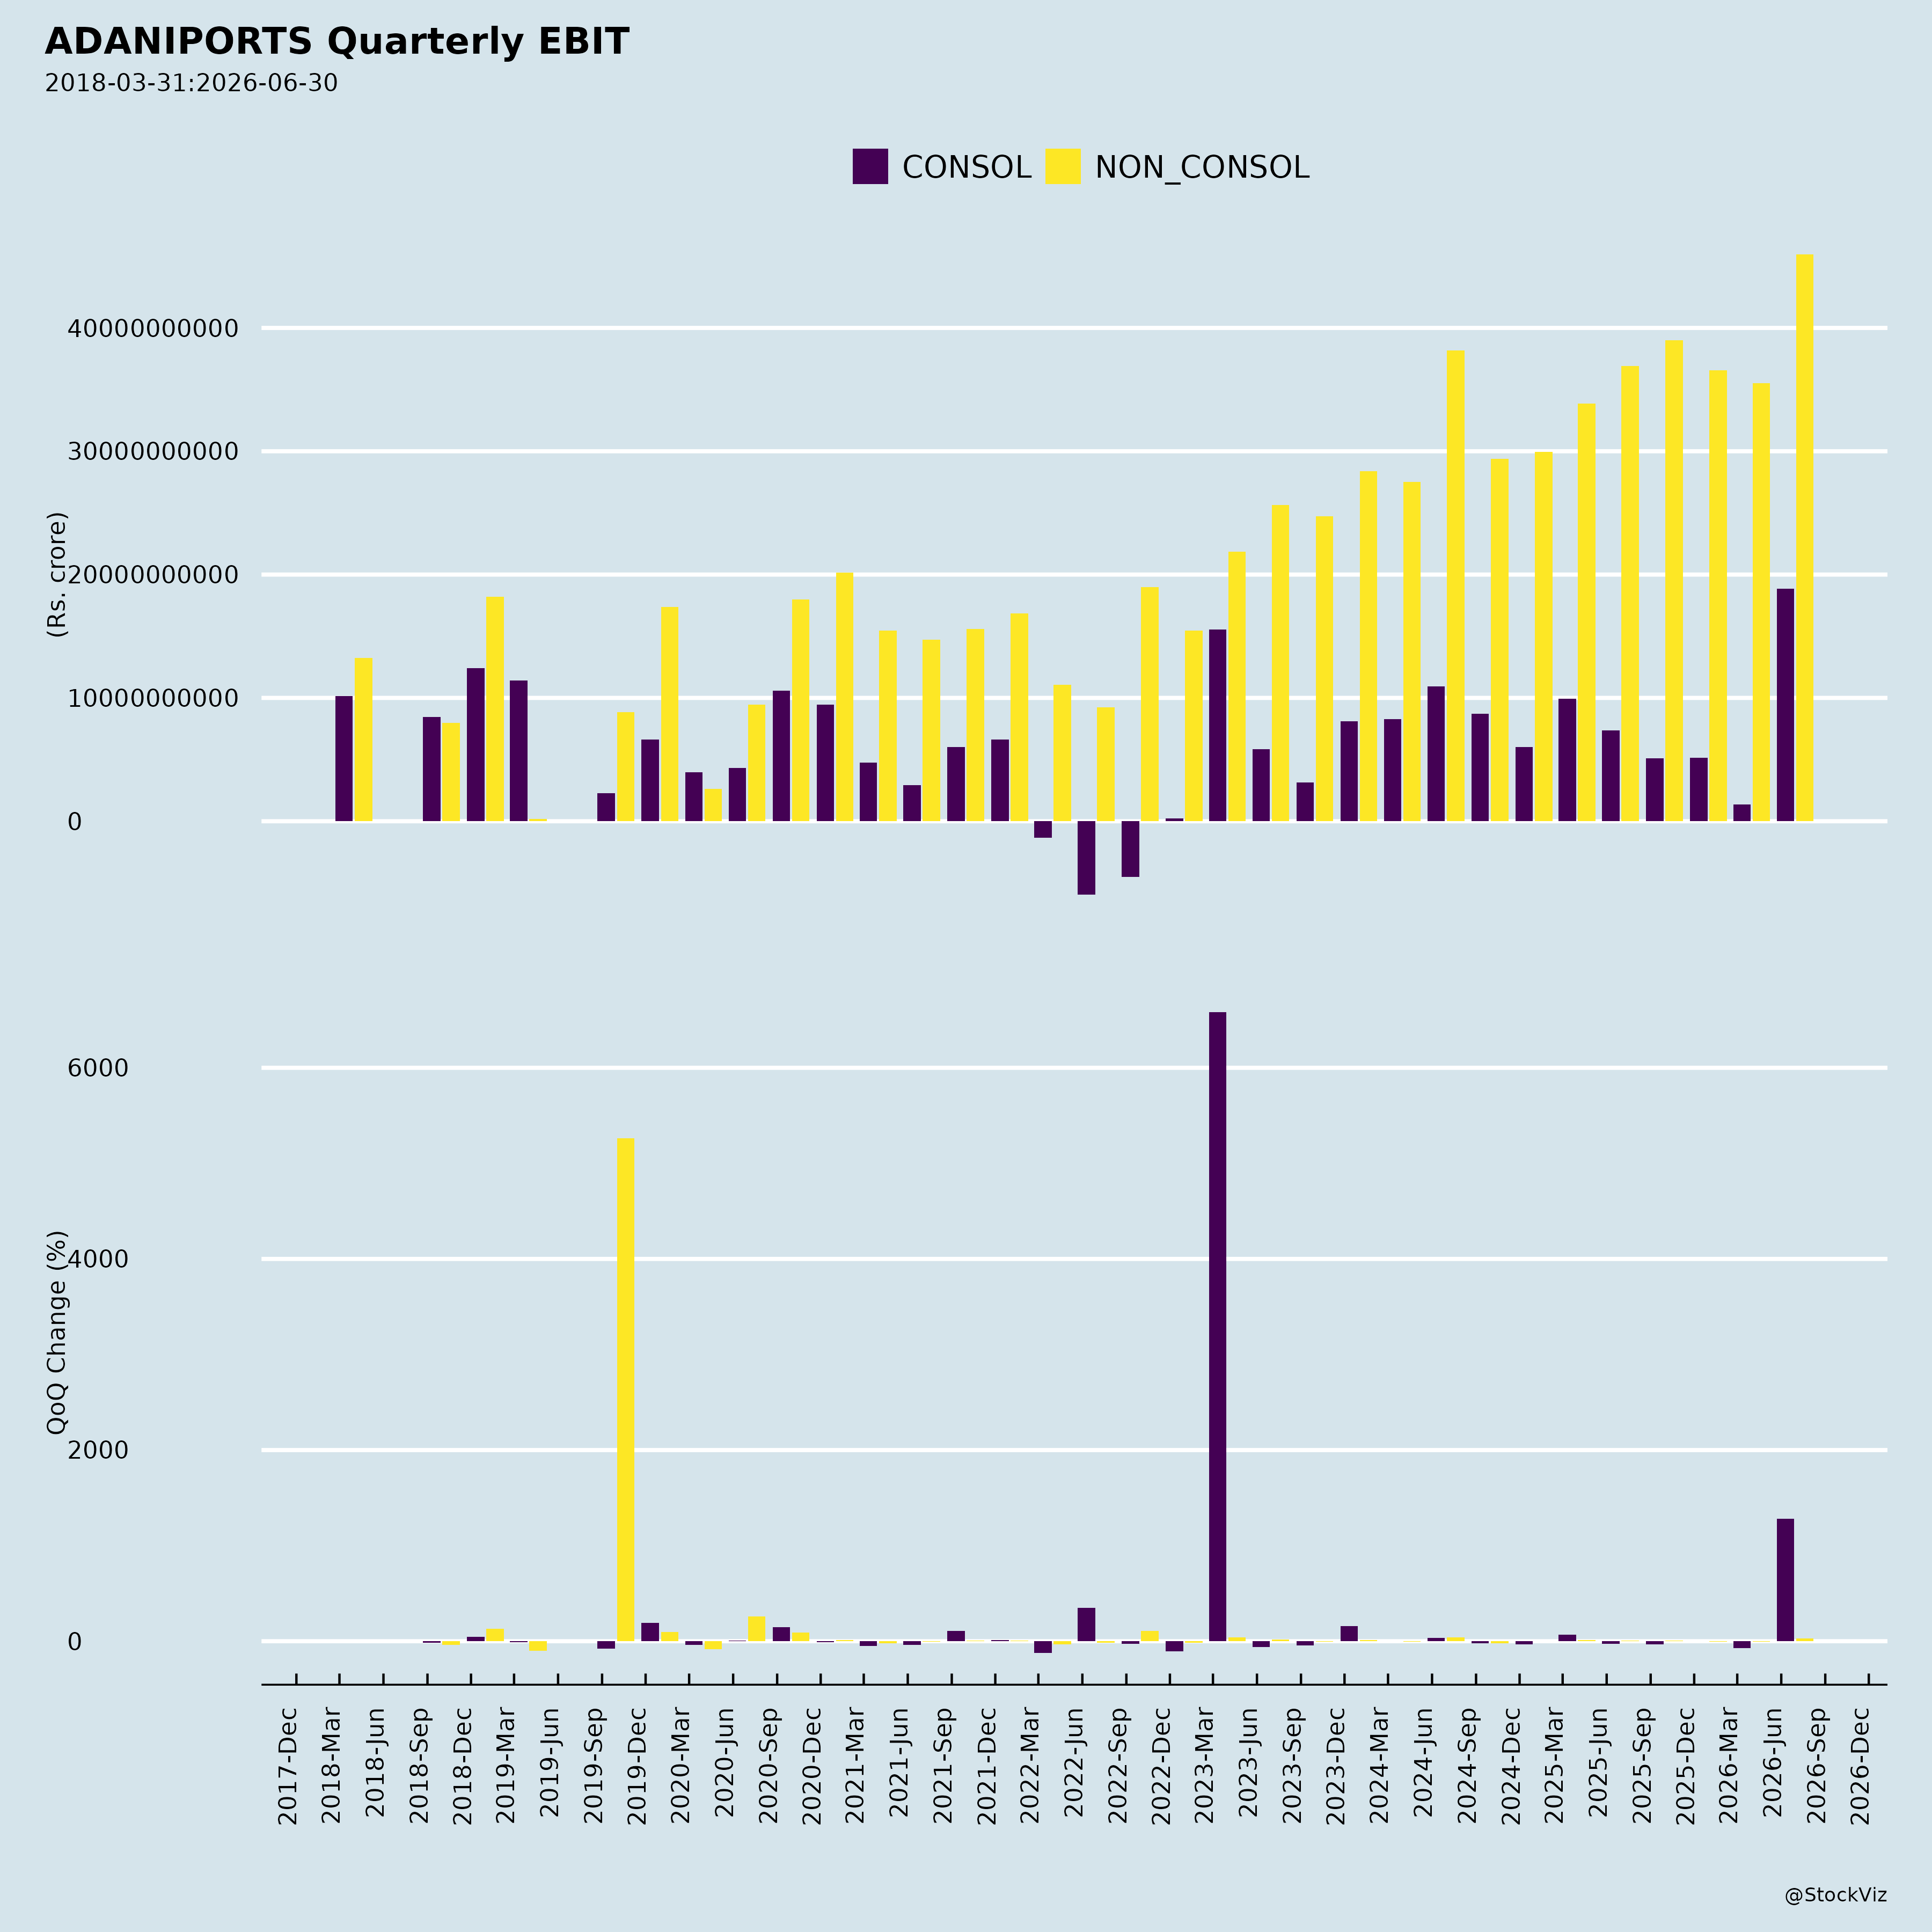
- Domestic port margin compression: Domestic ports EBITDA margin eased to 74% from 75%; South Coast margin fell to 67% from 70%, East Coast to 48% from 51%, and Others to 73% from 81%.
2. Tailwinds and Growth Prospects
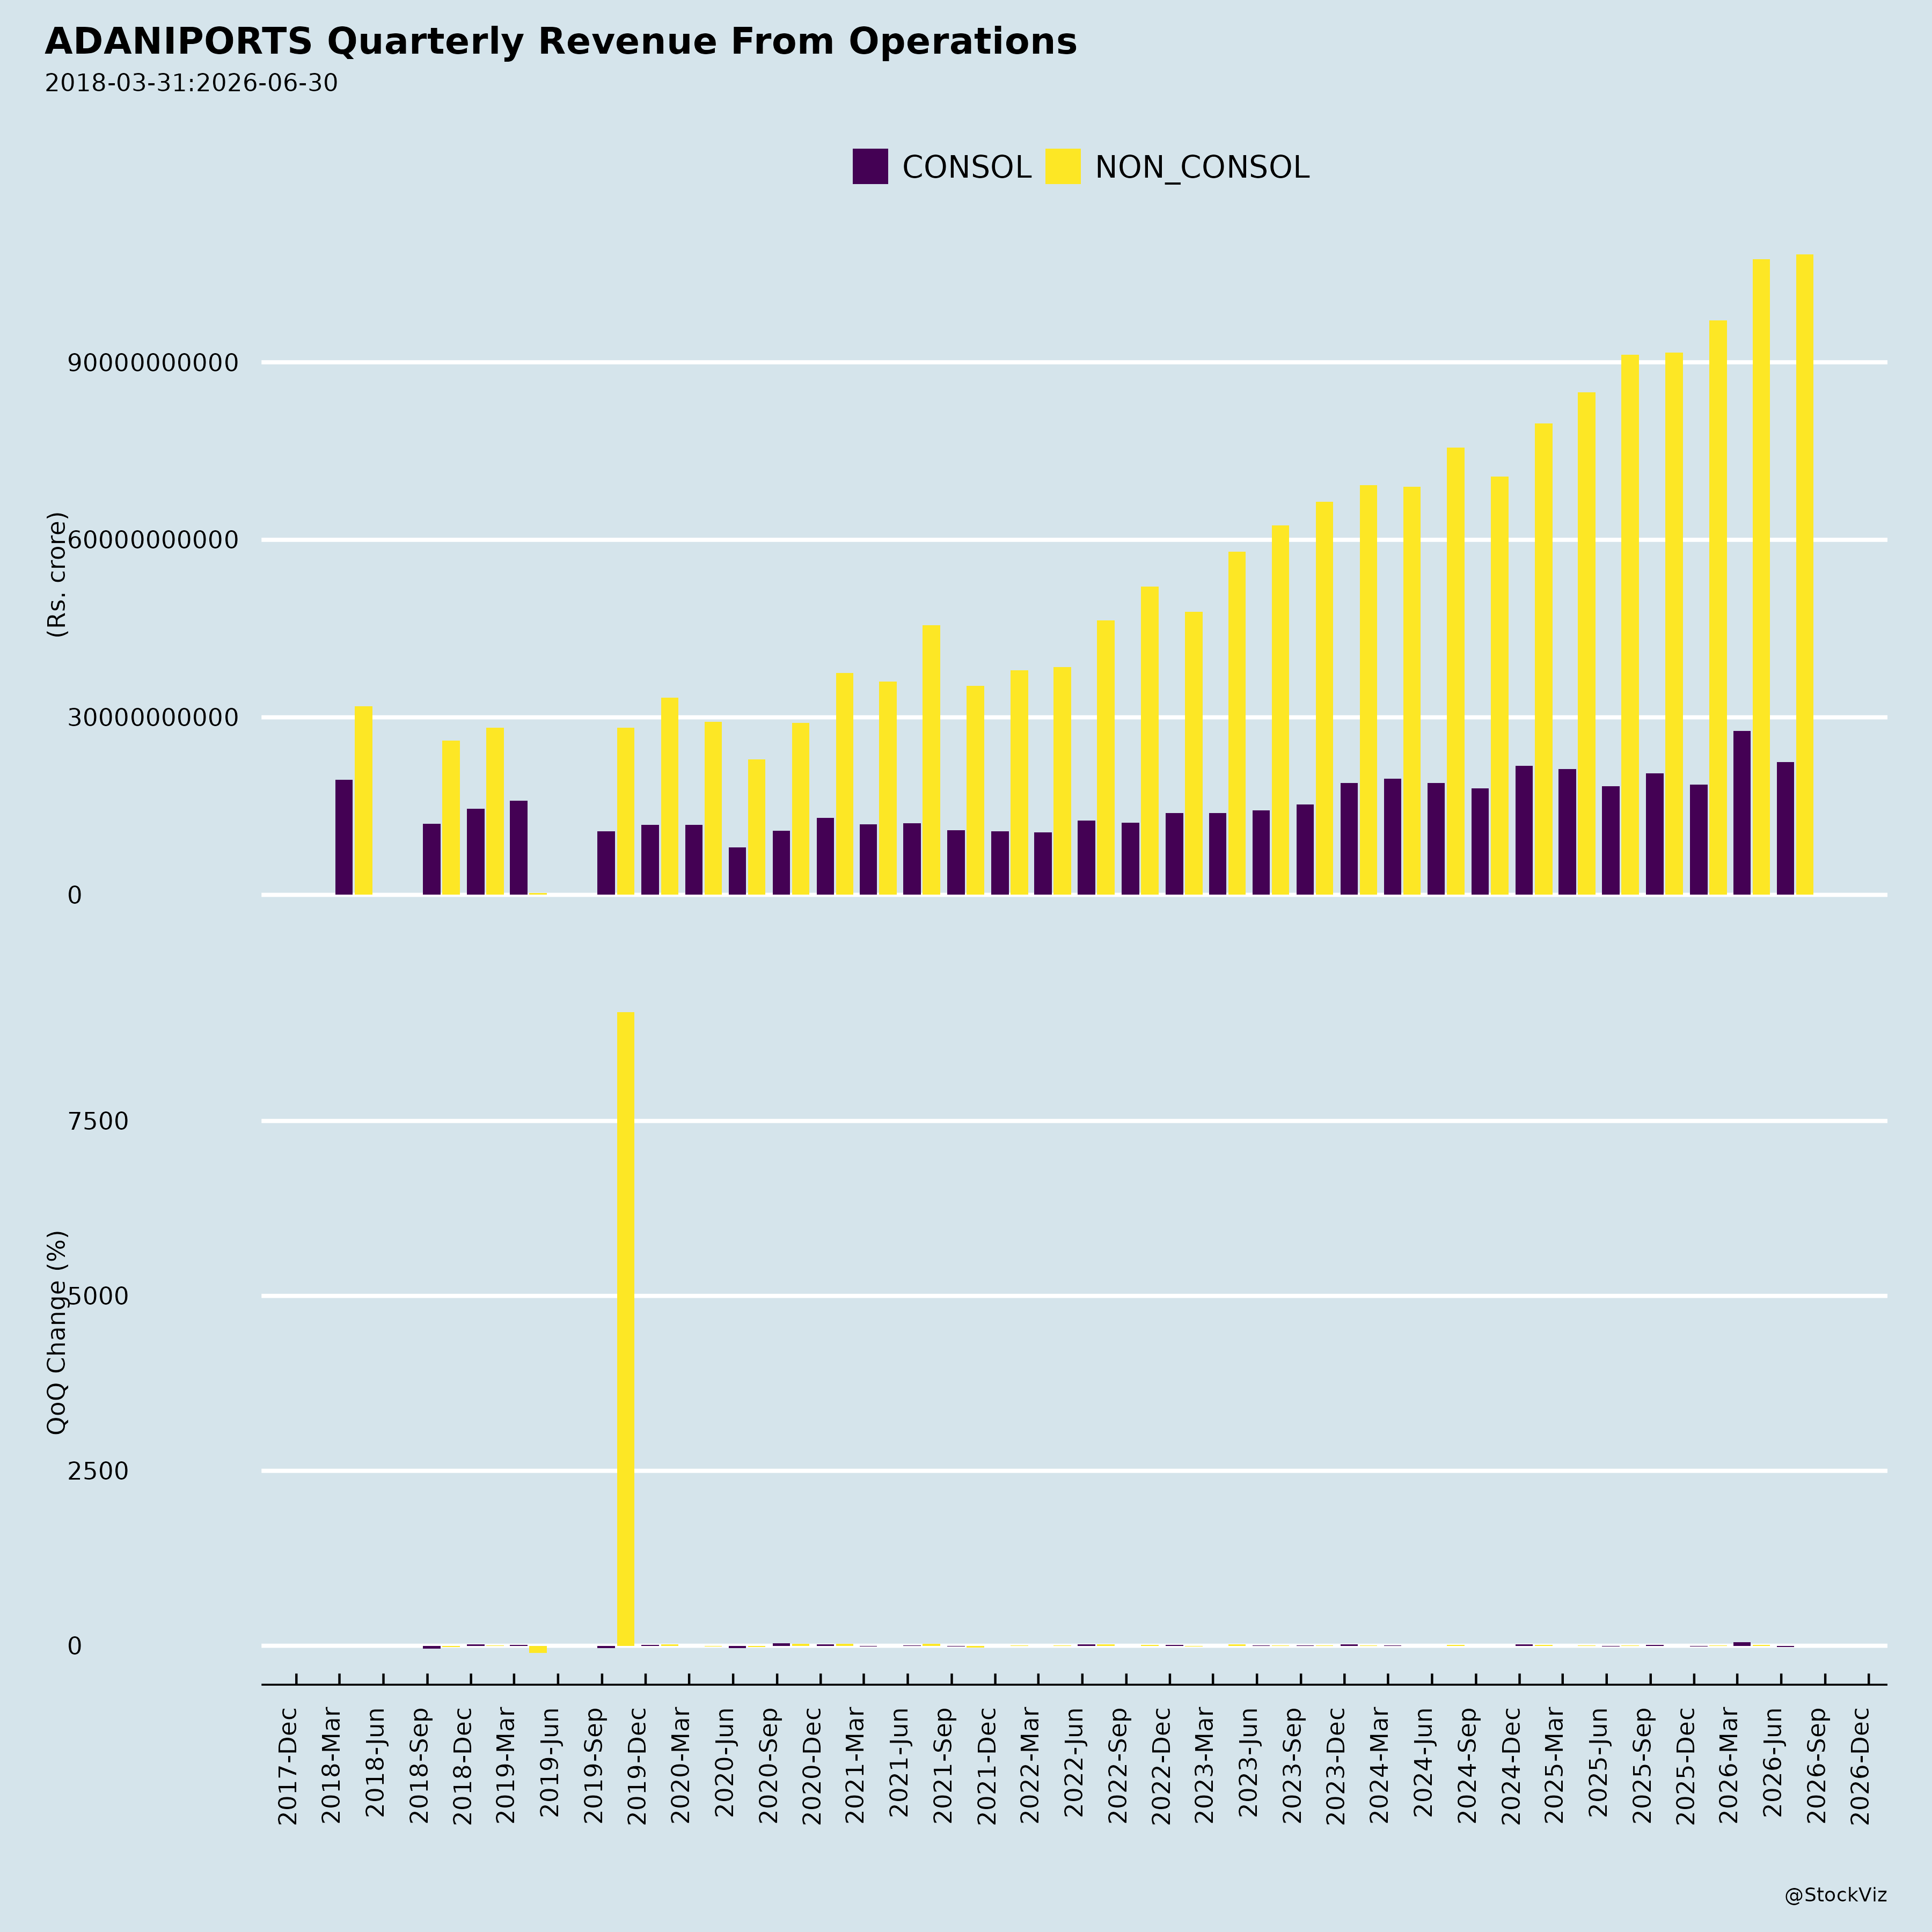
- Strong consolidated growth: Revenue rose 19% YoY to ₹10,821 Cr and EBITDA rose 19% YoY to ₹6,541 Cr in Q1 FY27.
- International ports scaling: Revenue up 80% YoY to ₹1,747 Cr and EBITDA up 256% YoY to ₹730 Cr, led by Australia and Colombo. International volumes rose to 22.8 MMT from 7.7 MMT. EBITDA margin expanded to 41.8% from 21.1%. Colombo revenue was up 5x YoY; Tanzania revenue up 36% YoY.
- Marine expansion: Revenue up 67% YoY to ₹901 Cr and EBITDA up 36% YoY to ₹404 Cr, supported by vessel additions (135 vs. 118) and European subsea expansion. New wins include a partnership with Oceaneering International for deepwater engineering in Europe and a 10-year contract for Argentina’s first LNG exports to India.
- Domestic ports resilience: Revenue up 12% YoY to ₹6,964 Cr with best-in-class 74% EBITDA margin, driven by volume growth (115.3 MMT vs. 112.9 MMT), better product mix, and higher realization.
- Capacity expansion program: Domestic capacity at 653 MMT as of June 30, 2026, targeted to reach 1,000 MMT by December 2030.
- Vizhinjam partnership: TiL (MSC group) to invest USD 1.397bn for 49% in Adani Vizhinjam Port, its third collaboration with MSC.
- Digital/AI capacity unlock: Partnership with Kaleris with up to $100 million investment across two phases, targeting unlocking of 91 MMT additional capacity (~10% of installed capacity) by 2030.
- Inland logistics expansion: Acquisition of Jaypee Fertilizers & Industries Ltd. for ₹1,500 Cr, adding ~243 acres in Kanpur for logistics parks and warehousing.
- Agri silo expansion: 11 new operational locations commenced in Q1 FY27, reaching 37 facilities with ~1.88 MMT cumulative storage capacity.
- Credit profile strengthening: S&P upgraded long-term issuer and senior unsecured notes ratings to ‘BBB’ from ‘BBB-’ with Stable outlook; JCR assigned ‘A-/Stable’ in January 2026; CARE and ICRA reaffirmed ‘AAA’.
- Operational records: Mundra handled India’s largest single-vessel car export shipment (6,548 cars); Vizhinjam handled 7 vessels of LOA 399m+ in May 2026 and crossed 1,000 vessel calls in under two years; Gangavaram achieved highest-ever quarterly volume of 9.64 MMT.
- Ambition 2031 framework: FY26-31E targets of 19% revenue CAGR and 18% EBITDA CAGR, with 1% RoCE improvement annually.
3. Key Risks
- Geopolitical exposure: The Middle East crisis is explicitly cited as impacting logistics rail volumes; international operations span Australia, Colombo, Israel, and Tanzania.
- Commodity concentration: Coal remains a significant cargo category (48.4 MMT total in Q1 FY27), exposing volumes to energy transition and commodity cycles.
- JV performance volatility: Share of profit from JVs and associates was negative ₹288 Cr in Q1 FY27; Dhamra LNG JV reported a PAT loss of ₹41 Cr and AECTPL a loss of ₹20 Cr.
- Derivative and forex swings: Derivative loss of ₹360 Cr in Q1 FY27 versus a gain of ₹246 Cr in FY25; foreign exchange gain of ₹268 Cr in Q1 FY27 versus losses in prior years.
- Execution risk on capacity targets: The 1,000 MMT by 2030 and 91 MMT unlock by 2030 depend on the Kaleris partnership and ongoing expansion programs.
- Volume share pressure: Domestic volume growth of 2% lagged overall APSEZ volume growth of 14%, with non-Mundra volumes declining 2%.
- Debt levels: Gross debt at ₹56,776 Cr with net debt/EBITDA at 1.9x, against a policy ceiling of up to 2.5x.
4. Management Guidance vs. Observed Performance
| Metric | FY27 Guidance | Q1 FY27 Reported |
|---|---|---|
| Revenue | ₹43,000–45,000 Cr | ₹10,821 Cr |
| EBITDA | ₹25,000–26,000 Cr | ₹6,541 Cr |
| Net debt to EBITDA | Policy up to 2.5x | 1.9x (proforma 1.8x using TTM NQXT EBITDA) |
- Q1 FY27 revenue of ₹10,821 Cr represents approximately 24–25% of the full-year guidance midpoint; EBITDA of ₹6,541 Cr represents approximately 26% of the guidance midpoint.
- Net debt/EBITDA at 1.9x is within the stated policy ceiling of up to 2.5x, and proforma at 1.8x.
- Management stated confidence in achieving “Ambition 2031,” supported by the domestic capacity expansion program targeting 1,000 MMT by 2030, a growing international portfolio, and a scaling logistics ecosystem.
- The CEO characterized International Ports, Marine, and Logistics as having “transitioned decisively from scale-up to scale-value,” though Logistics revenue growth of 0.3% YoY and rail volume decline of 19% indicate mixed progress against that characterization in Q1 FY27.
- The FY26-31E framework targets 19% revenue CAGR and 18% EBITDA CAGR; Q1 FY27 delivered 19% growth on both revenue and EBITDA, in line with the stated CAGR trajectory.
- Average debt maturity was 5.1 years as of June 30, 2026, versus 5.2 years as of June 30, 2025, indicating a marginally shorter maturity profile.
Broker Narrative
The narrative shifted from a domestic deleveraging and volume-growth story with lower capex, DFC normalisation, and Concor as catalysts to a broader ports-plus-logistics expansion story driven by international ports, marine, and a large FY31 capex vision. The early focus on free cash flow and asset utilisation gradually gave way to scale and long-term capacity targets, while the risk framing moved from Exim/DFC delays to geopolitics, margin contraction, and scaling risks. Buy calls stayed constant even as the 2026 reports began delivering flat/negative actual returns.
Fears that came true
- The early Exim trade slowdown fear materialised by Q1FY27, when domestic port volumes grew only 2% YoY and container rail TEUs fell to 145,310 from 179,479, coinciding with flat/negative actual returns.
- The margin-pressure risk flagged after Haifa consolidation re-emerged, with consolidated PAT margins contracting 388 bps YoY to 31% in Q1FY27.
Optimism that failed
- The expectation of lower capex and improved free cash flow did not hold, as the FY31 target came with a ₹90,000–100,000 crore capex plan.
- The integrated logistics platform did not make cargo sticky enough to withstand the slowdown, as container rail volumes fell sharply in Q1FY27.
- The anticipated inorganic CTO boost via Concor did not materialise, and the later international expansion came through other assets like NQXT Australia and Colombo.
Broker Timeline
2 broker calls · 2024-12-02 to 2026-06-30
Copyright © 2023 SAS Data Analytics Pvt. Ltd. All rights reserved.