ABB
Equity Metrics
November 16, 2026
ABB India Limited
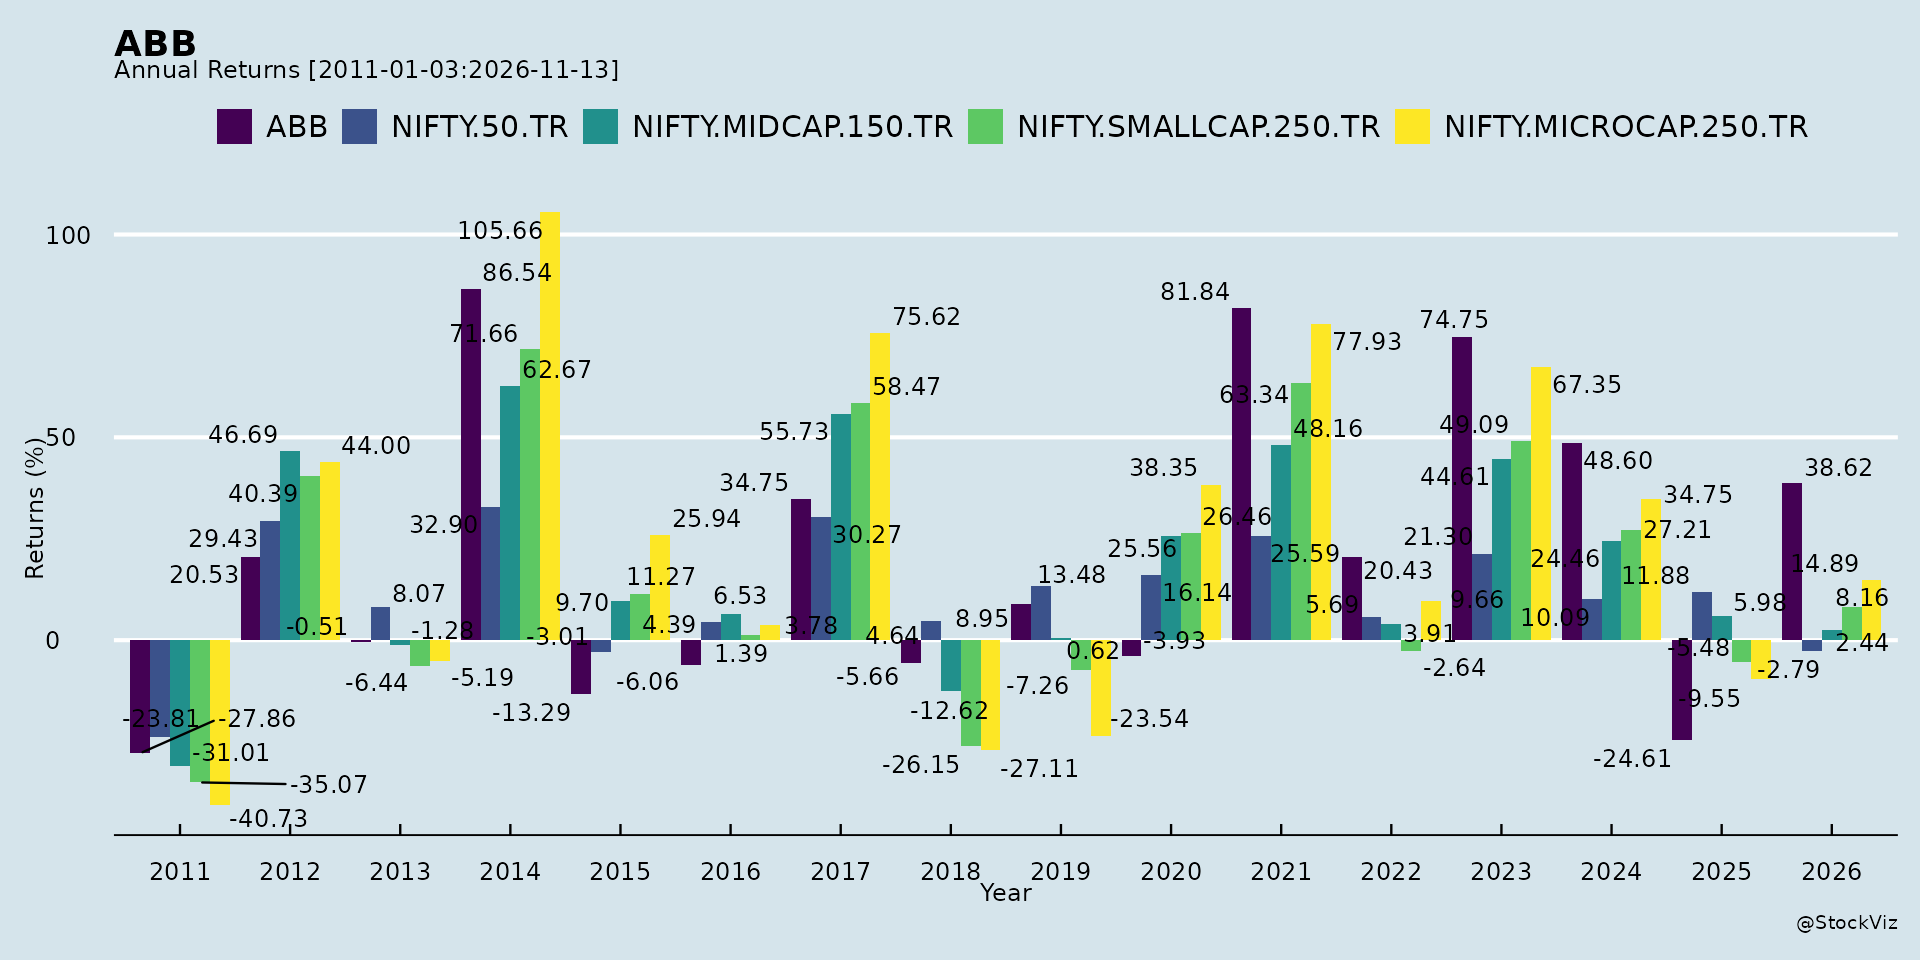
Annual Returns
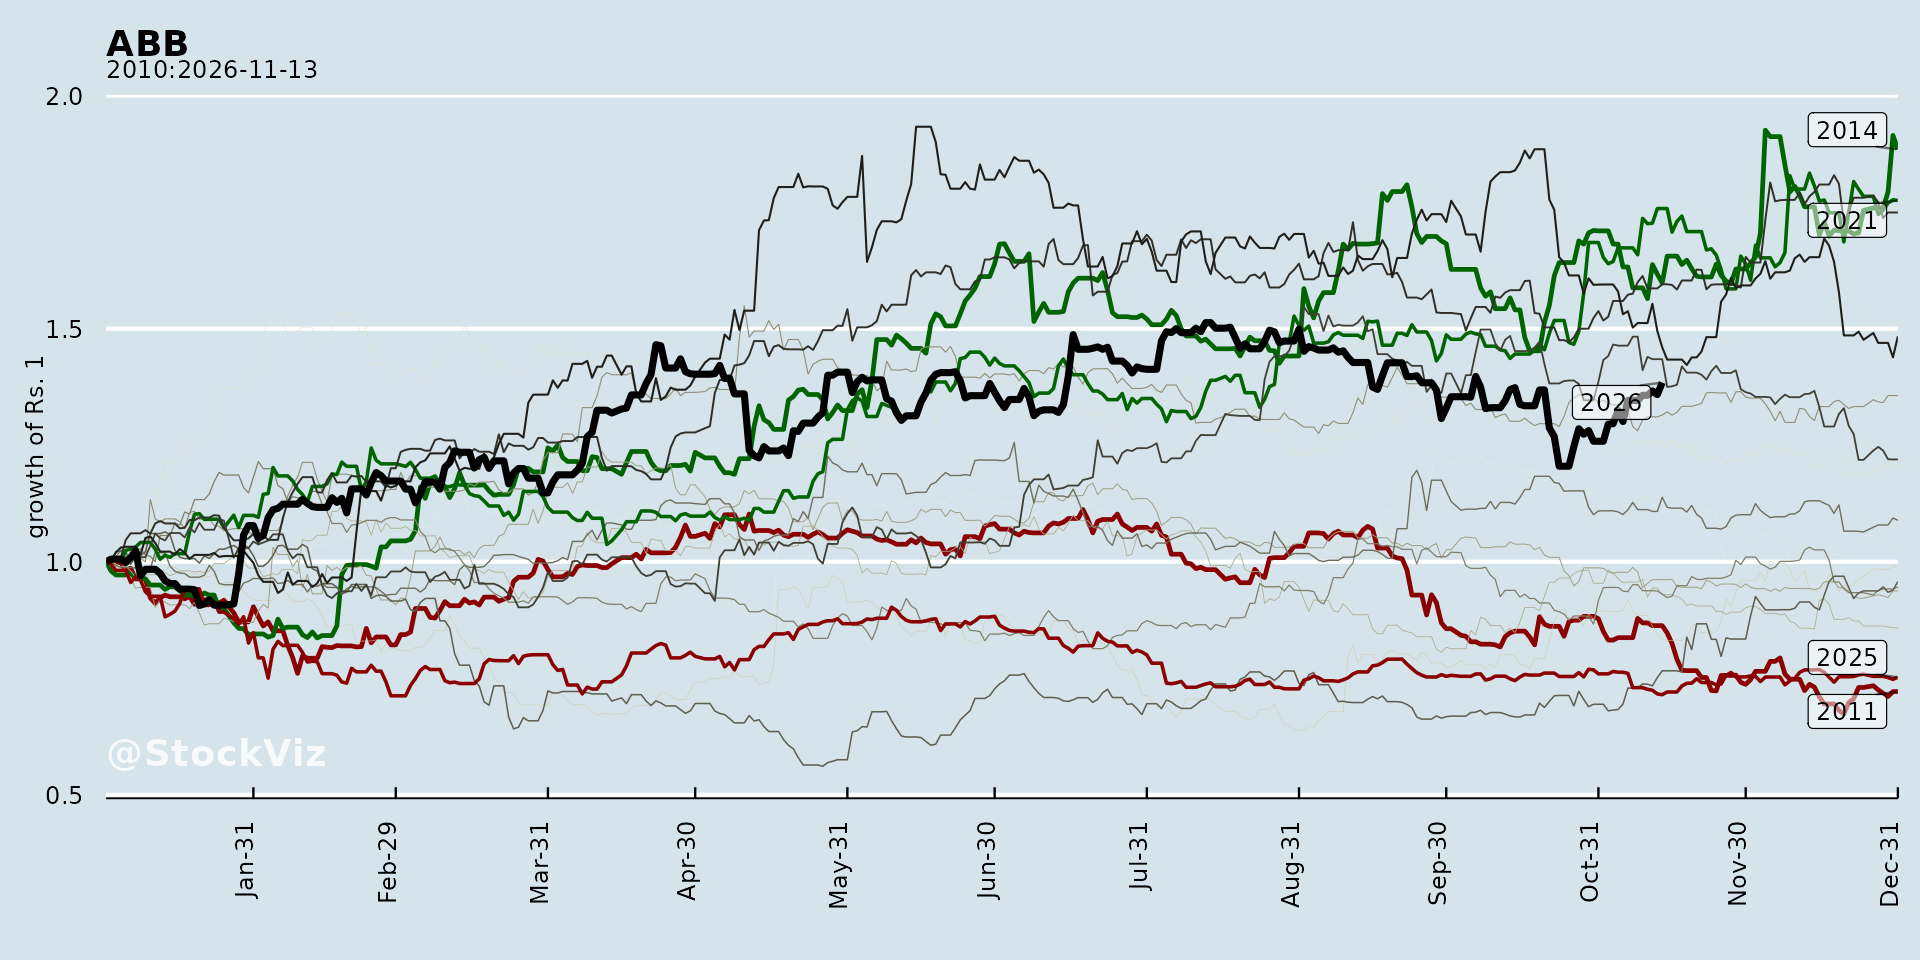
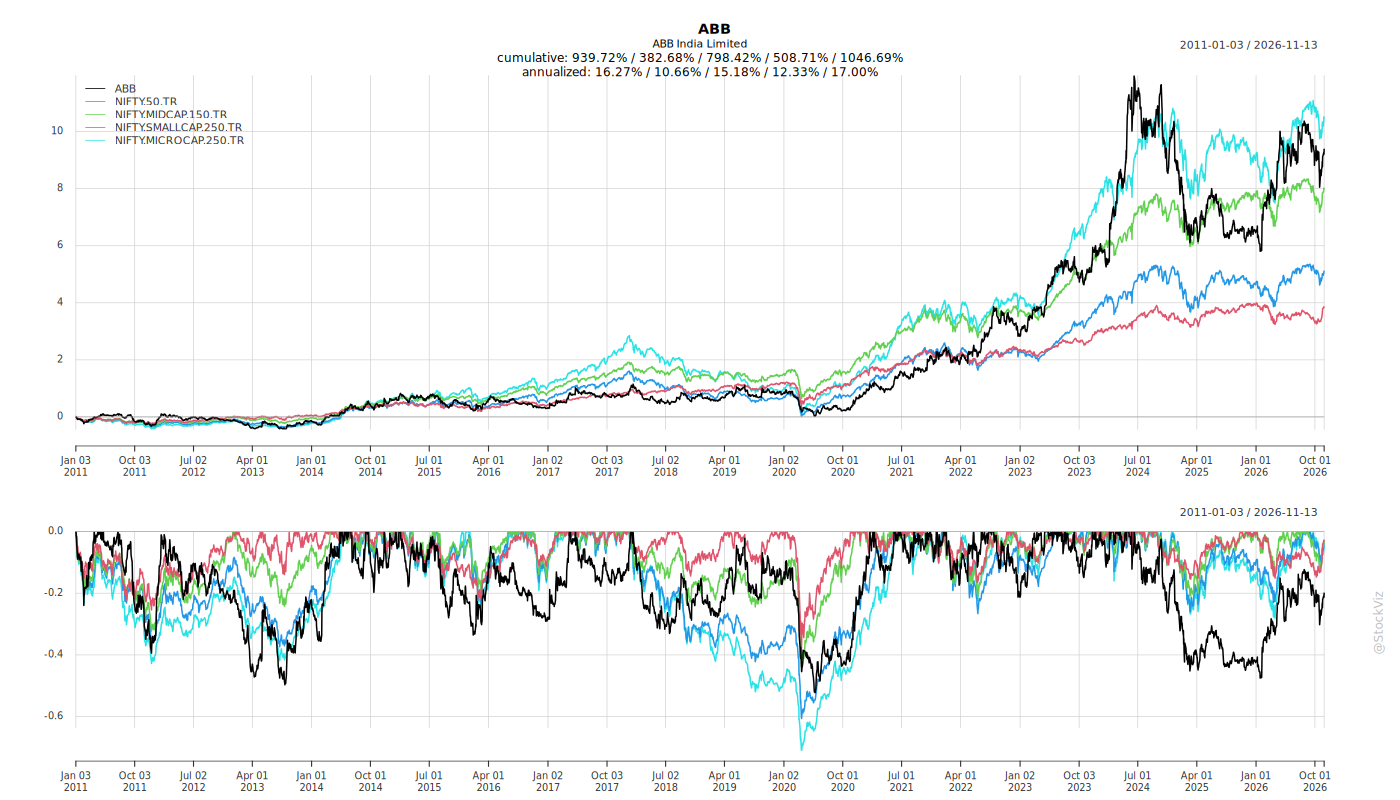
Cumulative Returns and Drawdowns
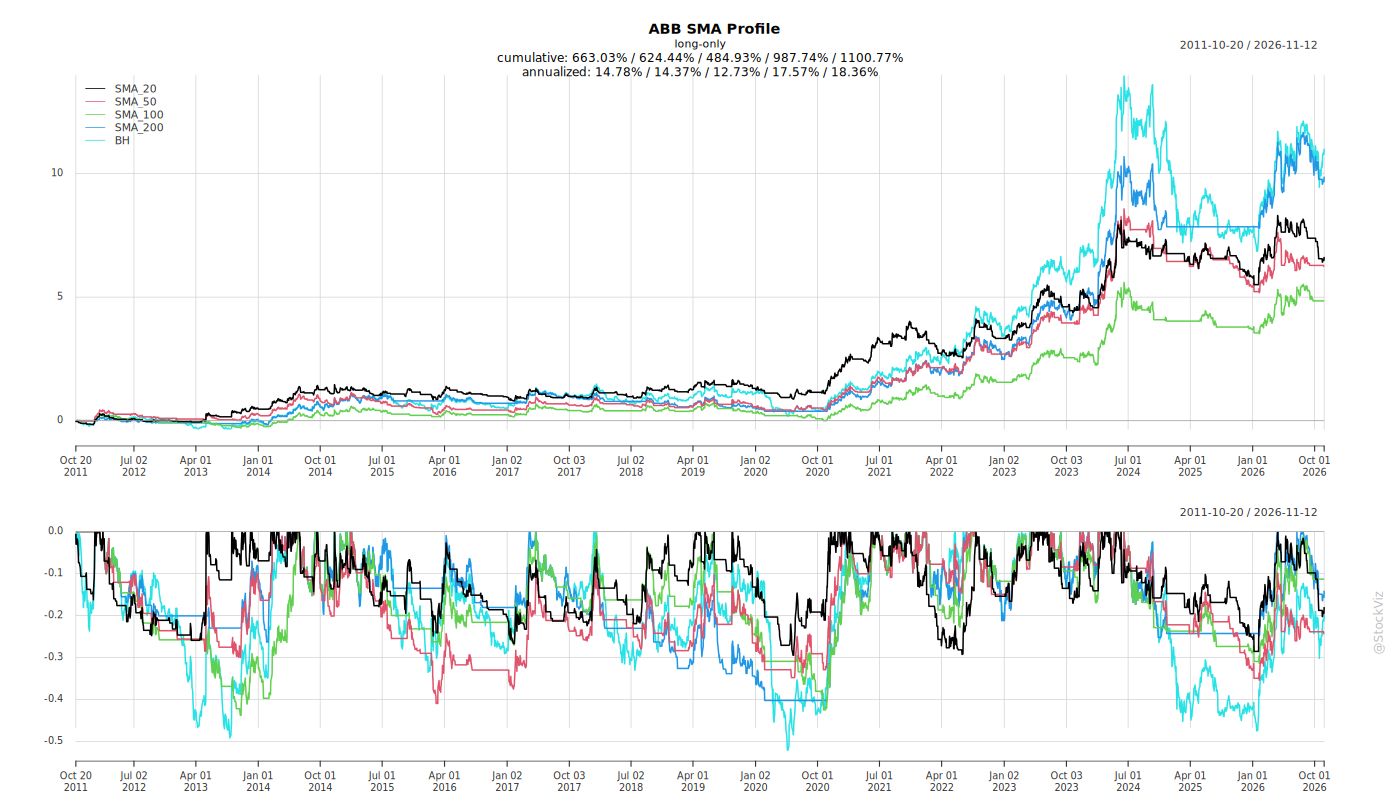
Fundamentals
Ownership
Margined
AI Summary
asof: 2026-09-14
Headwinds and Challenges
Commodity and currency pressure. Material cost rose to 62.9% of revenue in Q2 CY2026, compared with 60.2% in Q2 CY2025 and 61.3% in Q1 CY2026. Management attributed this to hardening copper and silver prices, rupee depreciation, and revenue mix. The presentation notes that balancing pricing against market share has become more challenging due to inflationary pressures and expanded industry capacity, intensifying competition.
Lag in passing on price increases. Two price lists were taken to the market in Electrification, and management stated that acceptance has been challenging but improving as customers recognise the copper and silver content in products. In Distribution Solutions, roughly 60% of the business is flow business where revised price lists have been passed on, while system business is bid on an L1/reverse-auction basis where price pass-through is harder. Management explicitly noted a timing lag between cost increases and market price revisions.
Forex volatility and mark-to-market movements. Profitability was impacted by mark-to-market movements and forex volatility. The Q2 CY2026 versus Q2 CY2025 comparison shows exchange and commodity variation (net) of INR 3 crore versus INR 55 crore, and the profit walk attributes a 1.6% benefit to the absence of the prior-year high forex impact. PBT grew 8% despite Operational EBITA growing 23%.
Export softness and West Asia disruption. Exports were 13% of revenue in the quarter versus 17% in the prior-year comparable period. Management stated that the West Asia crisis caused missed revenues in Q1 that spilled into Q2, affecting both export and domestic revenues because imported materials and feeder-factory inputs were disrupted. Motion saw a holdback in West Asia exports in the initial part of the quarter.
Automation cyclicality and backlog decline. Automation order backlog stood at INR 2,224 crore, down 1% year-on-year. Management described orders as cyclical and said performance “could have been still better.” Automation revenue grew 7% to INR 524 crore, with at least 30% from services.
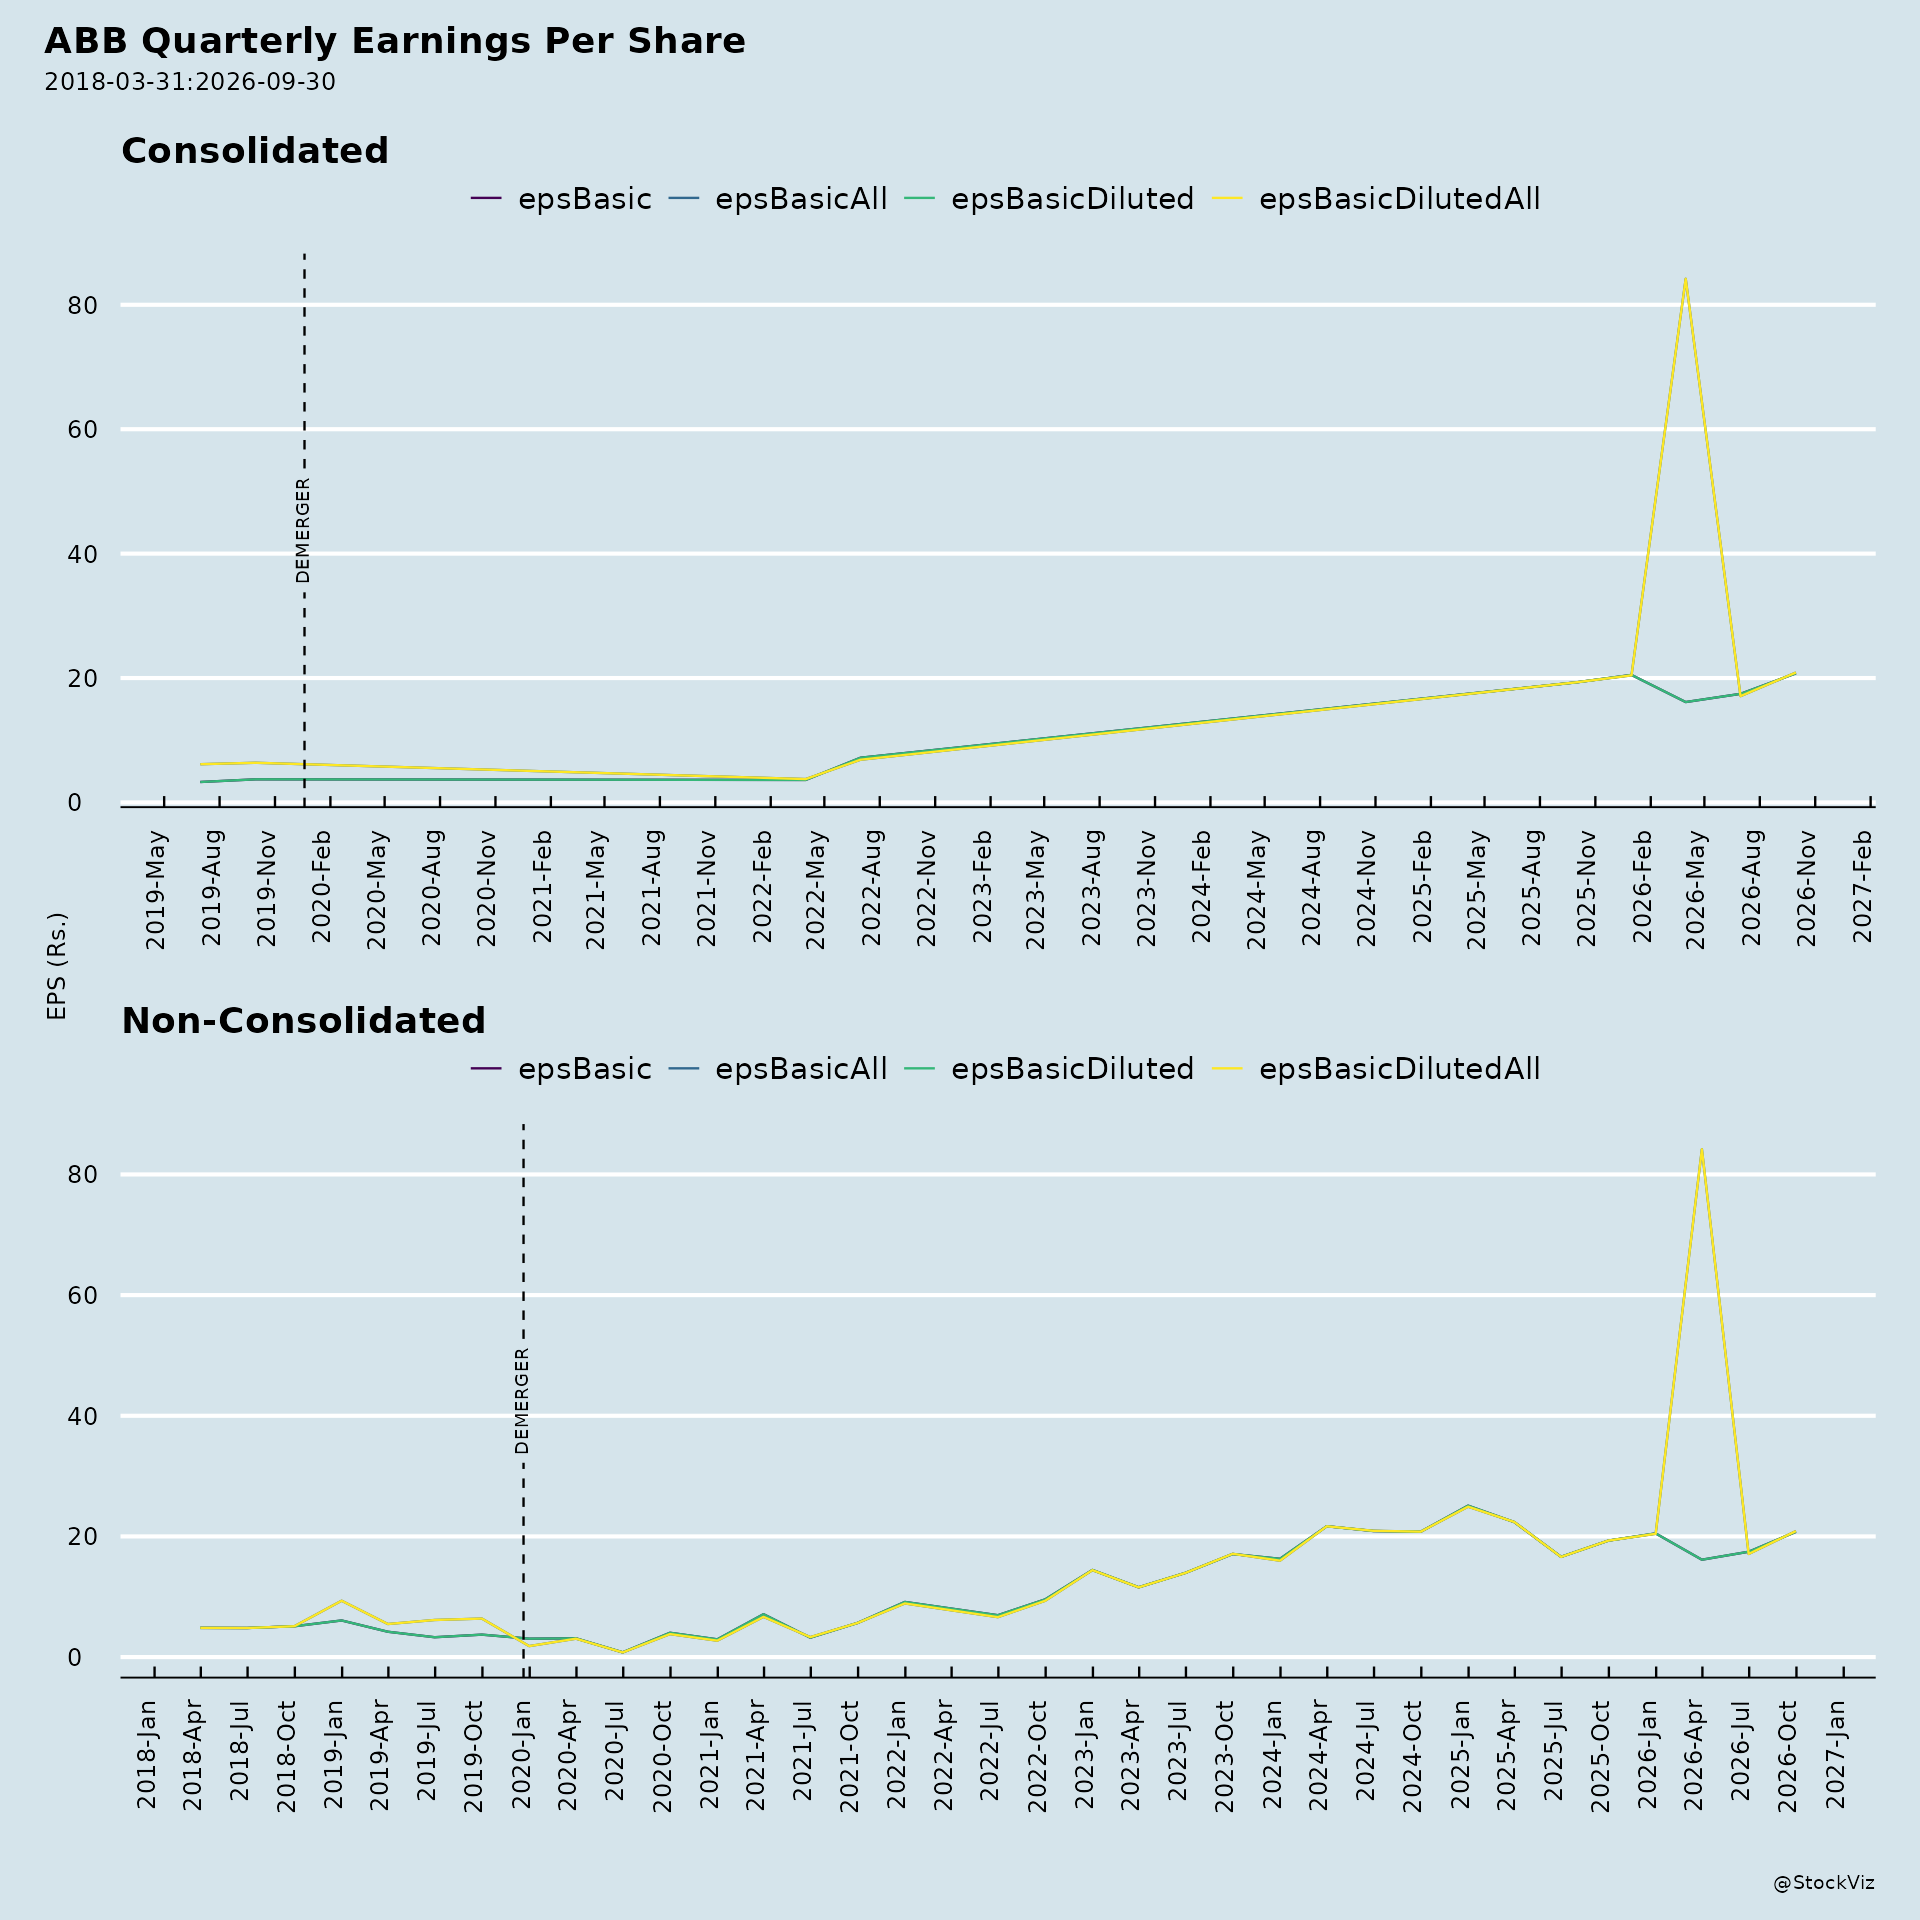
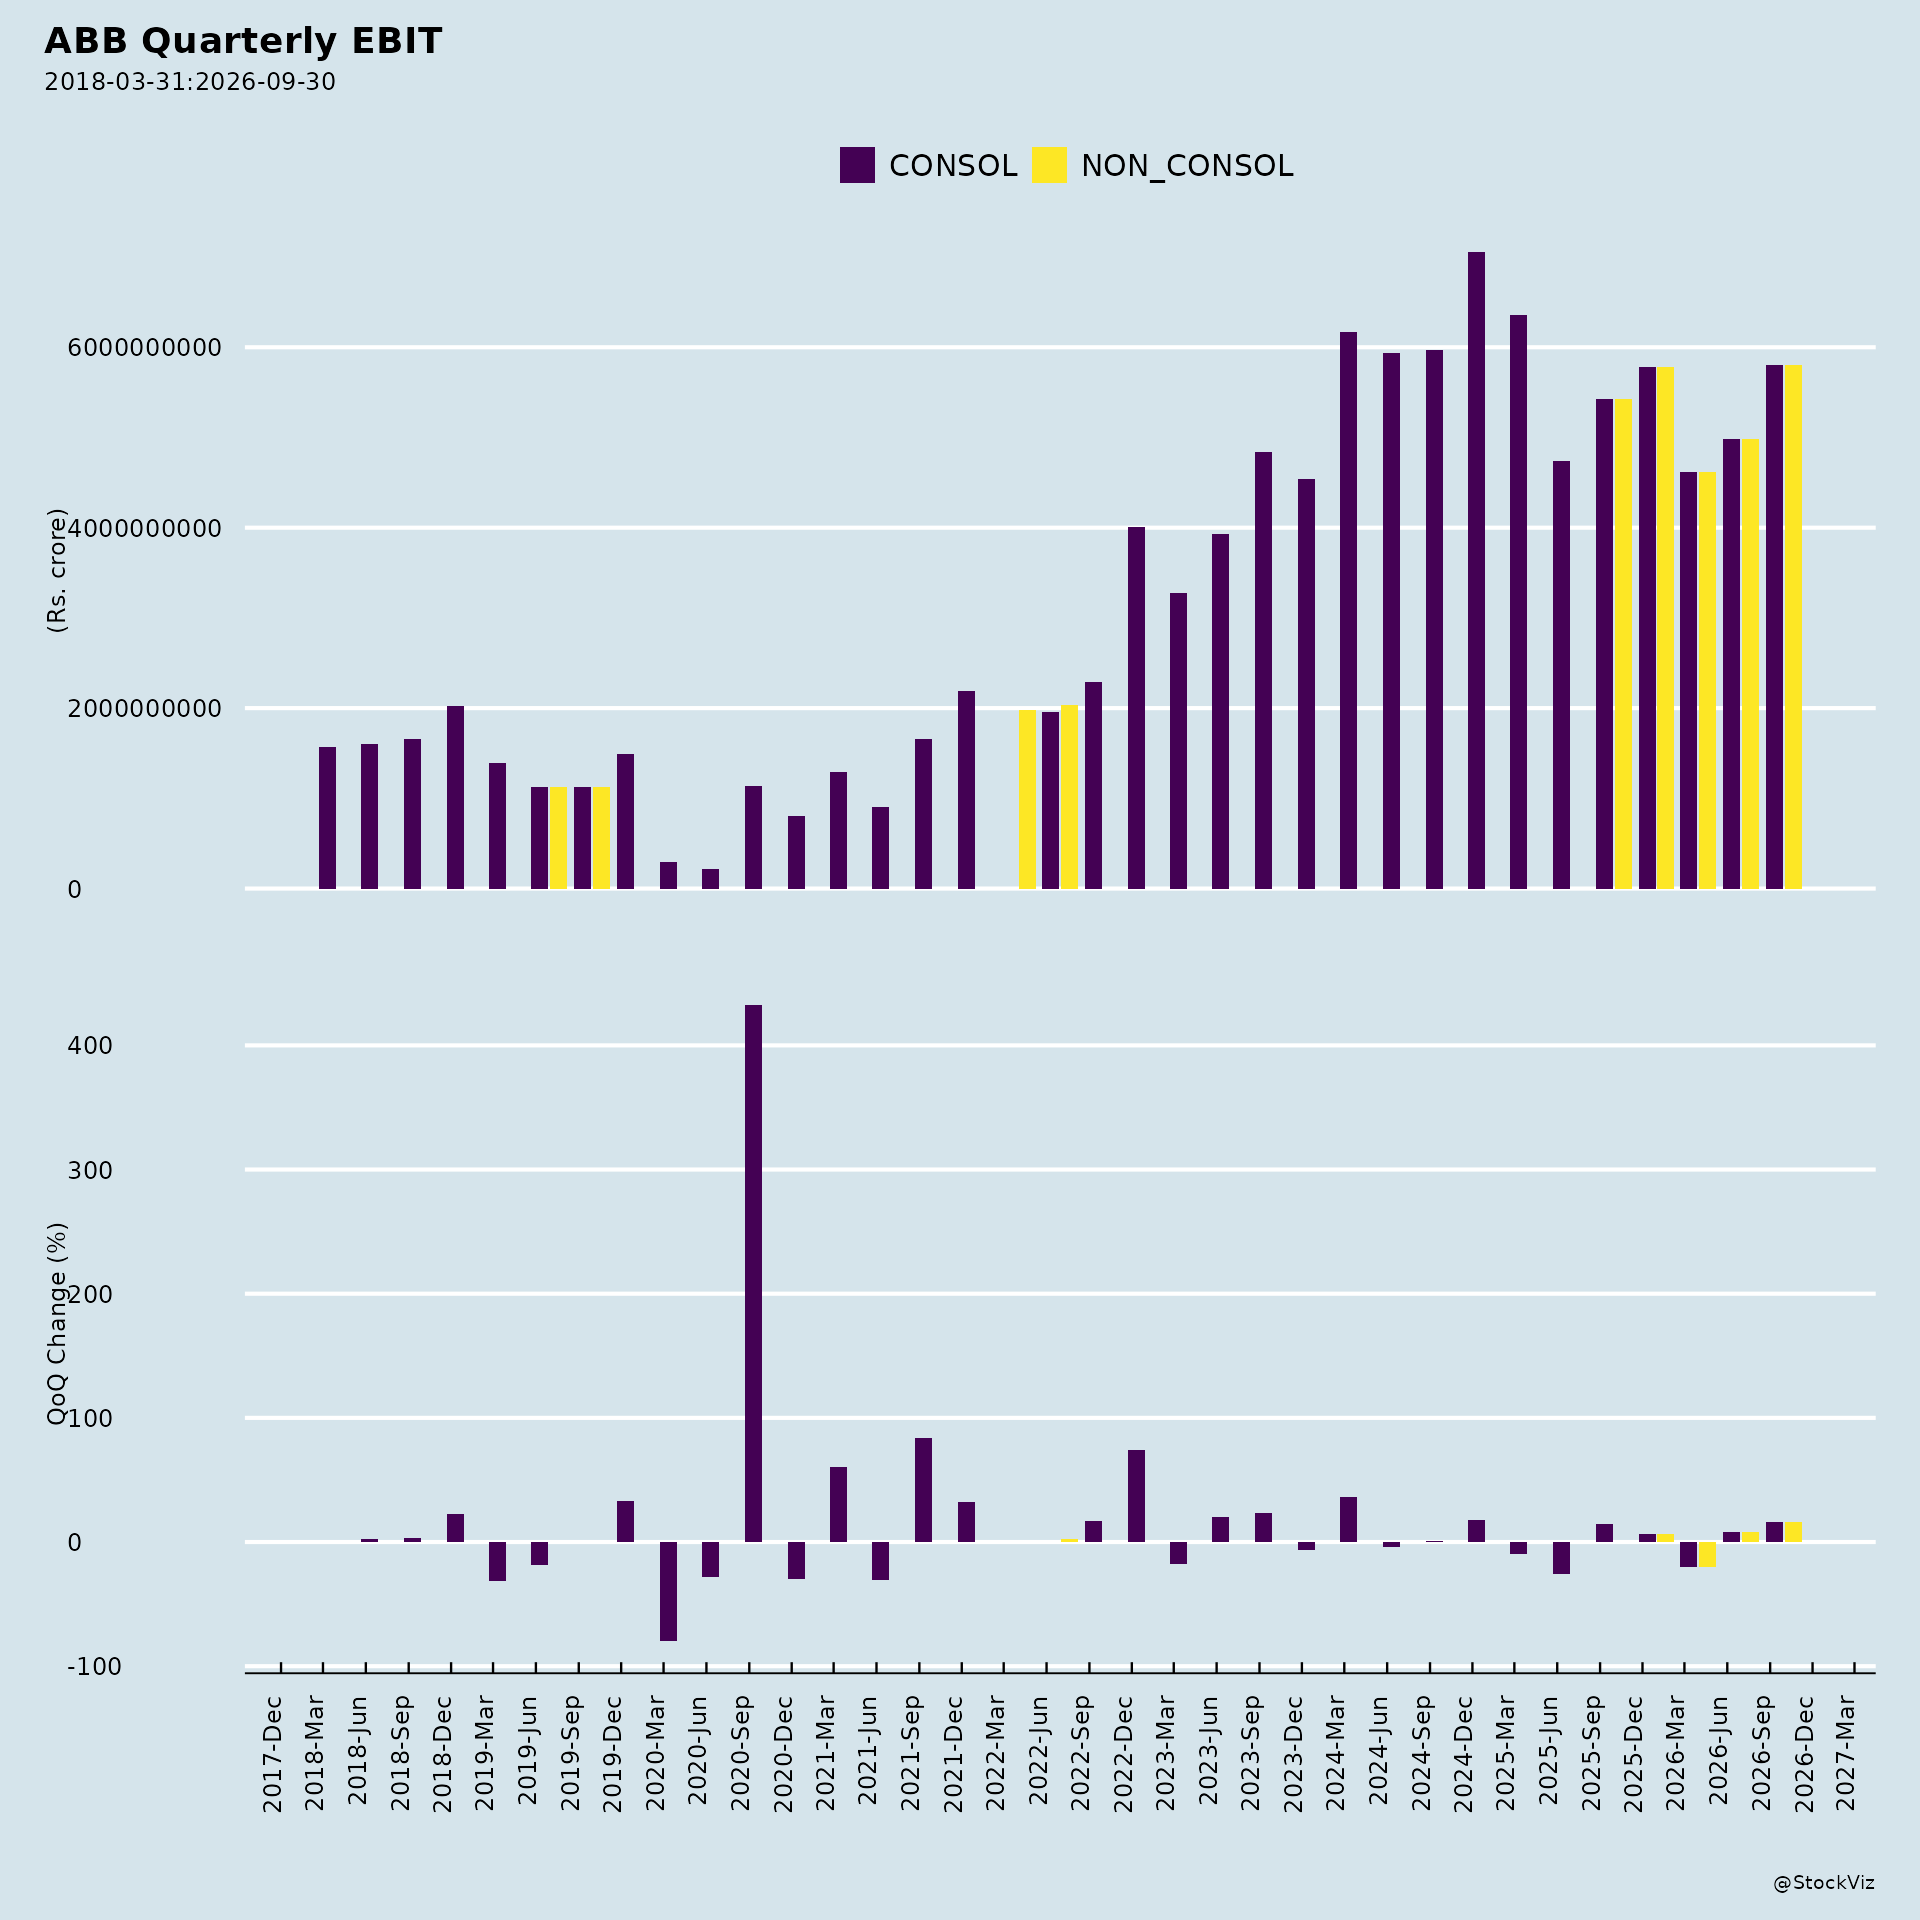
Margin compression. Operational EBITA margin was 13.0% in Q2 CY2026 versus 12.8% in Q2 CY2025, but H1 CY2026 margin was 12.8% versus 14.7% in H1 CY2025. EBITDA margin fell to 12.6% from 13.6% year-on-year. PAT margin declined to 10.4% from 11.6%. H1 PAT fell 11% to INR 712 crore.
Macro uncertainties. Management cited geopolitical uncertainty, currency fluctuation, and subnormal monsoon as factors playing out over the next two to three quarters. Research cited by management indicates elevated commodity prices and continued rupee depreciation will persist.
Tailwinds and Growth Prospects
Record order momentum. Q2 CY2026 orders were INR 4,363 crore, up 50% year-on-year and the highest ever second quarter. H1 CY2026 orders were INR 8,643 crore, up 36%. Order backlog reached INR 11,898 crore, up 22% year-on-year, with management stating there are no slow-moving or non-moving orders.
Broad-based demand. Order growth came from data centers (15–17% of orders), metals and mining (15%), oil and gas (9%), buildings and infrastructure (8%), and renewables (6%). Other contributing segments included food and beverage, cement, and automotive.
Data center opportunity. Management described a strong and multifold pipeline from hyperscalers and colocation players, with capacity investment underway for data-center-specific products. A second factory at Nelamangala was launched in Q1 for new data-center products. Ganesh Kothawade stated demand could become difficult to meet by 2027–2028 without the capacity being added.
Electrification leadership. Electrification orders grew 77% in the quarter, with backlog at INR 4,863 crore, up 39% year-on-year. Revenue was INR 1,804 crore. Growth was attributed to data centers, metals and mining, infrastructure, and cement.
Motion stability and railways. Motion backlog was INR 4,889 crore, up 22% year-on-year, with revenue of INR 1,269 crore. Management said long-term railway contracts have predictable revenue and pricing, with timing dependent on configuration changes by the railways. Metro traction was described as seeing good traction.
Structural megatrends. Management framed India’s capex cycle as maturing from a cyclical upswing into a structural multi-year theme anchored in electrification, automation, digitalization, grid modernisation, and energy transition. Cited drivers include India’s share of global energy demand expected to double by 2035, peak demand expected to exceed 450 GW by 2032 and 700–750 GW by 2050 versus about 270 GW now, and a target of 500 GW non-fossil installed capacity by 2030.
Water and wastewater theme. The quarter’s theme highlighted ABB’s play of 4–8% in water and wastewater, with a mid-term growth outlook of approximately 10% CAGR from 2025–30.
Capacity headroom. Capex is being directed to maintain 15–20% headroom above current capacity utilisation, which management said hovers between 80% and 90%.
Balance sheet strength. Cash balance was INR 7,243 crore. A special dividend of INR 90 per share was declared, reflecting Robotics divestment proceeds and H1 CY2026 operational profits. The Robotics business was sold for INR 1,568.20 crore, with a profit on sale of INR 1,658.48 crore recorded as discontinued operations.
Sustainability recognition. Scope 1 and 2 GHG emissions were reduced approximately 85% versus the 2019 baseline, 99.7% of waste was diverted from landfill, ABB India was named India’s Most Sustainable Company in the Capital Goods sector by Business Today, and its CRISIL ESG rating improved from 64 to 67.
Key Risks
- Continued commodity price inflation in copper, silver, aluminium, steel, and electrical steel, with management’s research indicating these will remain elevated.
- Continued rupee depreciation affecting input costs and export competitiveness.
- Time lag between cost inflation and price revisions reaching the market, particularly in project and tender-based system business.
- Competitive intensity from expanded industry capacity, which management said makes balancing pricing and market share more challenging.
- Geopolitical uncertainty, including the West Asia situation, affecting crude-linked sectors, refining capex, and export flows.
- Subnormal monsoon cited as a macro risk.
- Cyclicality in Automation orders and a declining Automation backlog.
- Forex and mark-to-market volatility affecting PBT independently of operational performance.
- QCO compliance requirements, which management said are relaxed with extended timelines but not fully behind the company.
- Revenue mix shift toward lower-margin project orders executed to keep factory loading, which weighed on margins.
- Dependence on data centers as a major growth driver, with management noting configuration changes by clients requiring ongoing product development.
Management Guidance Versus Observed Performance
Orders. Management characterised the demand environment as fundamentally sound with a strong opportunity pipeline. Observed: Q2 orders up 50% year-on-year and H1 up 36%, with backlog up 22%. Management noted the 50% growth was mostly volume-led, with price increases lagging.
Margins. Management declined to commit to a mid-teens EBITDA margin, stating the priority is to protect current margins and grow from there. Observed: Q2 Operational EBITA margin was 13.0%, up 20bps year-on-year, but H1 margin was 12.8% versus 14.7% in H1 CY2025. Management said better operating leverage could come in the next two quarters if material costs, forex, and supply chain remain stable, but flagged continued headwinds from research forecasts.
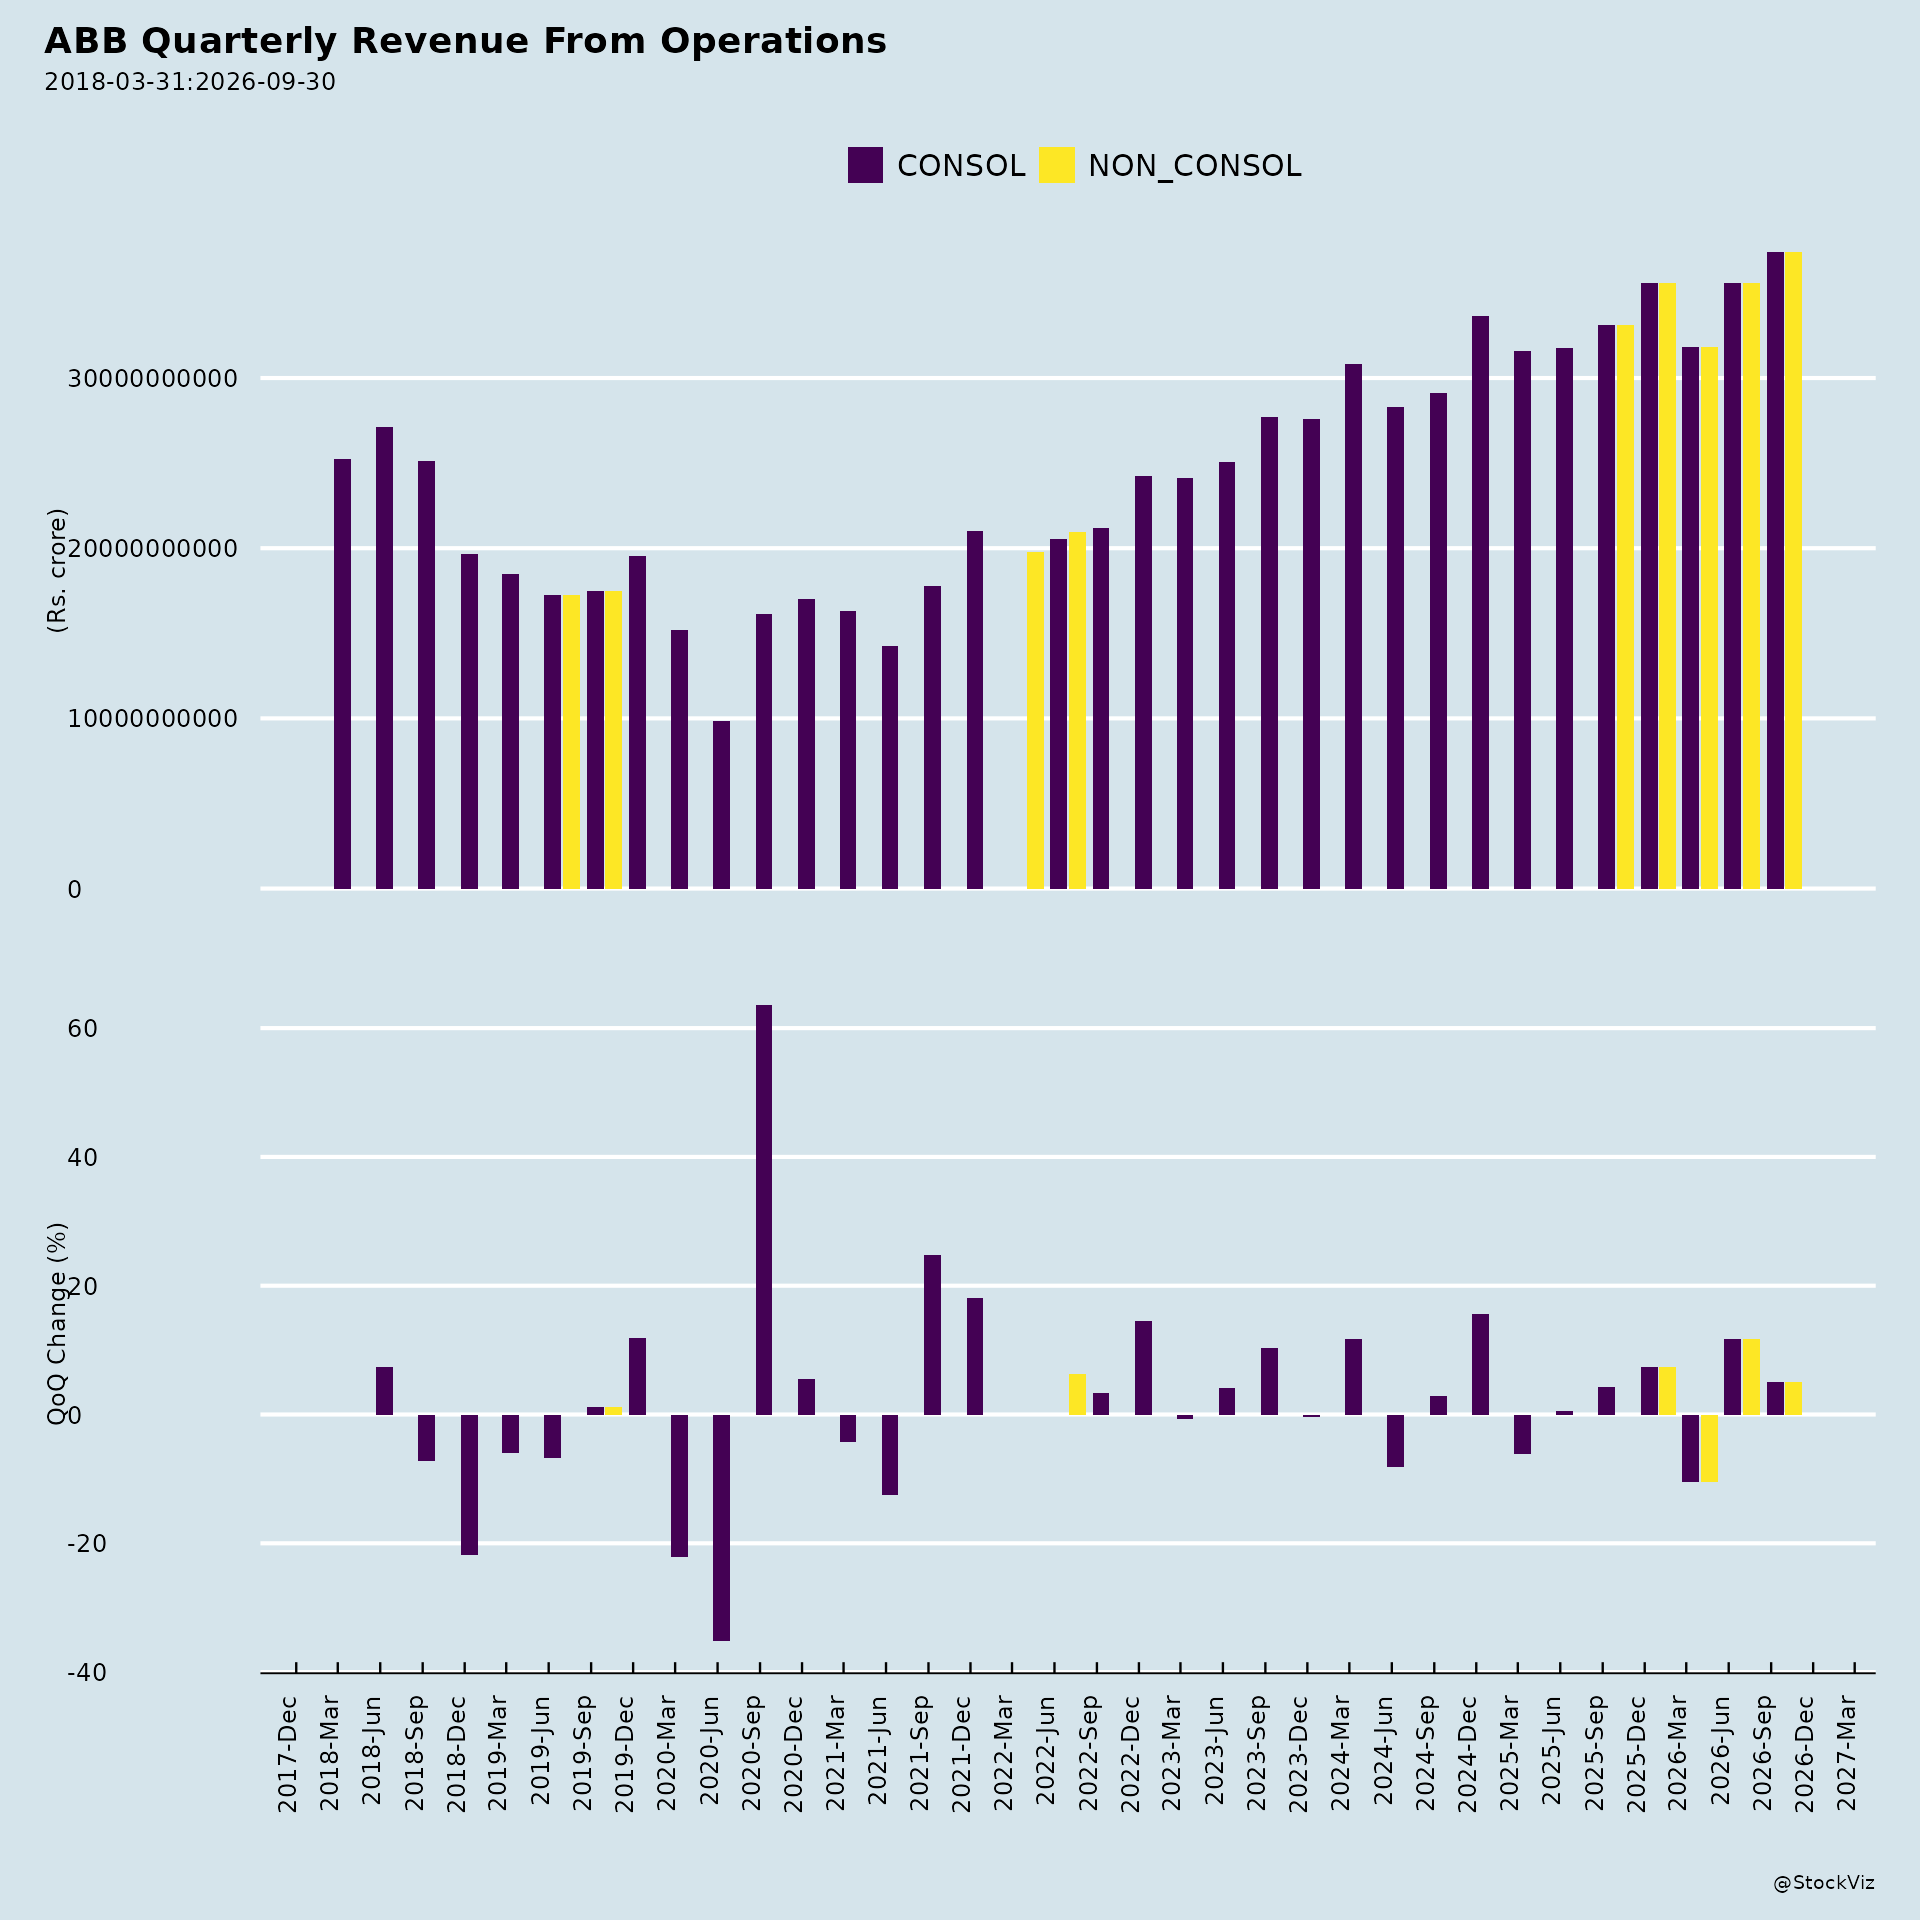
Revenue visibility. Management stated that of the INR 11,898 crore backlog, at least 40% would be consumed in the next two quarters, with the balance going into the next four quarters of 2027. Observed: H1 revenue grew 13% to INR 6,743 crore, with Q2 revenue up 21% to INR 3,559 crore.
Capacity. Management said capex is planned to maintain 15–20% headroom and 80–90% maximum utilisation. Observed: capital work-in-progress rose to INR 179.71 crore as at June 30, 2026 from INR 116.44 crore at December 31, 2025, and property, plant and equipment was INR 1,071.44 crore.
QCO. Management said QCO is not fully behind the company but is relaxed with extended timelines and improved internal capability. Observed: no specific financial quantification was provided.
Rotork acquisition. Management declined to comment on the parent’s acquisition of Rotork, stating shareholder approval is pending and it is too early to assess synergies for the India business.
Demand versus supply gap. Management explained the difference between ABB Group’s 82% India order growth and ABB India’s 50% growth as one-off, driven by a novated order and a marine and ports system order where the global parent holds the competency. Management said this was a one-time variation and that 90% of the business comes from India.
Broker Narrative
The broker narrative shifted from company-specific growth optimism in the first report—robust revenue and profitability growth, strong order inflows, and tier-2/3 market penetration—to a macro-driven cautionary Reduce stance in the last report, citing elevated copper and metal prices, a weakening rupee, geopolitical uncertainty, and subnormal monsoon fallout. Themes of tier-2/3 city penetration and capacity investments persisted as positives throughout, while early emphasis on strong cash positions, warranty-driven margin resilience, and services momentum faded entirely. The trajectory from Accumulate to Reduce reflects exogenous cost and competitive pressures overriding structural growth narratives.
Fears that came true
- Warranty Cost Provision in the Motion segment margin materialized as persistent margin pressures that correlated with DISAPPOINTMENT outcomes on Motilal Oswal’s Buy calls, where actual returns were -21.6% (2024-05-12) and -25.9% (2024-11-05) against predicted gains of +18.4% and +19.2%.
- Process Automation Margin Pressure persisted through 2024 and contributed to negative actual returns including -6.2% on 2024-09-01 and -25.9% on 2024-11-05, both marked DISAPPOINTMENT despite bullish Buy predictions.
- Elevated Inventory Levels flagged early created sustained working capital concerns that aligned with the stock’s sharp decline into negative territory, evidenced by ICICI Securities’ successful Reduce call achieving an actual -33.3% on 2024-08-12.
Optimism that failed
- Robust Revenue & Profitability Growth (+22.5% revenue and +64.4% Adj. PAT YoY in Q1CY23) failed to sustain, as subsequent Buy calls produced DISAPPOINTMENT outcomes with actual returns of -21.6% (2024-05-12) and -25.9% (2024-11-05).
- Strong Order Inflow & Visibility with a Rs 71.7bn order book did not prevent DISAPPOINTMENT outcomes, with predicted gains of +18.4% and +19.2% on Motilal Oswal Buy calls materializing as -21.6% and -25.9% actual returns.
- Services Segment Traction with 37% YoY order growth was not sustained as a meaningful driver—the last report omits services entirely, and the stock deteriorated to a Reduce rating with a -12.5% predicted and -4.7% actual return on 2026-08-25.
Broker Timeline
44 broker calls · 2023-05-05 to 2026-08-25
CNBC-TV18: ratings, targets and commentary
Extracted from CNBC-TV18 posts; ratings and targets are as published, not current consensus. OCR may contain errors. Speaker attribution is retained; not all speakers are brokers. These statements are separate from the Broker Narrative and Broker Timeline and have no calculated performance or outcomes.
Ratings and targets
| Published / source (IST) | Speaker / affiliation | Rating / target | Commentary |
|---|---|---|---|
| 2026-11-16 |
Motilal Oswal
|
Buy
|
upgrades ABB India to 'buy' |
Other company commentary (not broker ratings)
| Published / source (IST) | Speaker / affiliation | Rating / target | Commentary |
|---|---|---|---|
| 2026-11-16 |
HSBC
|
—
|
stays cautious on ABB India |
Management comments
No recorded management comments with an explicit designation and affiliation for this ticker.
Copyright © 2023 SAS Data Analytics Pvt. Ltd. All rights reserved.