JSL
Equity Metrics
January 13, 2026
Jindal Stainless Limited
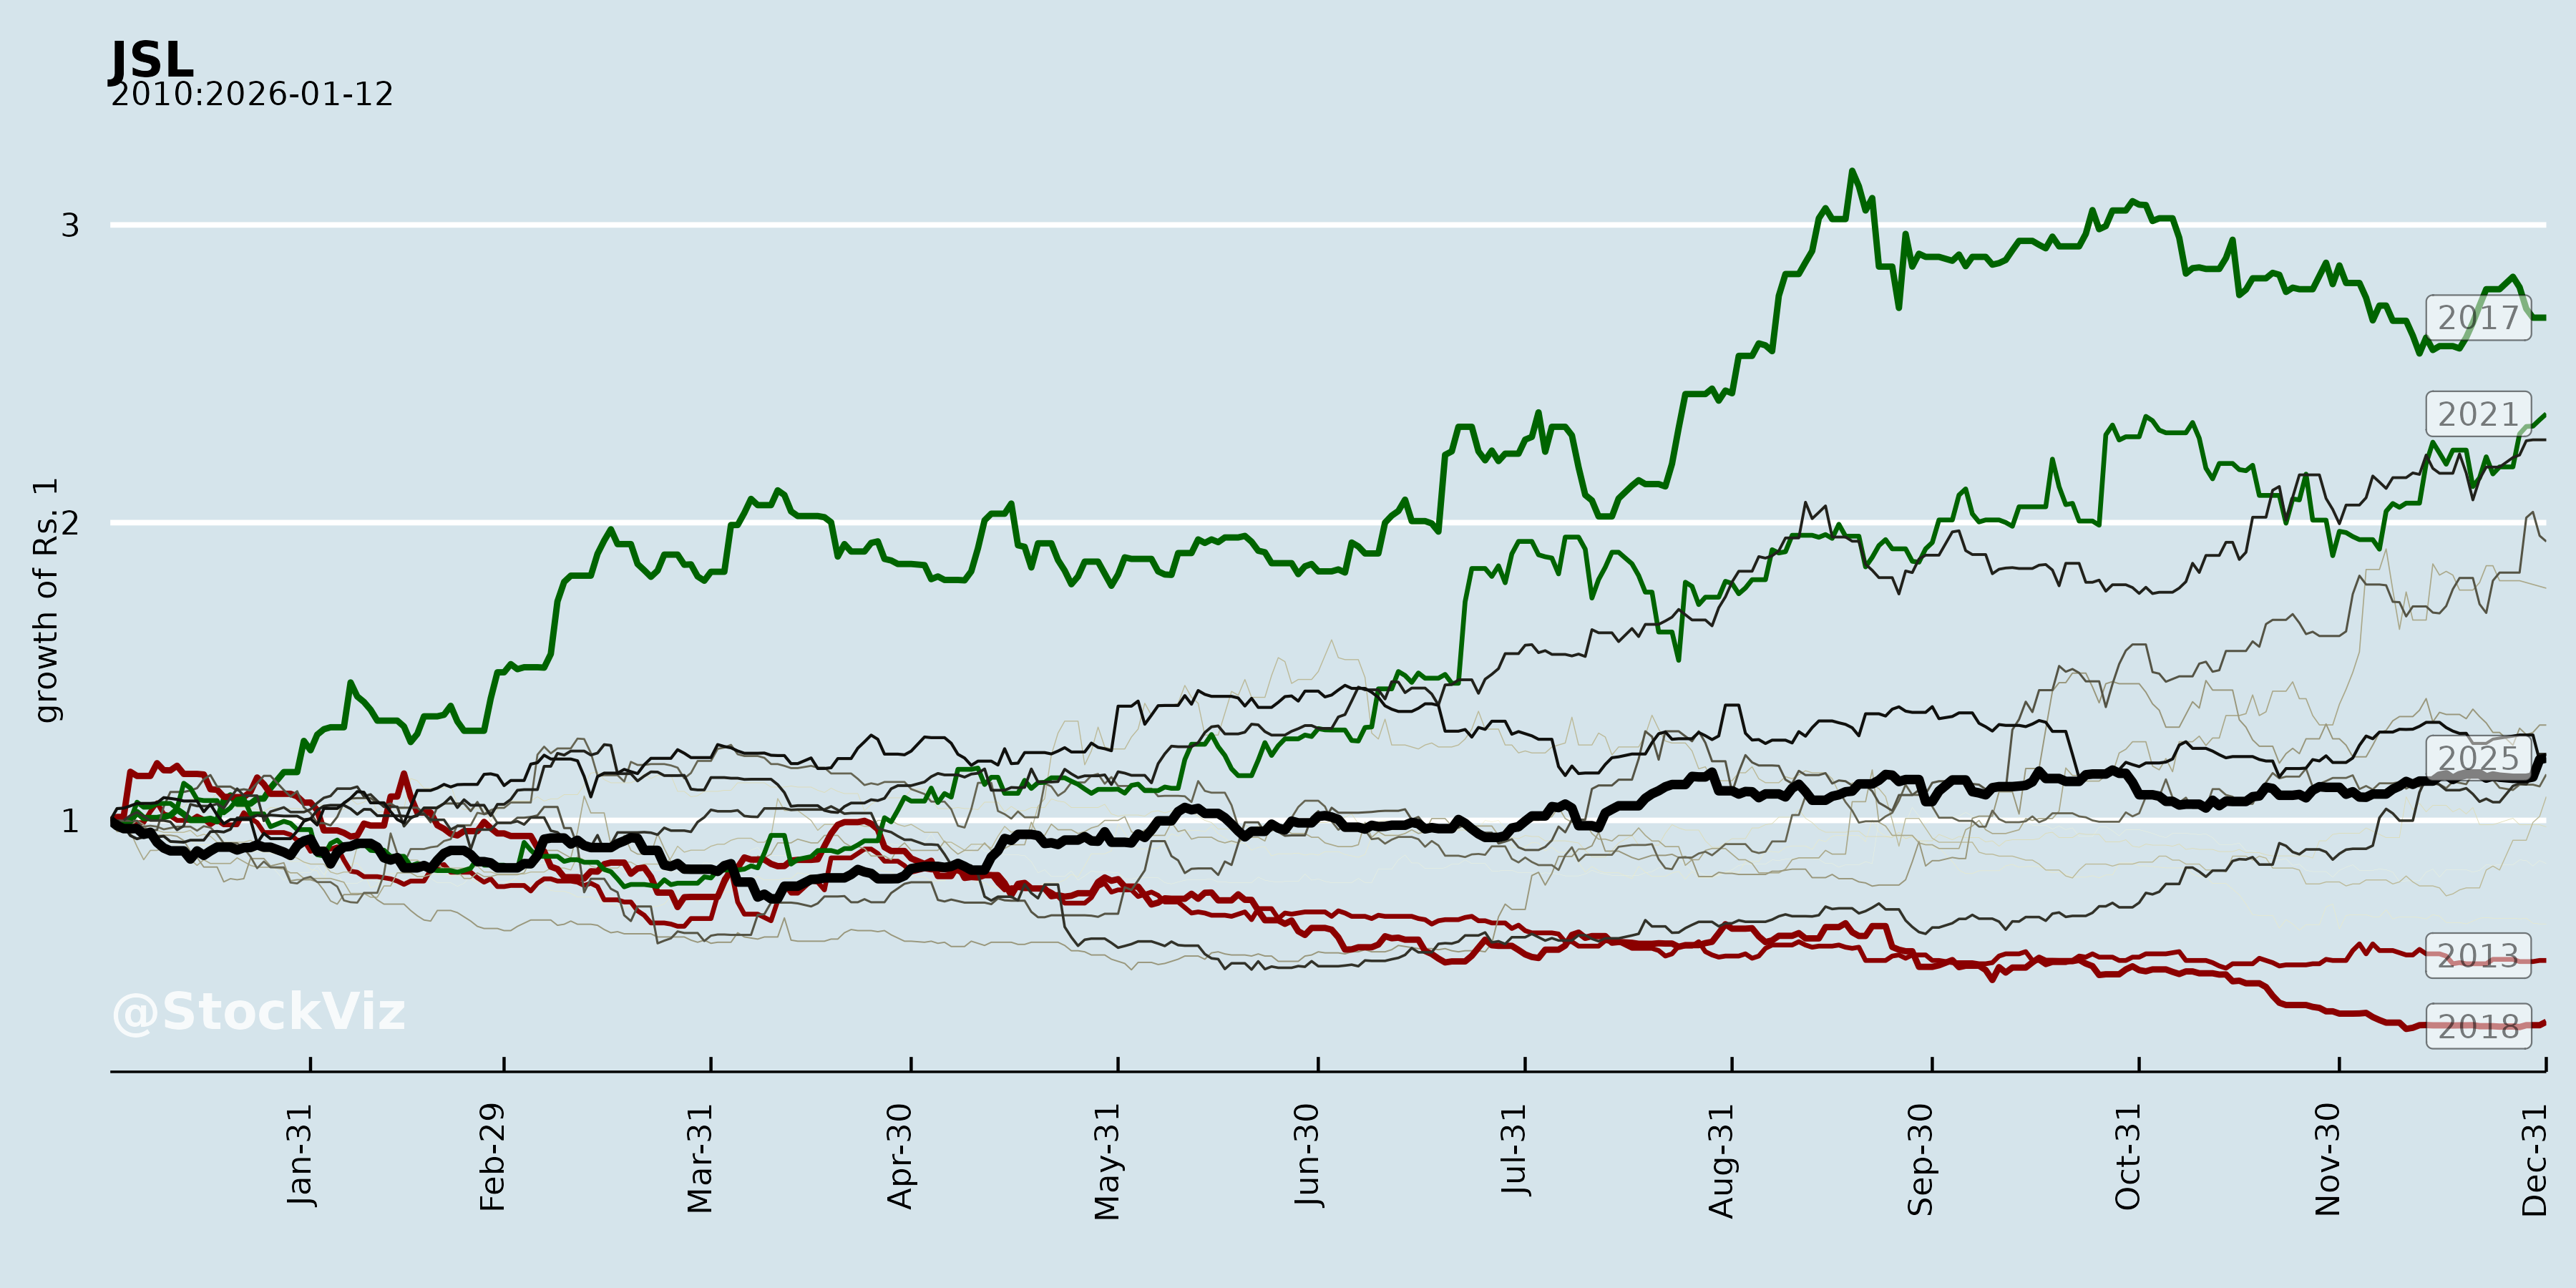
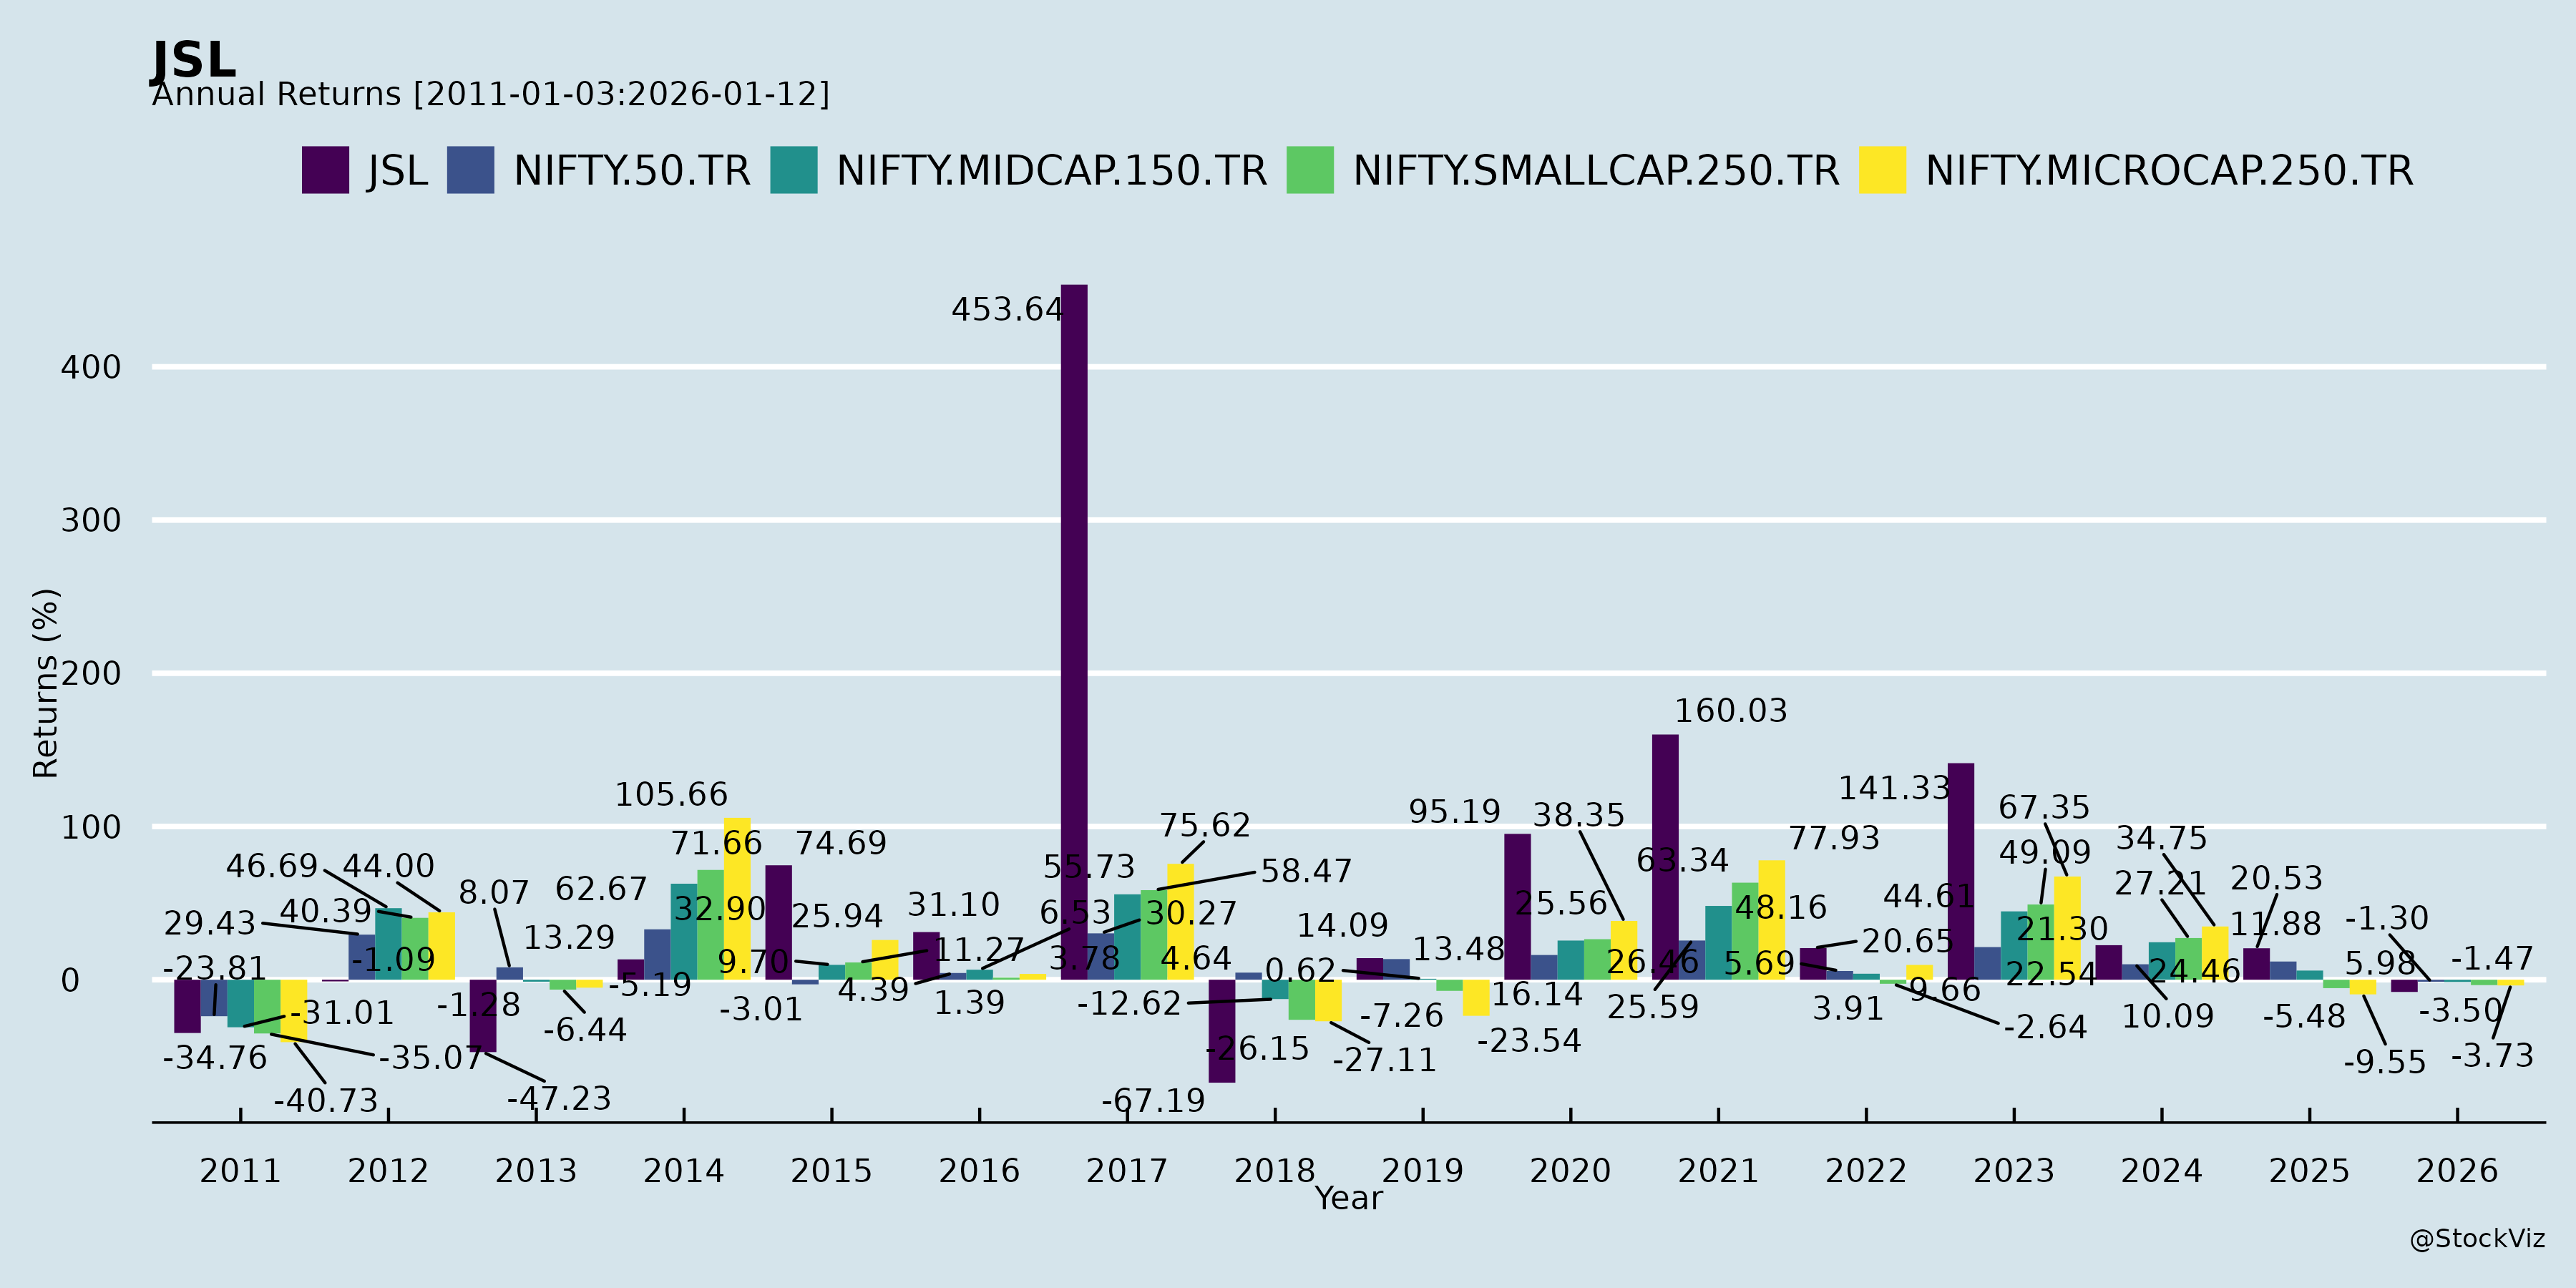
Annual Returns
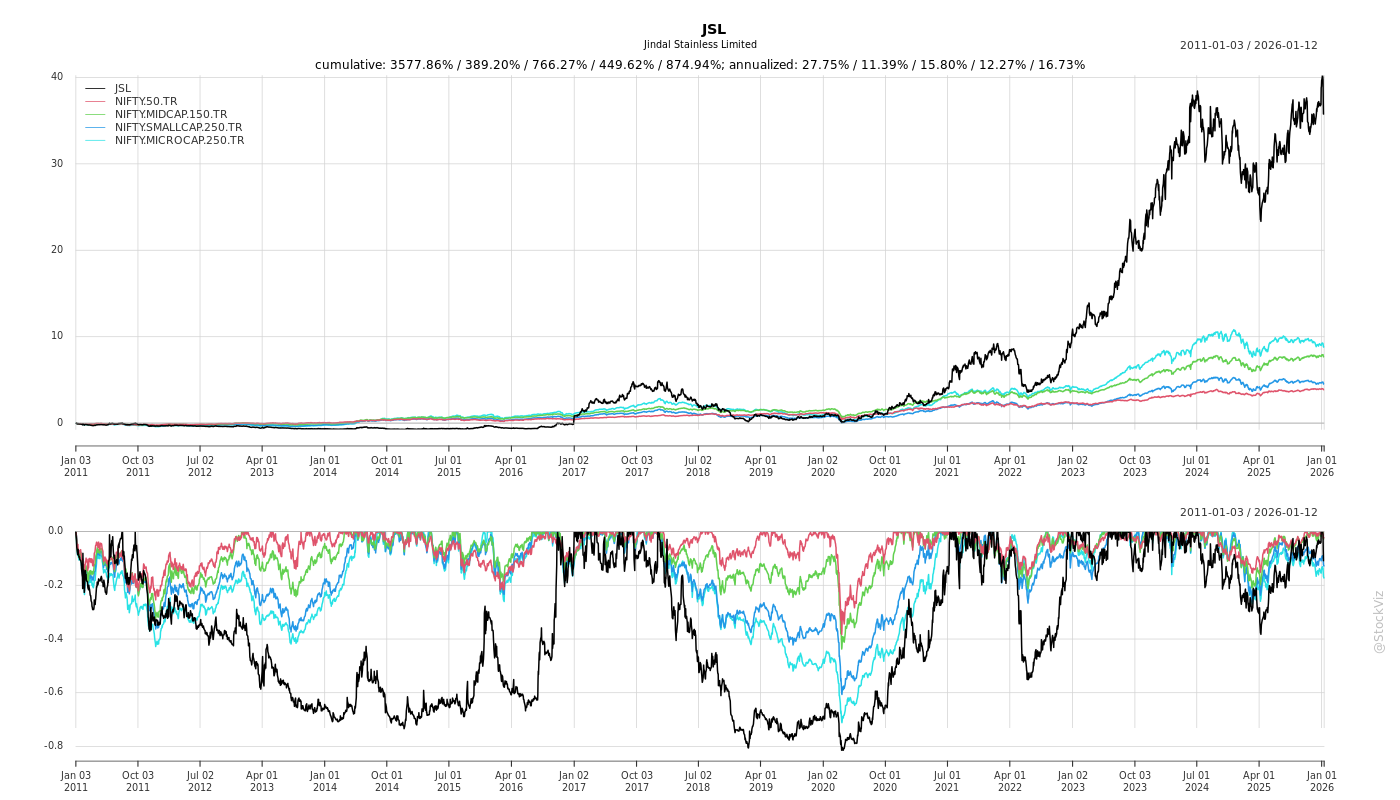
Cumulative Returns and Drawdowns
Fundamentals
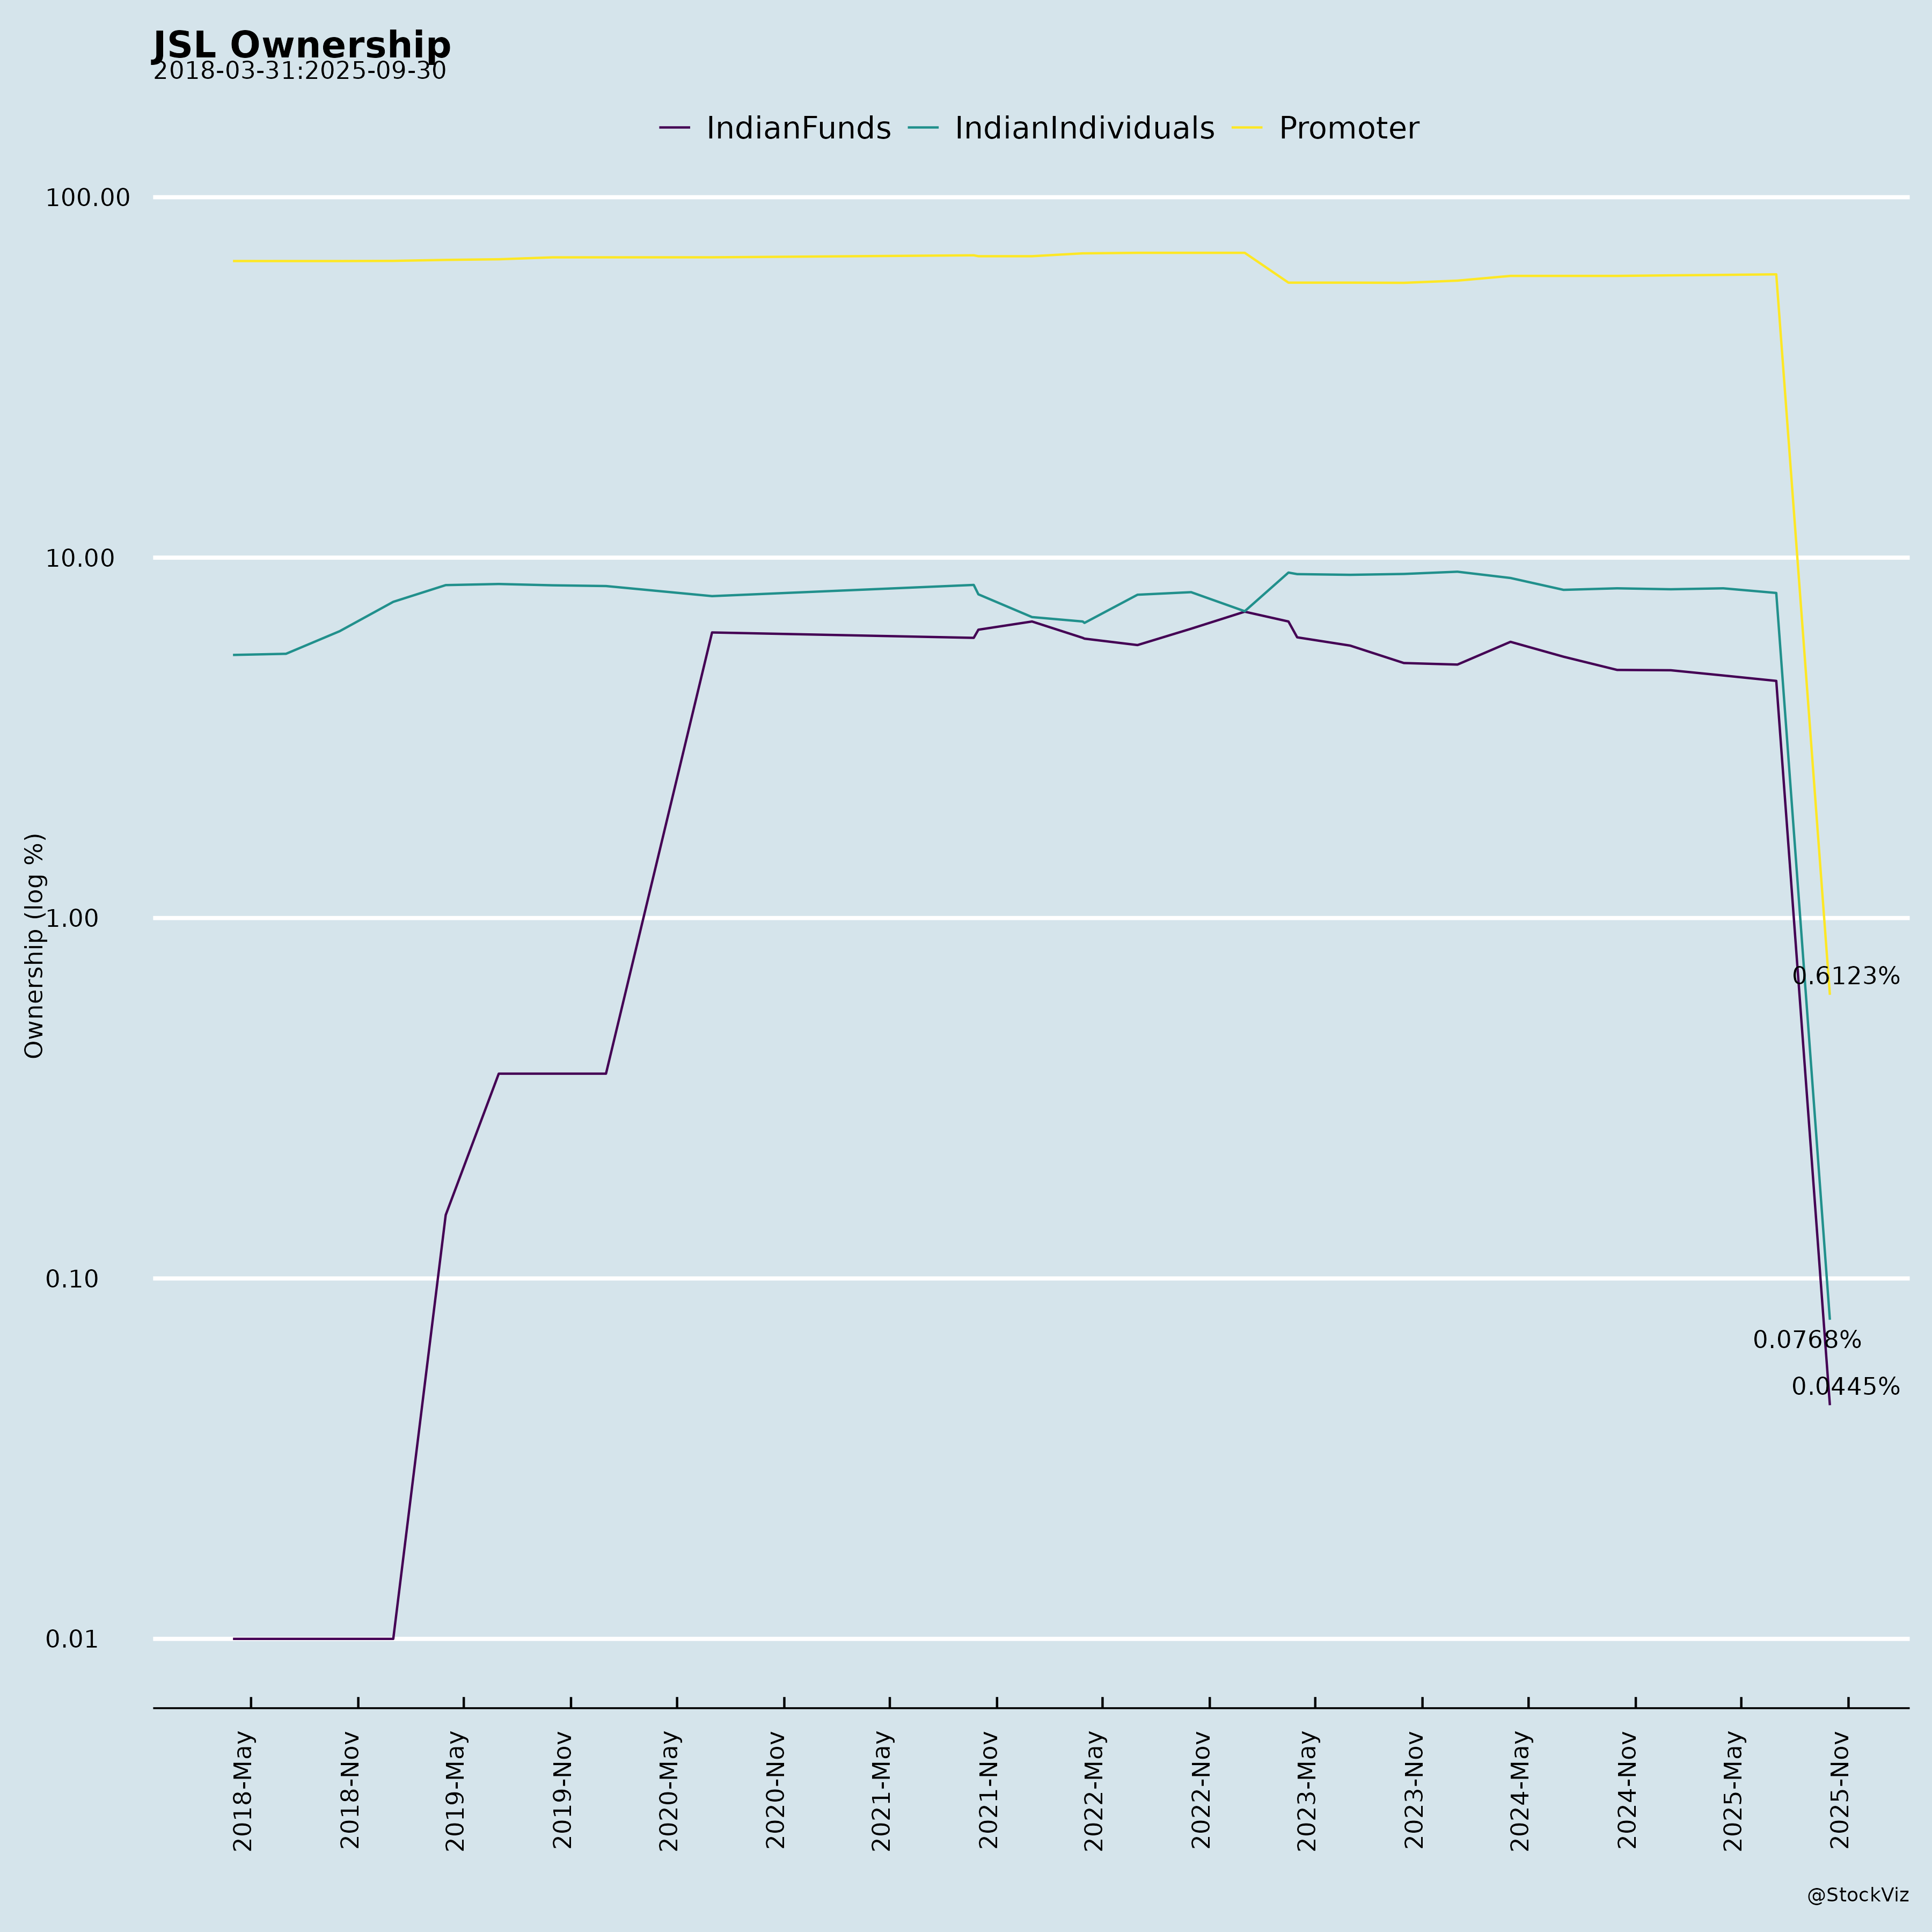
Ownership
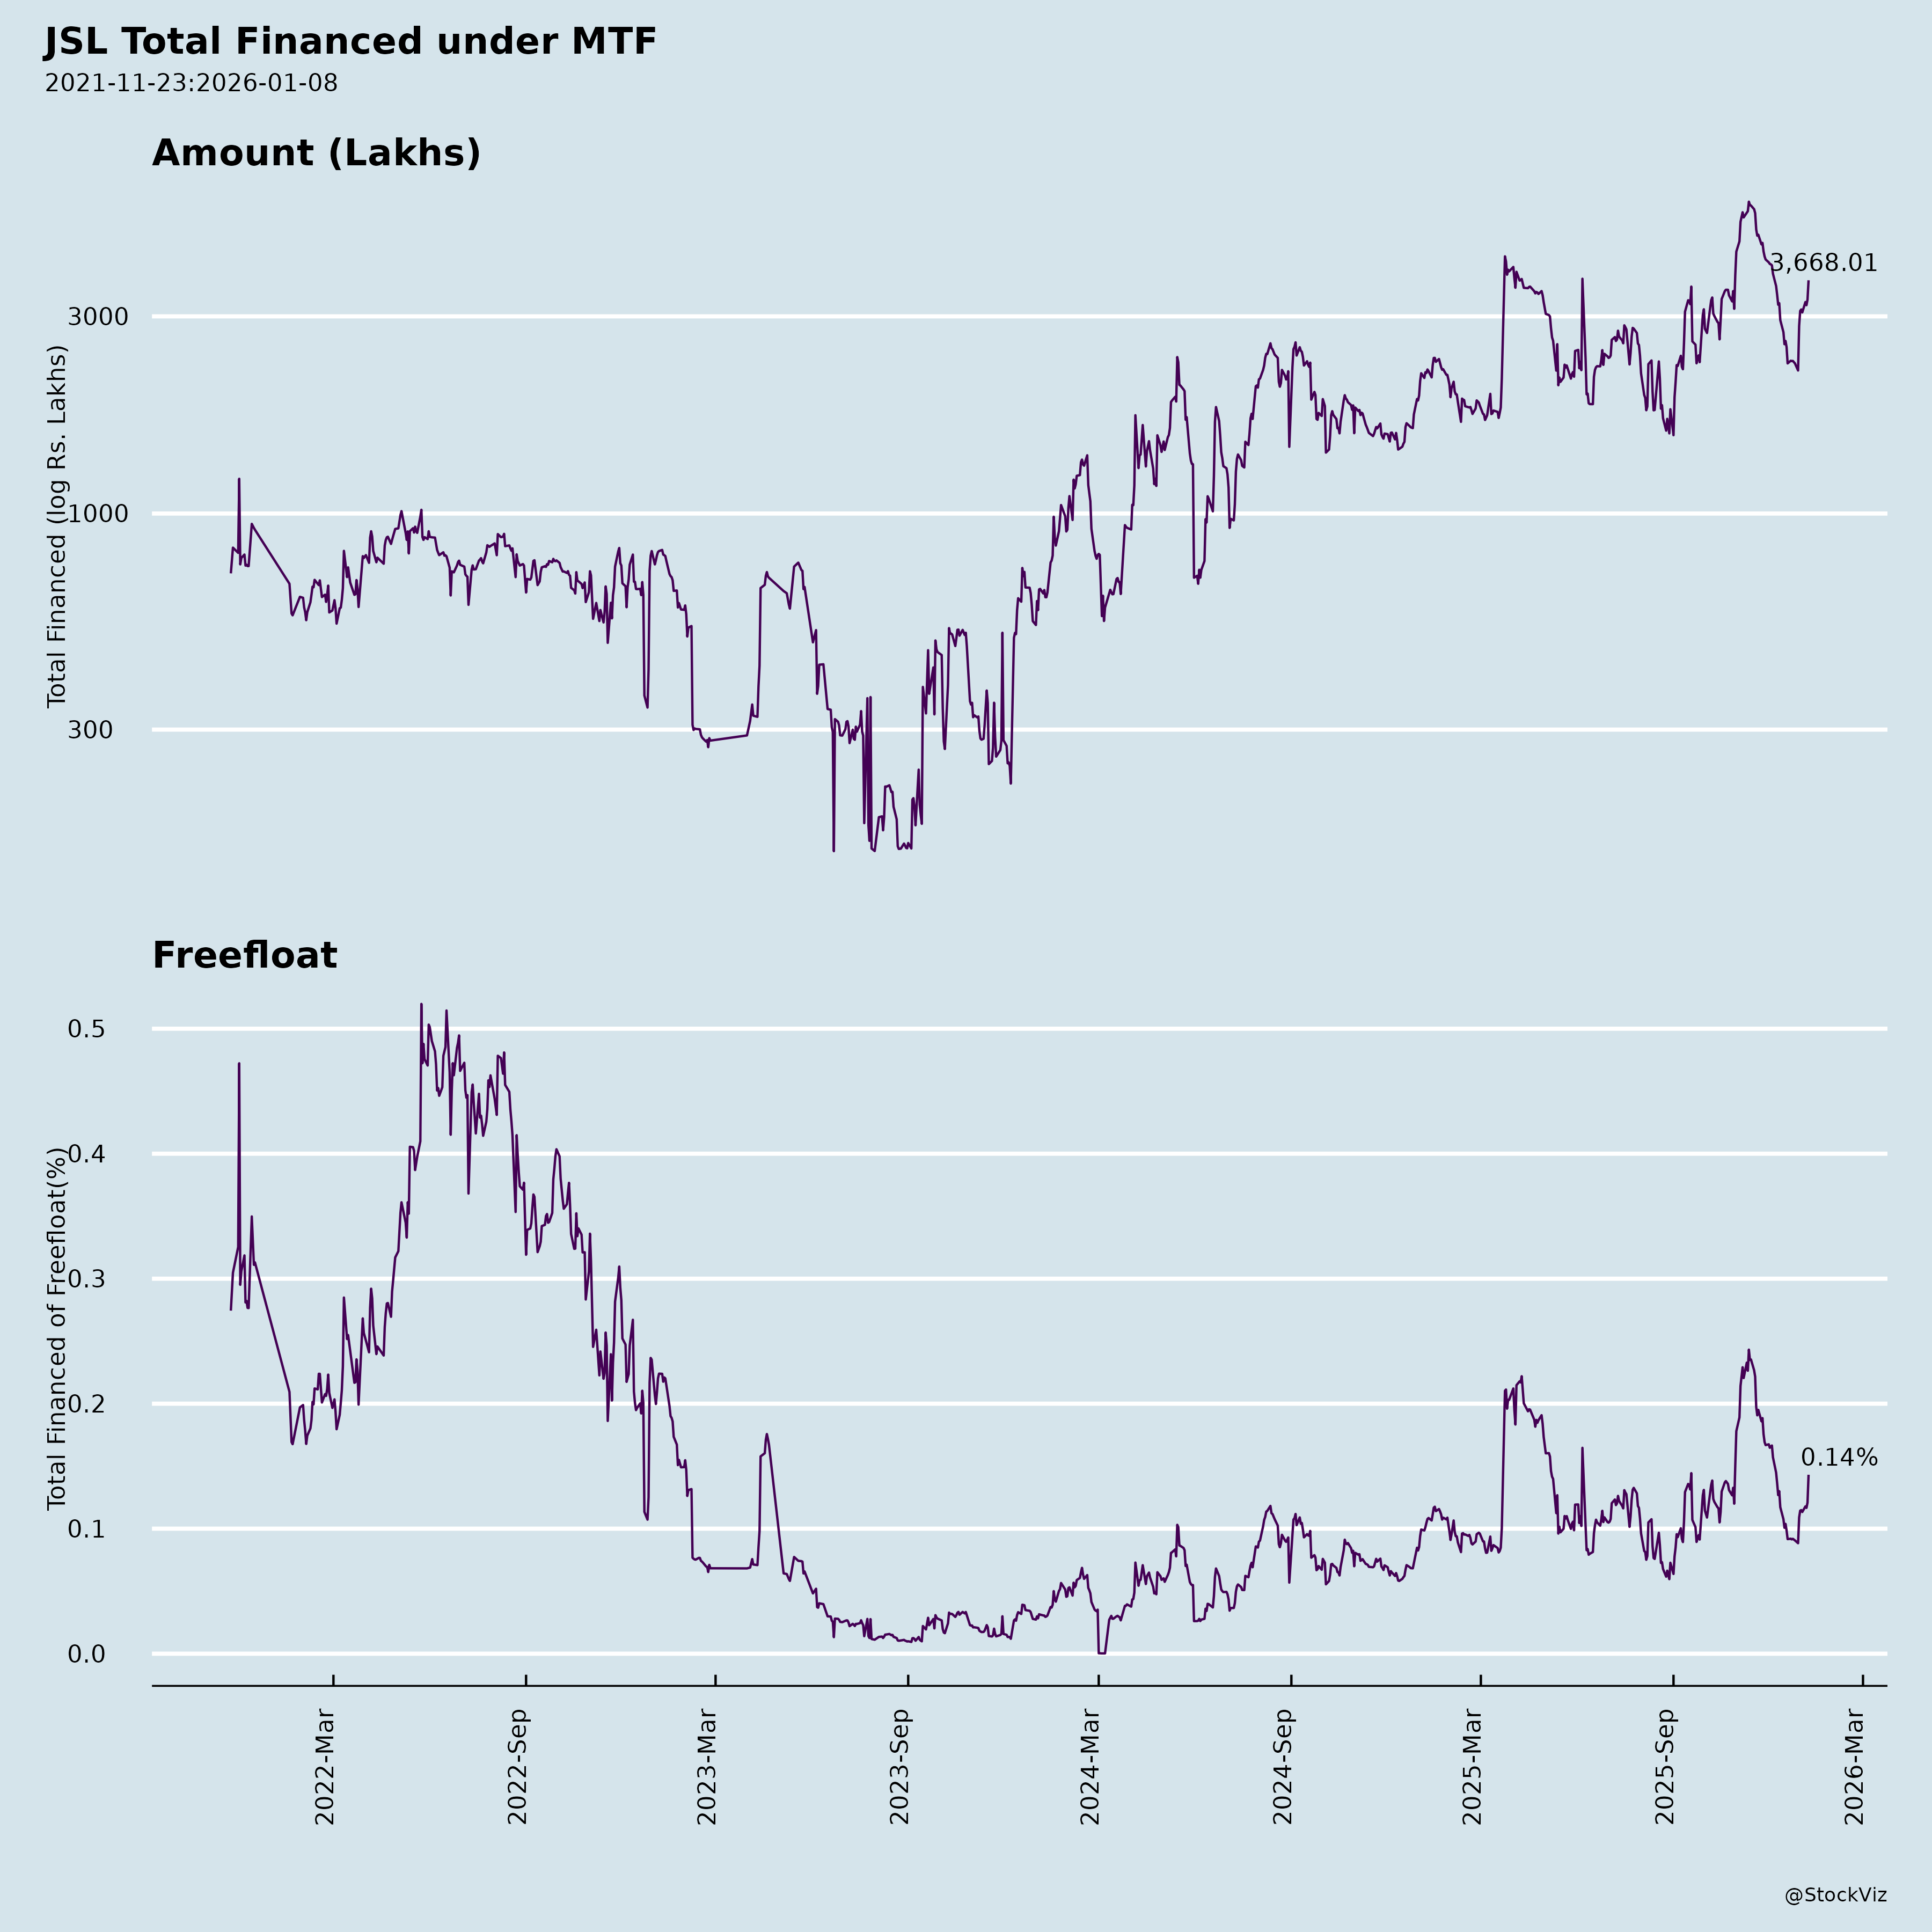
Margined
AI Summary
asof: 2025-12-08
Based on a comprehensive review of the provided documents — including Jindal Stainless Limited’s (JSL) unaudited standalone and consolidated financial results for Q2 and H1 FY26 (ended September 2025), auditor’s limited review reports, strategic developments, and December 2025 press release on ESG performance — here is a detailed analysis of headwinds, tailwinds, growth prospects, and key risks facing the company.
📌 Company Overview (Jindal Stainless Limited - JSL)
- Ticker: JSL / 532508
- Parent: Jindal Stainless Limited
- Sector: Metals & Mining (Stainless Steel)
- Key Operations: Manufacturing of stainless steel across India, Spain, and Indonesia.
- Annual Melt Capacity: Currently 3 MTPA; increasing to 4.2 MTPA by FY27.
- Revenue (FY25): INR 40,182 crore (~USD 4.75 billion)
✅ Tailwinds (Growth Drivers)
1. Strong Q2 & H1 FY26 Financial Performance
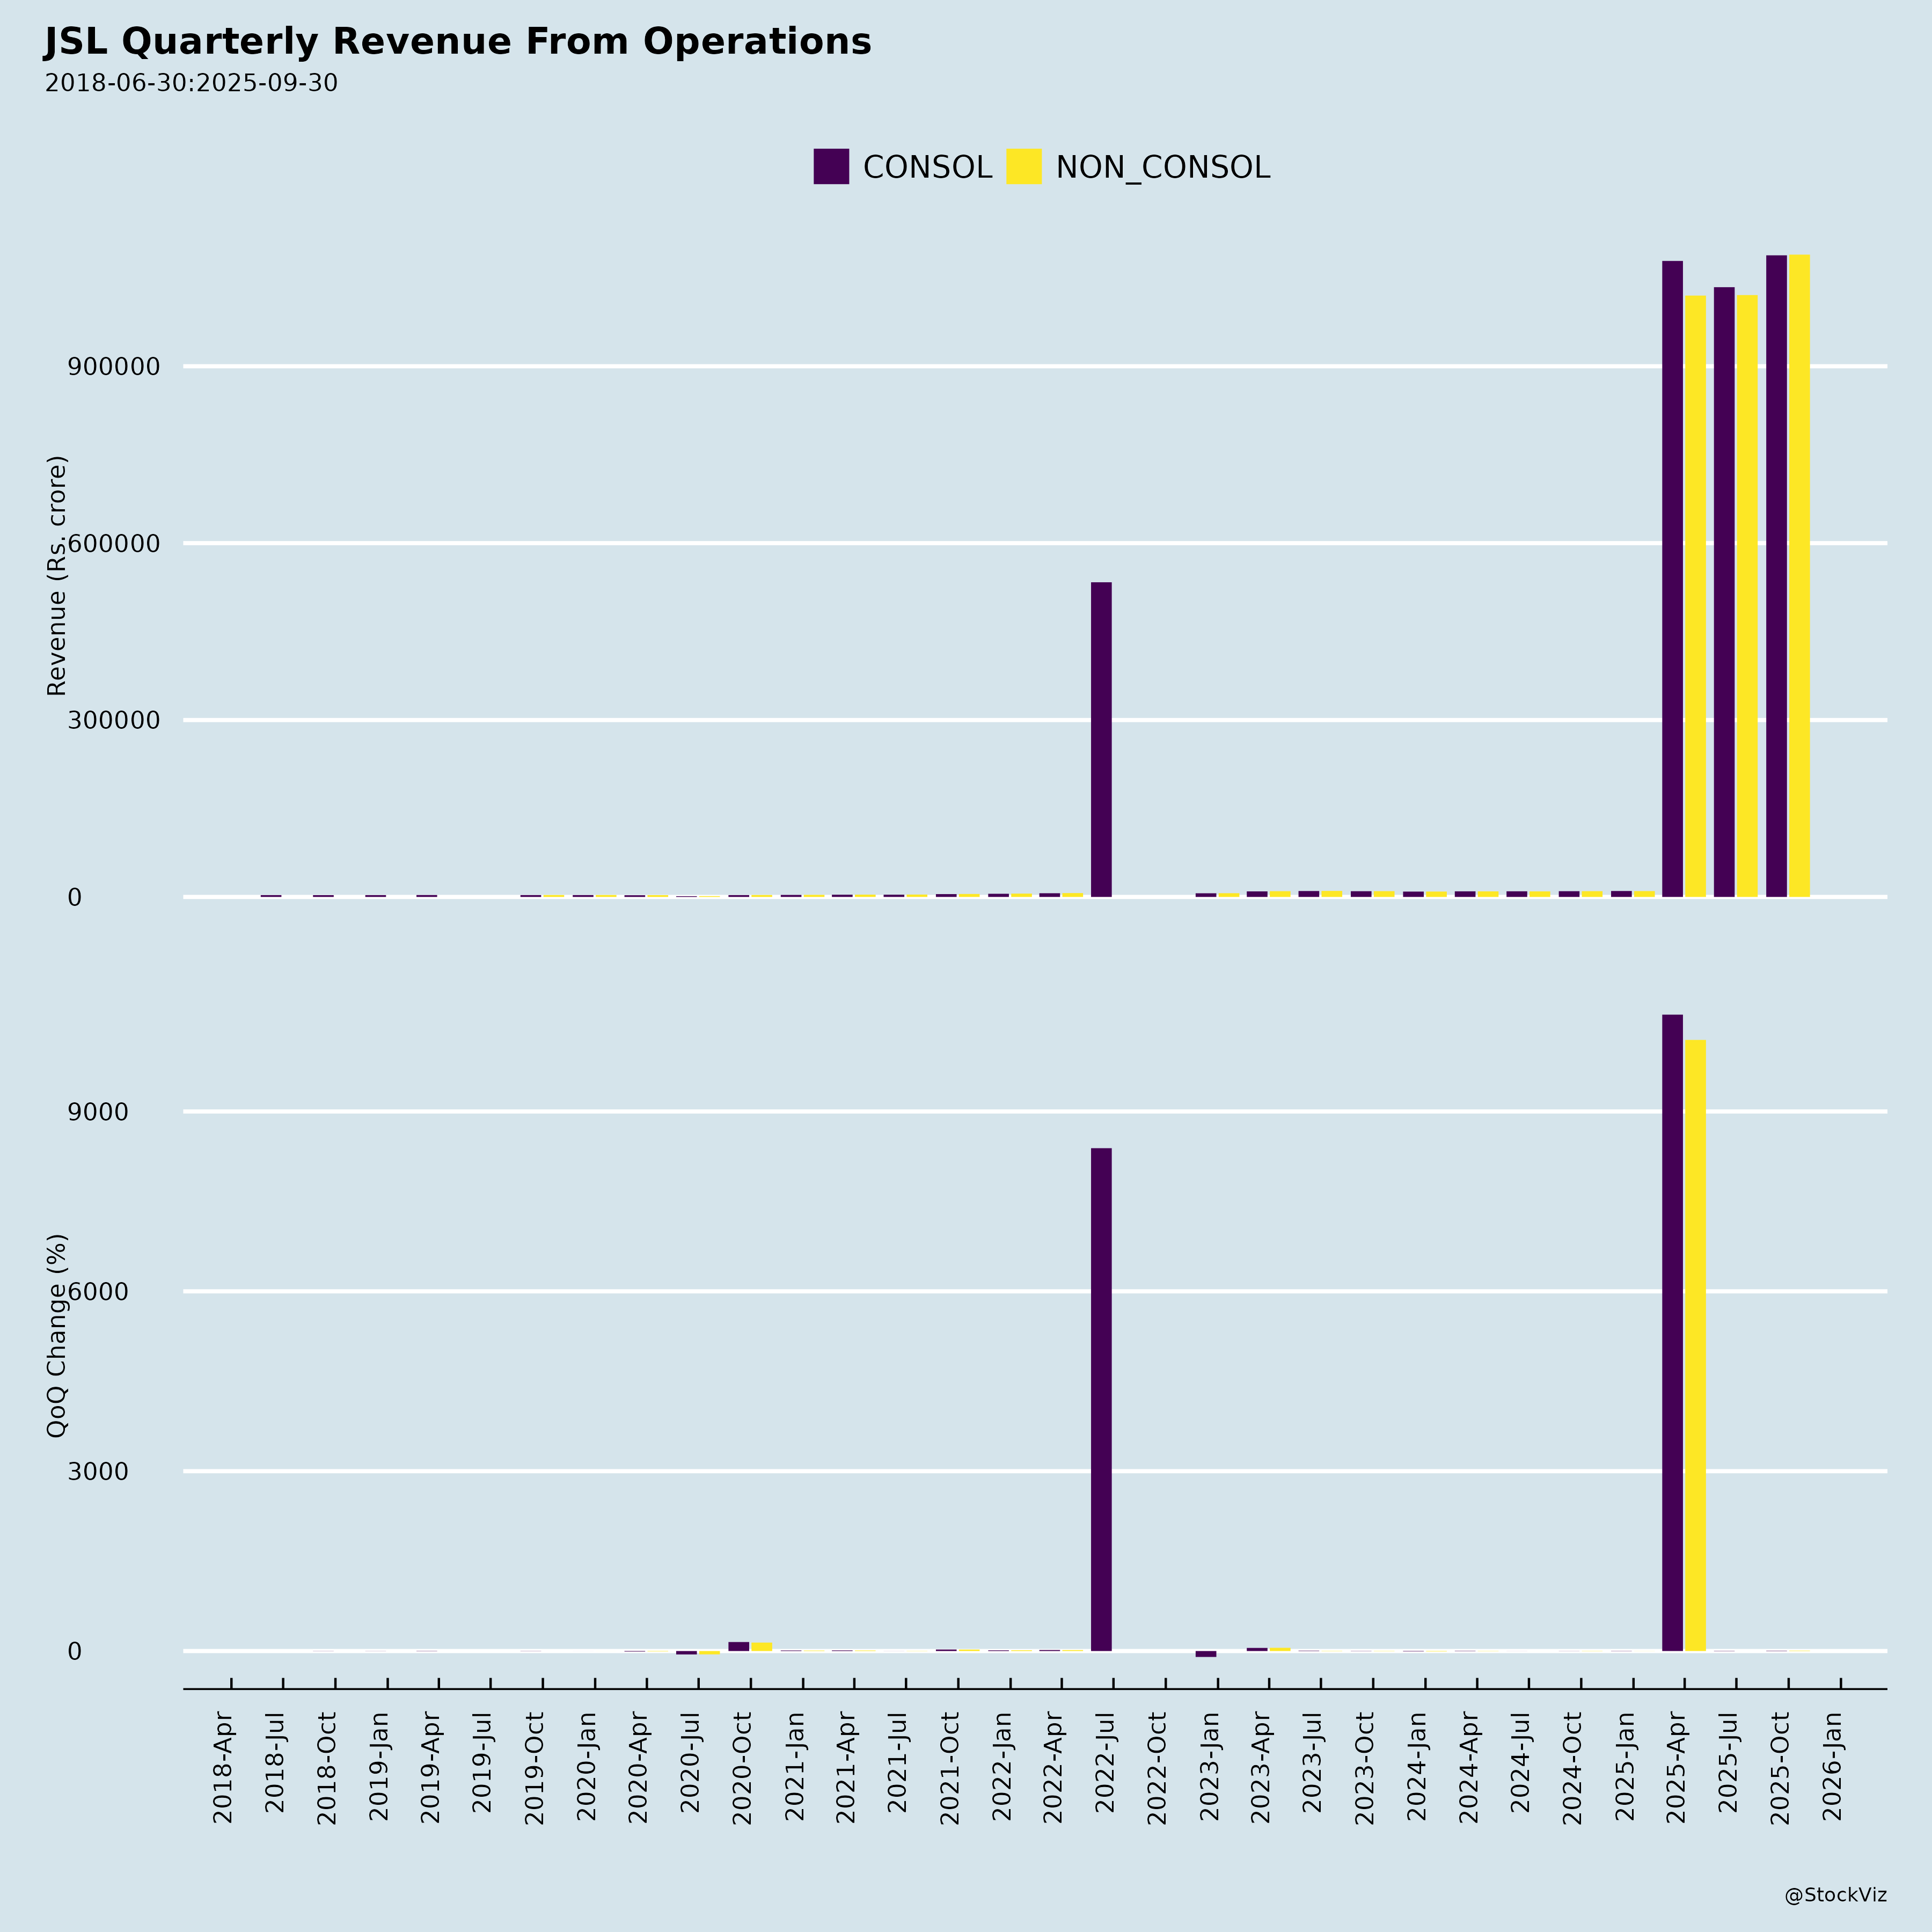
- Revenue Growth:
- Q2 FY26 (Standalone): Revenue from operations INR 10,881 crore, up 5.2% YoY (vs INR 10,341 crore in Q2 FY25).
- H1 FY26: Revenue INR 21,221 crore, up 9.8% YoY.
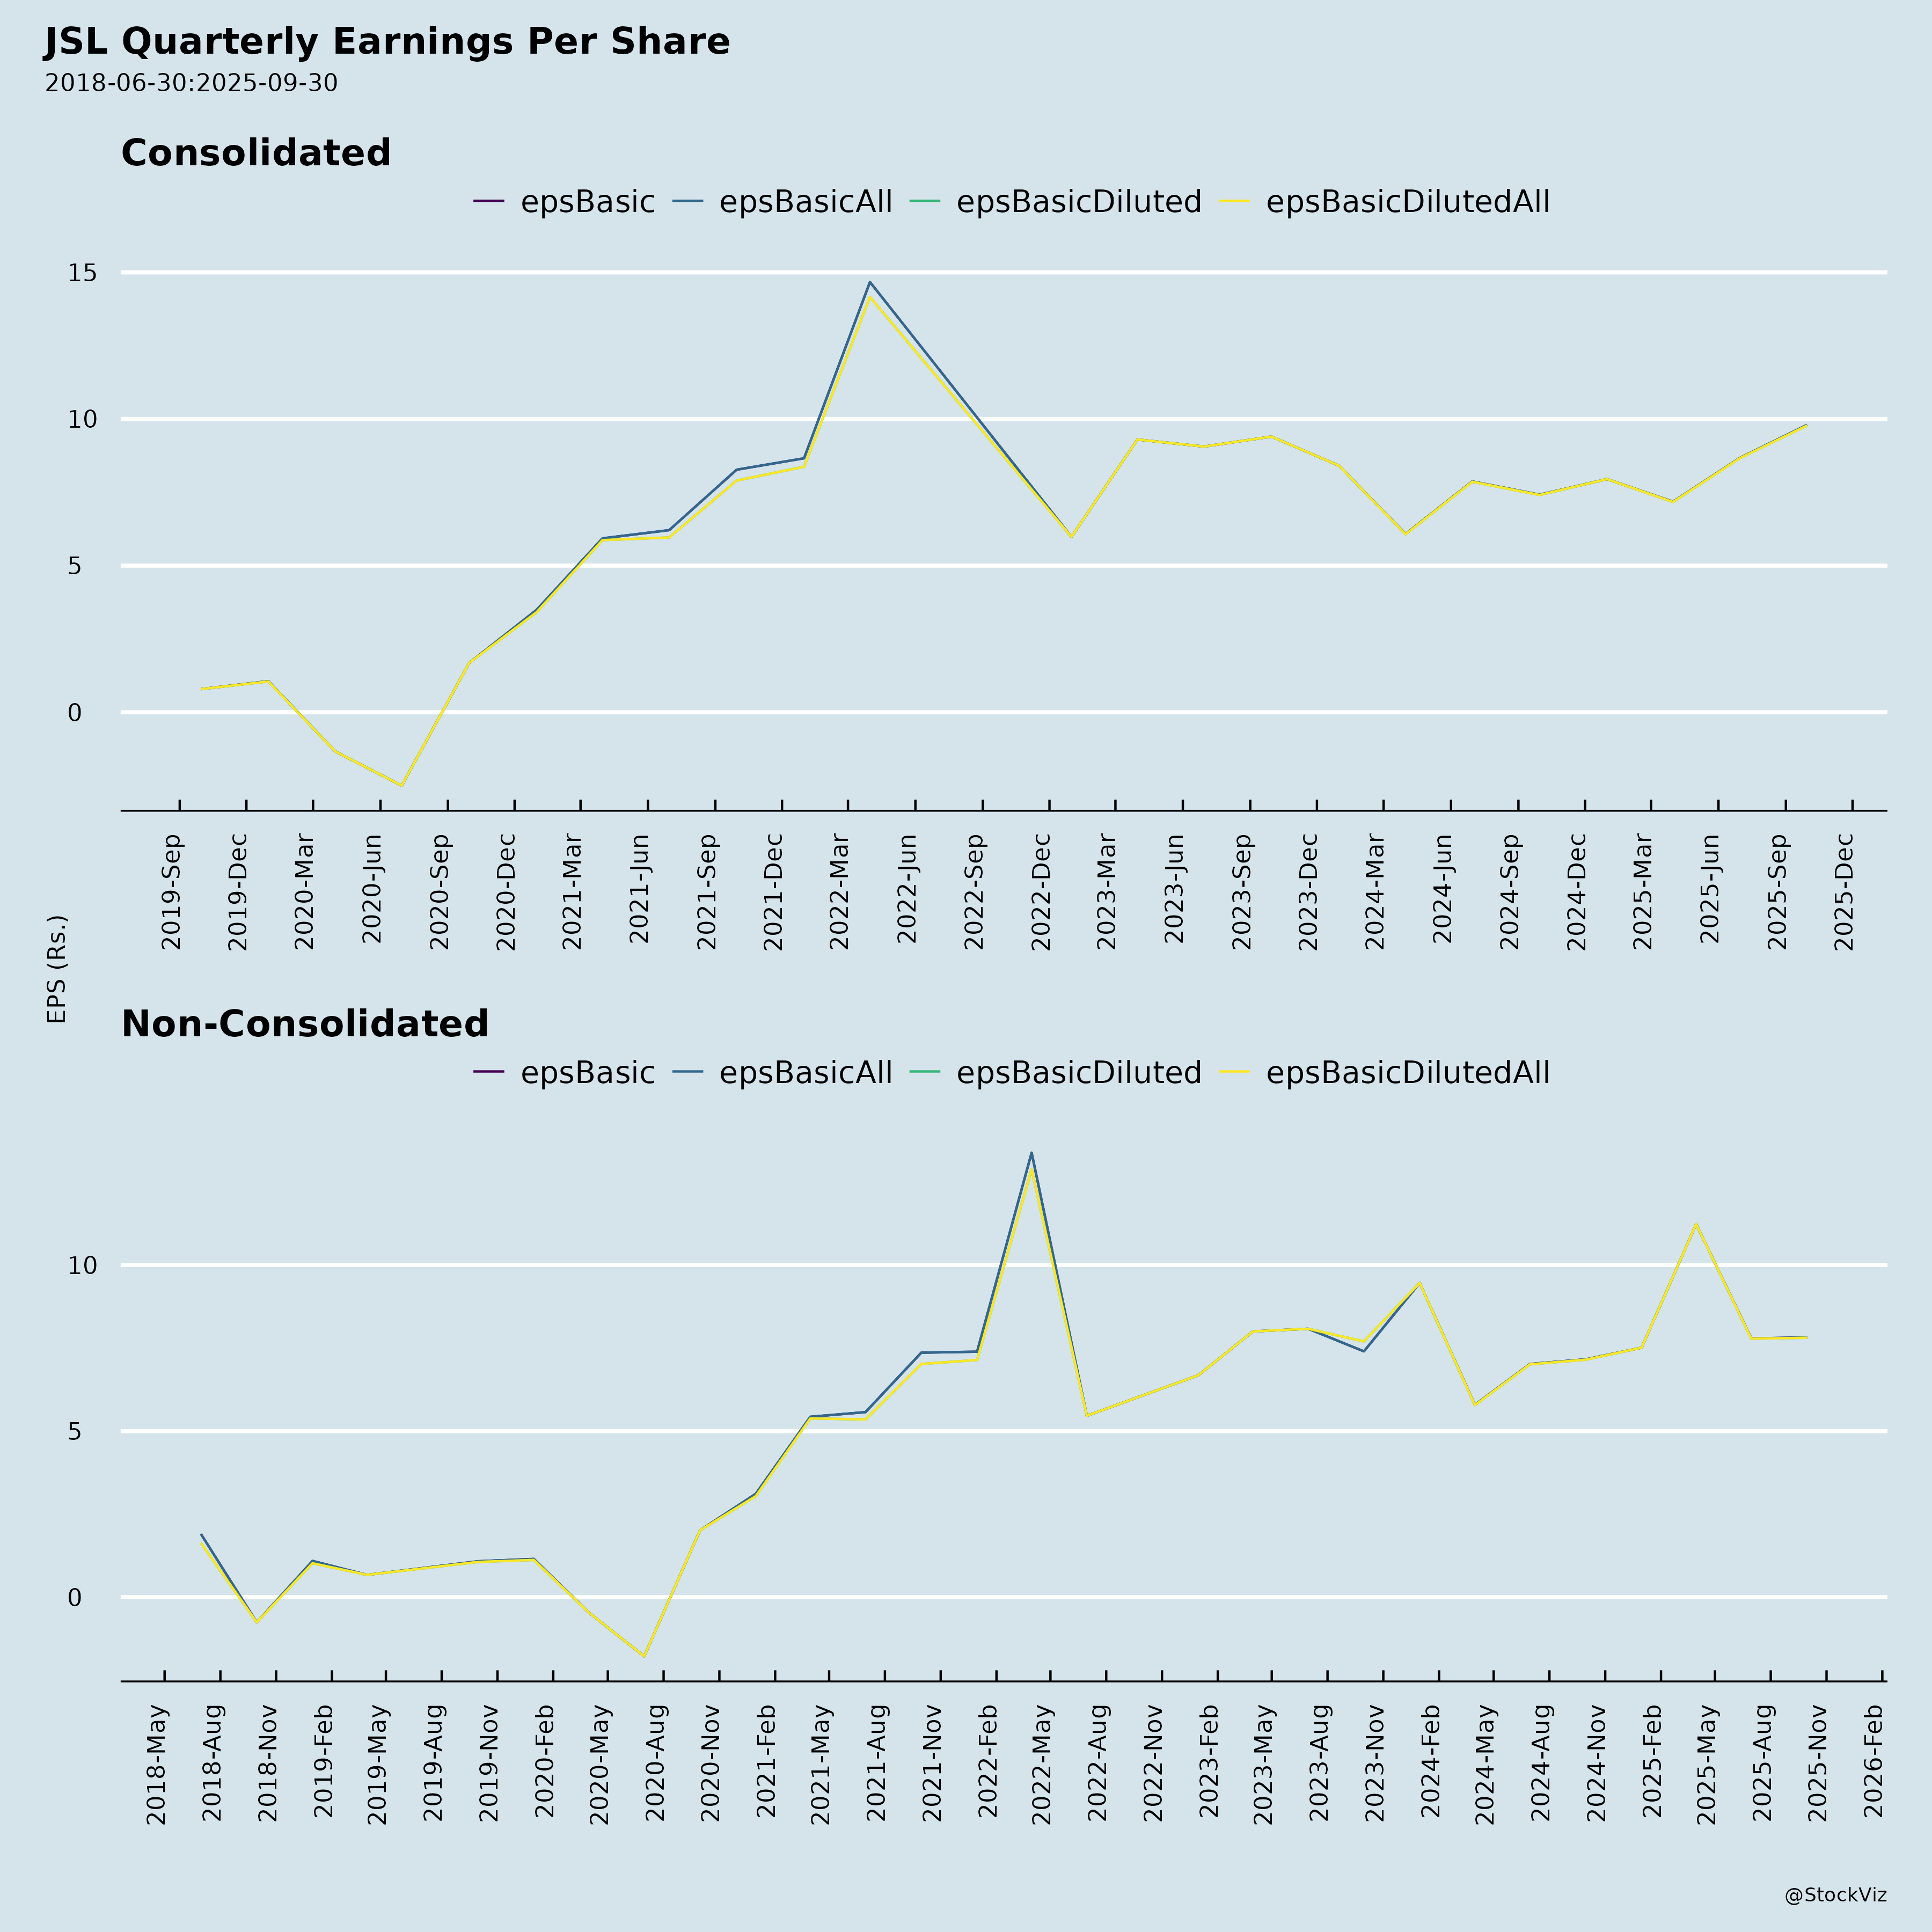
- Profitability Improvement:
- Net Profit (Standalone, H1 FY26): INR 1,286 crore (vs INR 1,168 crore in H1 FY25), +10.1% YoY.
- Net Profit Margin (Standalone): Improved to 6.06% from 5.92% in H1 FY25.
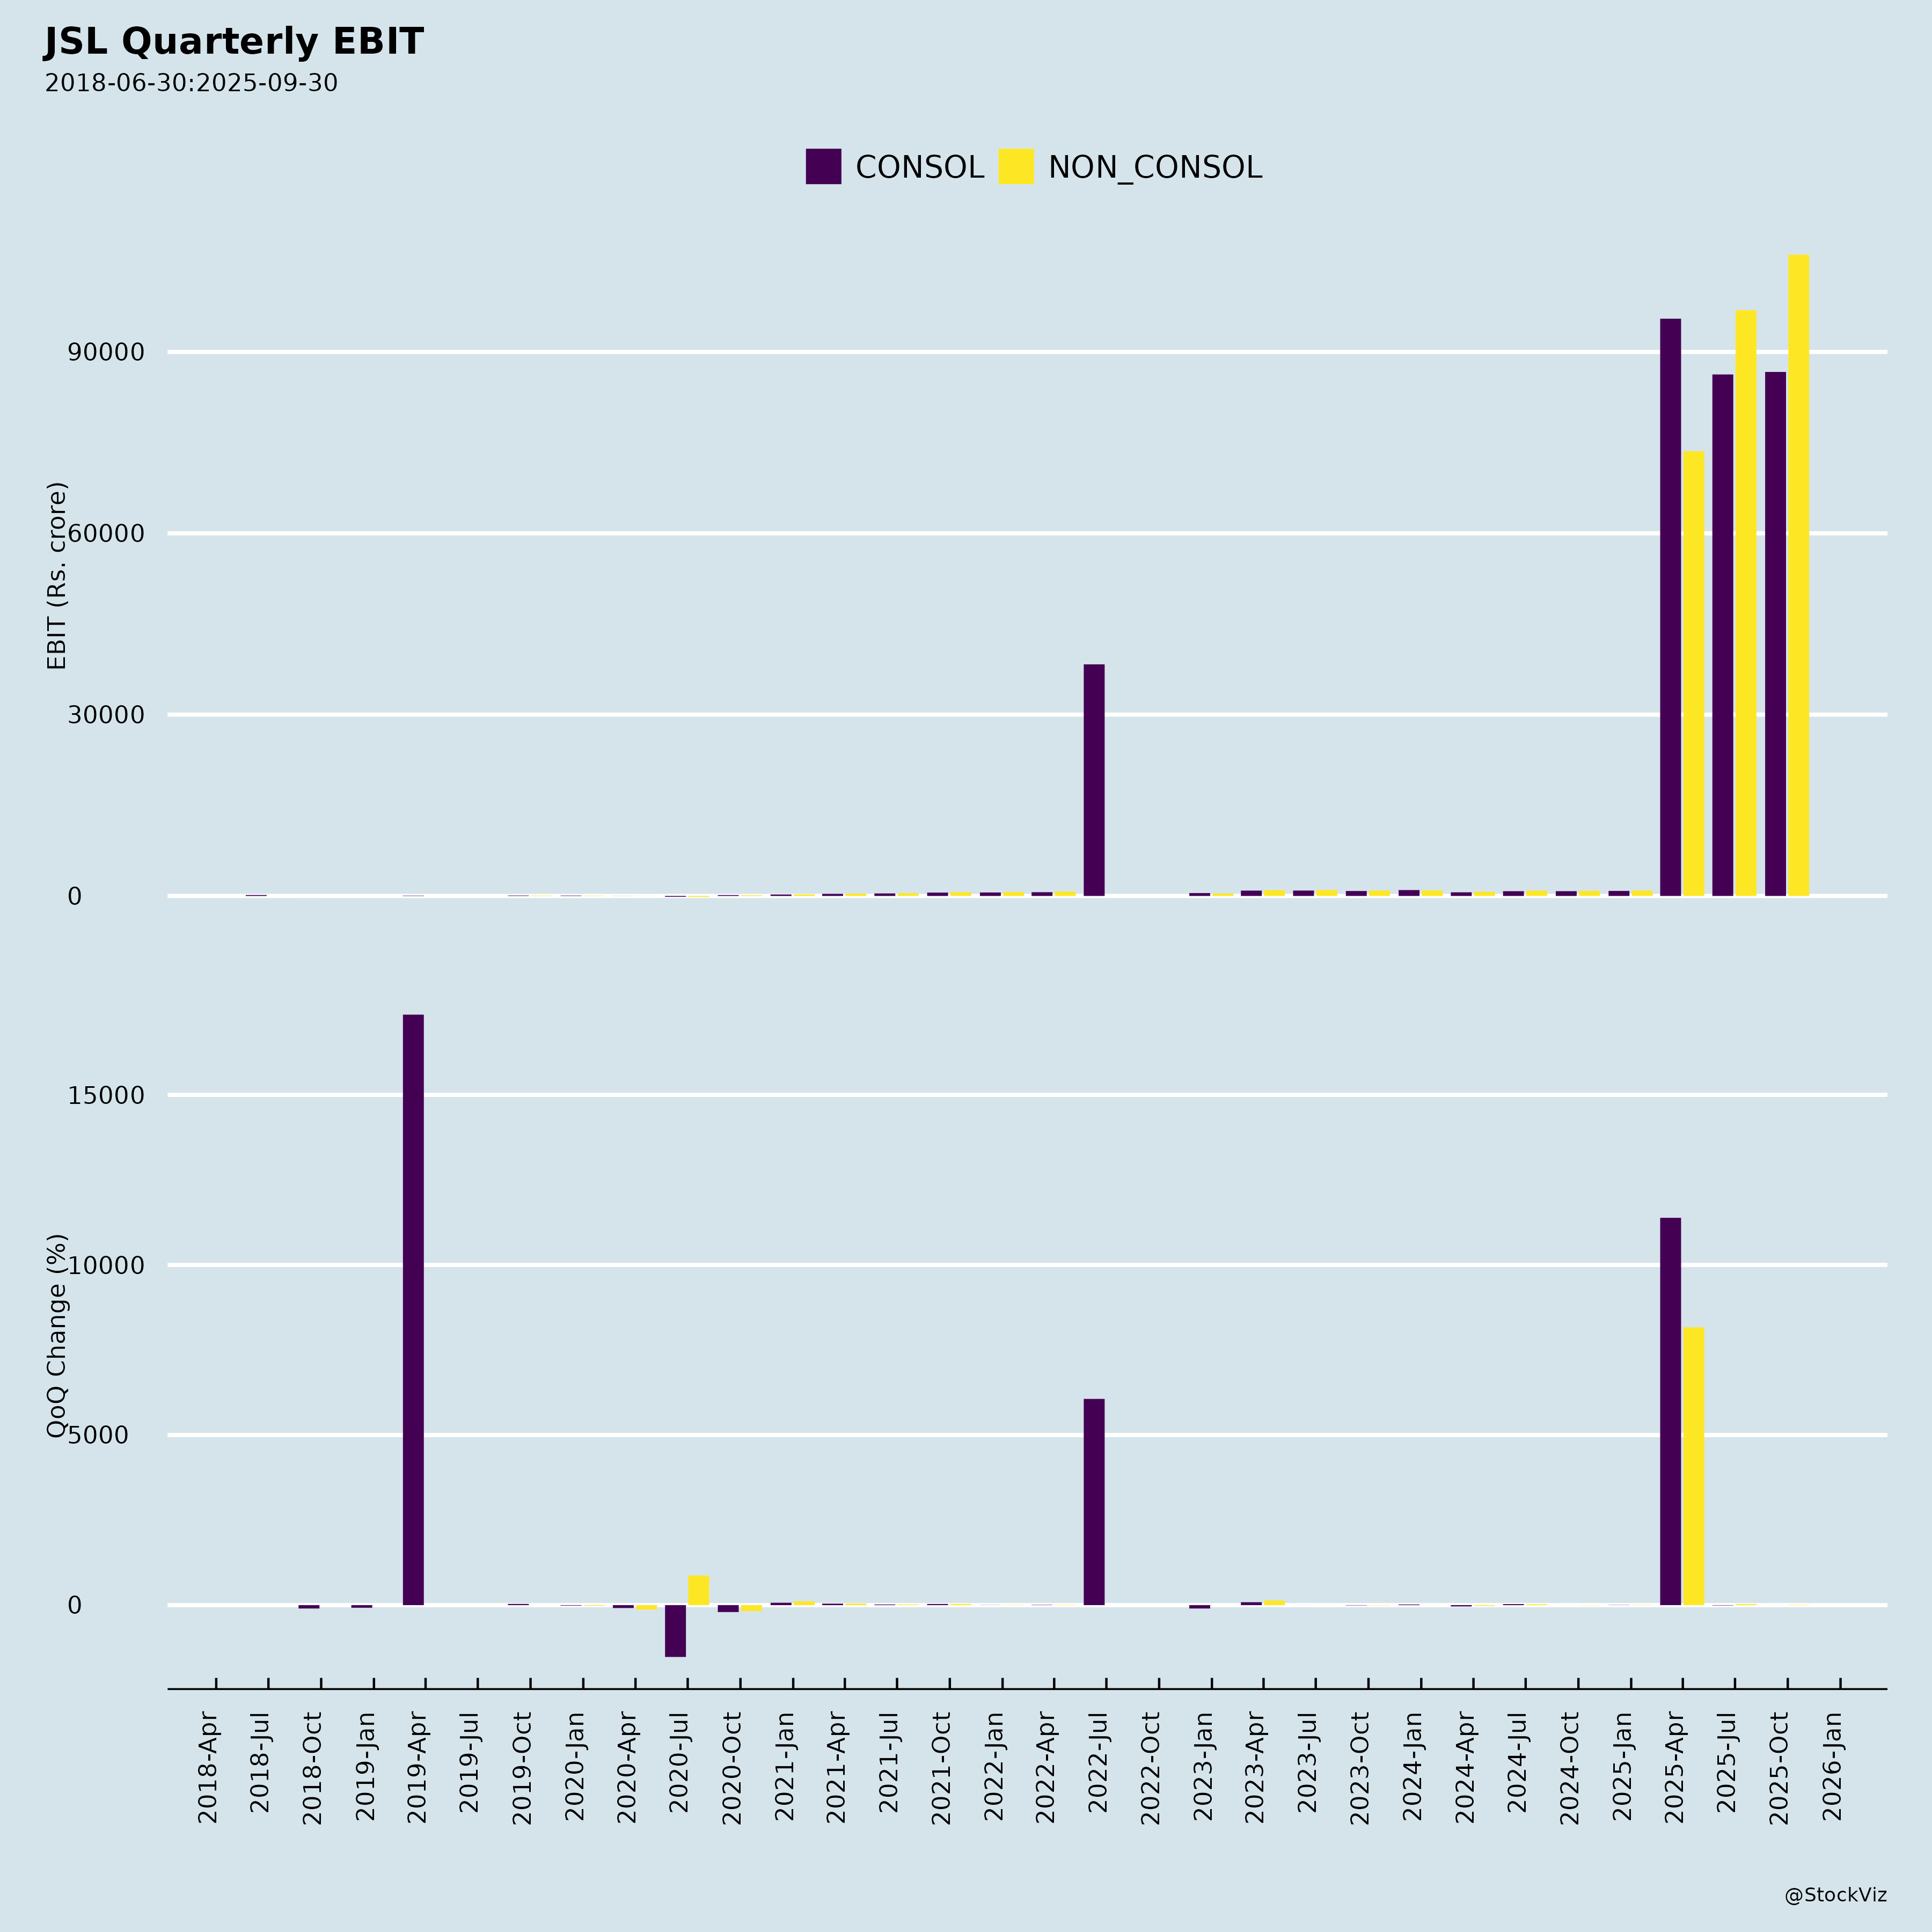
- EBITDA Margin (Standalone): Around 9.7–10.1%, indicating pricing power and cost control.
The financial momentum indicates a recovery cycle and operational efficiency gains.
2. Strategic Expansion: Melt Capacity to 4.2 MTPA
- JSL is building a stainless steel melt shop (SMS) in Indonesia via a collaboration with PT Glory Metal Indonesia (PTGMI), initially a JV, now restructured as a step-down subsidiary from July 2025.
- Total Investment: ~INR 715 crore (spread over tranches)
- Impact:
- Increases annual stainless steel capacity by 40% – from 3 MTPA to 4.2 MTPA.
- Positions JSL among global stainless steel leaders.
- Diversifies manufacturing base into international markets (Asia + Europe via Spain operations).
This expansion is critical for scaling and reducing cost per unit economy.
3. Improved ESG Credentials: Global Recognition
- DJSI ESG Score (FY25): 78, placing JSL in top 5% globally among steel companies.
- Ranking: 4th in steel sector globally, 1st in stainless steel.
- Scores:
- Environmental: 83 (vs global avg: 37)
- Social: 73 (vs 35)
- Governance: 76 (vs 36)
- 97% data availability + 100 in Transparency & Reporting — a key differentiator.
- Golden Peacock Award 2025 (Sustainability) – Only steel company to receive it.
Strong ESG profile enhances brand value, investor appeal (ESG funds), and export competitiveness in green markets (EU, US).
4. Decarbonization Initiatives & Green Manufacturing
- Manufacturing via Electric Arc Furnaces (EAFs) – inherently lower carbon footprint than blast furnaces.
- Key Projects Driving Emissions Down:
- Largest captive solar plant in Odisha.
- Energy efficiency upgrades.
- GHG emissions down 14% YoY in FY25.
- Digitization of supply chain.
Prepares the company for carbon border taxes (CBAM-like mechanisms) in key export destinations.
5. Successful Capital Structure Management
- Completed redemption of remaining INR 187.5 crore worth of Non-Convertible Debentures (NCDs) by Sept 2025.
- Outstanding NCDs (as of Sept 2025): INR 99 crore (due Sept 2026) – well-managed maturity profile.
- Debt-to-Equity Ratio (Standalone, H1 FY26): 0.26 (down from 0.30 in H1 FY25).
- Credit Rating Maintained: “AA/Stable” (long-term), “A1+” (short-term).
- Interest Service Coverage Ratio (H1 FY26): 3.59x, indicating healthy interest coverage.
Low leverage and strong credit rating reduce refinancing risk and cost of capital.
⚠️ Headwinds (Challenges)
1. Volatility in Raw Material Prices
- Nickel, chromium, ferroalloys: Major cost components (Cost of materials = ~71% of total expenses).
- Global commodity price swings directly impact margins.
- Limited backward integration in raw materials increases exposure.
Margin pressures could re-emerge if input costs surge (e.g., due to geopolitical issues in Indonesia or Belarus).
2. Indonesia Subsidiary Liquidation Underway (PT Jindal Stainless Indonesia)
- Voluntary liquidation approved in FY24.
- Though management expects full recovery of carrying value, liquidation timelines and stakeholder clearances remain uncertain.
- Could delay monetization or tie up capital temporarily.
Represents legacy complexity and governance overhead.
3. Global Steel Demand Uncertainty
- Sluggish demand in Europe, US, and China could affect export volumes.
- JSL has a global footprint, making it vulnerable to regional recessions or trade barriers.
- Despite green transition demand, industrial stainless steel growth may lag.
Cyclical nature of steel markets impacts EBITDA stability.
4. Tax Policy Uncertainty
- Suprеmе Cоurt (July 2024): States can levy tax on mineral rights.
- Impact on JSL is “currently unascertainable” (per notes).
- Potential increase in royalty or tax burden on mining operations or raw material access.
Regulatory unpredictability poses financial and strategic risks.
5. Working Capital Pressure
- Inventory Turnover Ratio (H1 FY26): ~3.3x → implies ~110 days inventory cycle.
- Debtors Turnover Ratio (H1 FY26): ~10x → ~36 days receivables.
- Cash Conversion Cycle likely stretched due to high raw material inventory.
Working capital efficiency needs improvement to release cash.
6. Execution Risk in Indonesia Expansion
- While the PTGMI deal is progressing (now a subsidiary), construction of SMS depends on timely approvals, financing, and project management.
- Past JV conversions may have added complexity.
Delays could push capacity expansion beyond FY27, delaying ROI.
🔮 Growth Prospects (Forward Outlook)
| Area | Outlook |
|---|---|
| Volume Growth | +40% by FY27 due to Indonesia SMS. Export focus likely. |
| Margin Expansion | Possible via cost rationalization, shared services, and operational efficiency. |
| ESG Leadership | Potential to command green premium in exports; access to sustainability-linked financing. |
| Global Branding | DJSI and Golden Peacock awards enhance reputation in EU/USA. |
| Digital Transformation | Supply chain digitization can reduce inventory days and improve forecasting. |
| Innovation & Product Mix | High-margin products (precision strips, coin blanks, blade steel) may drive margins up. |
✅ CAGR Outlook (FY25–FY27): Revenue ~8–10%, Net Profit ~12–15% (assuming stable input costs).
🔴 Key Risks Summary
| Risk Category | Description |
|---|---|
| Operational Risk | Delays in Indonesia SMS ramp-up; JV integration complexity. |
| Commodity Risk | Volatility in nickel, chromium, and energy prices. |
| Regulatory Risk | Potential new tax on mineral rights; ESG compliance burden. |
| Execution Risk | Capital-intensive expansion projects. |
| Liquidity Risk | Working capital intensity of metal business. |
| Market Risk | Global steel oversupply, trade barriers, cyclical demand. |
| Geopolitical Risk | Exposure in Indonesia and Europe; political or policy instability. |
✅ Positive Catalysts
- Successful launch of SMS in Indonesia → volume ramp-up.
- Further ESG awards or green certifications → export edge.
- Cost synergy realization from shared services subsidiary.
- Increase in domestic stainless steel demand (auto, infrastructure, renewable energy sectors).
- Divestment of non-core assets (e.g., liquidated units) → cash inflow.
❌ Negative Triggers to Monitor
- Spike in ferroalloy prices or power costs.
- Slower-than-expected Indonesian regulatory clearances.
- Delay in EAF capacity addition.
- Global recession reducing industrial stainless demand.
- CBAM-like carbon taxes in EU if not mitigated by green energy usage.
📊 Financial Snapshot (H1 FY26 – Standalone)
| Metric | Value (INR Cr) / Ratio |
|---|---|
| Revenue from Operations | 21,221.40 |
| Net Profit | 1,285.53 |
| EBITDA Margin (est.) | ~10% |
| EPS (Diluted) | INR 15.59 |
| Debt-to-Equity | 0.26 |
| Interest Coverage | 3.59x |
| Cash & Equivalents | INR 1,049.83 Cr |
| CAPEX (H1) | INR 1,851 Cr (net, investing activities) |
🔚 Conclusion: Summary
| Category | Assessment |
|---|---|
| Financial Health | Strong – low leverage, improving profitability, strong cash flows from operations. |
| Growth Trajectory | High – driven by 40% capacity expansion and global footprint. |
| Operational Efficiency | Improving – cost control, ESG, shared services. |
| ESG & Branding | Outstanding – world leader among stainless players. Key differentiator. |
| Key Risks | Moderate – commodity volatility and execution risk in Indonesia. |
| Valuation Potential | Attractive for ESG funds and long-term infrastructure/green industrial plays. |
✅ Investment Thesis: Buy (Long-Term)
- Catalysts: Capacity expansion, global ESG positioning, margin improvement.
- Suitable For: Long-term investors seeking sustainable industrial growth.
- Hold if: Commodity prices spike or Indonesia project faces delays.
“Jindal Stainless is transitioning from a traditional metal player to a globally competitive, ESG-led industrial champion — a rare combination in India’s steel sector.”
Let me know if you’d like a 5-year forecast, peer comparison (e.g. Tata Steel, JSW Steel), or valuation analysis (DCF/P/E).
Copyright © 2023 SAS Data Analytics Pvt. Ltd. All rights reserved.