JINDALSTEL
Equity Metrics
September 24, 2026
JINDAL STEEL LIMITED
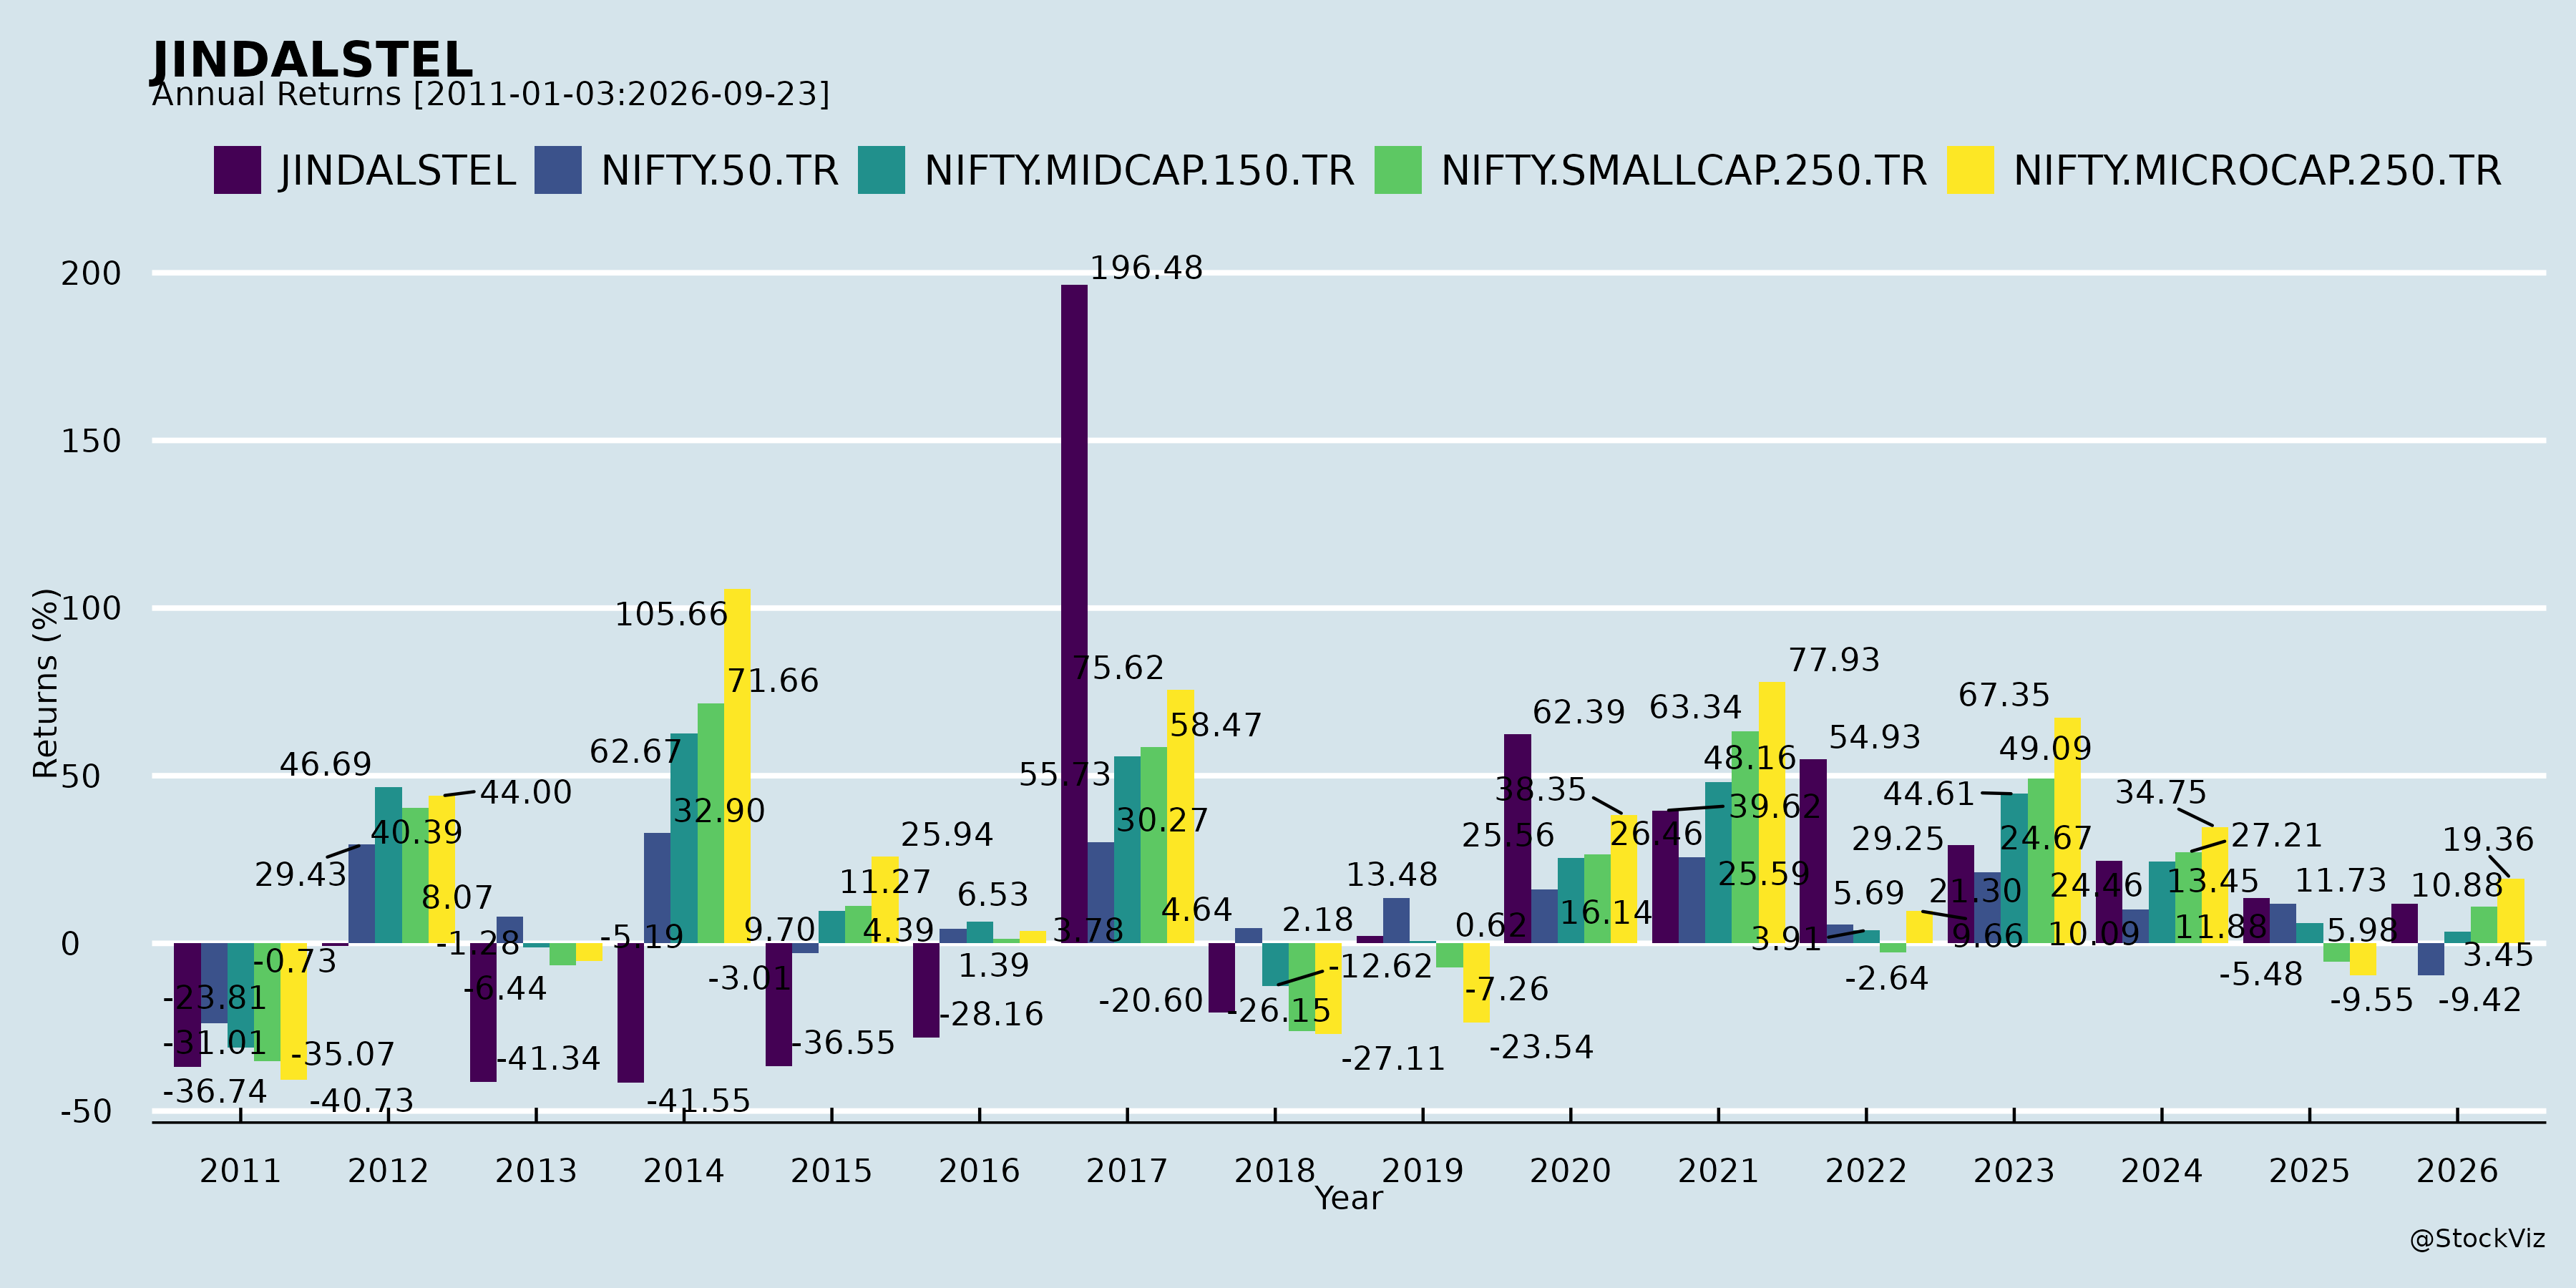
Annual Returns
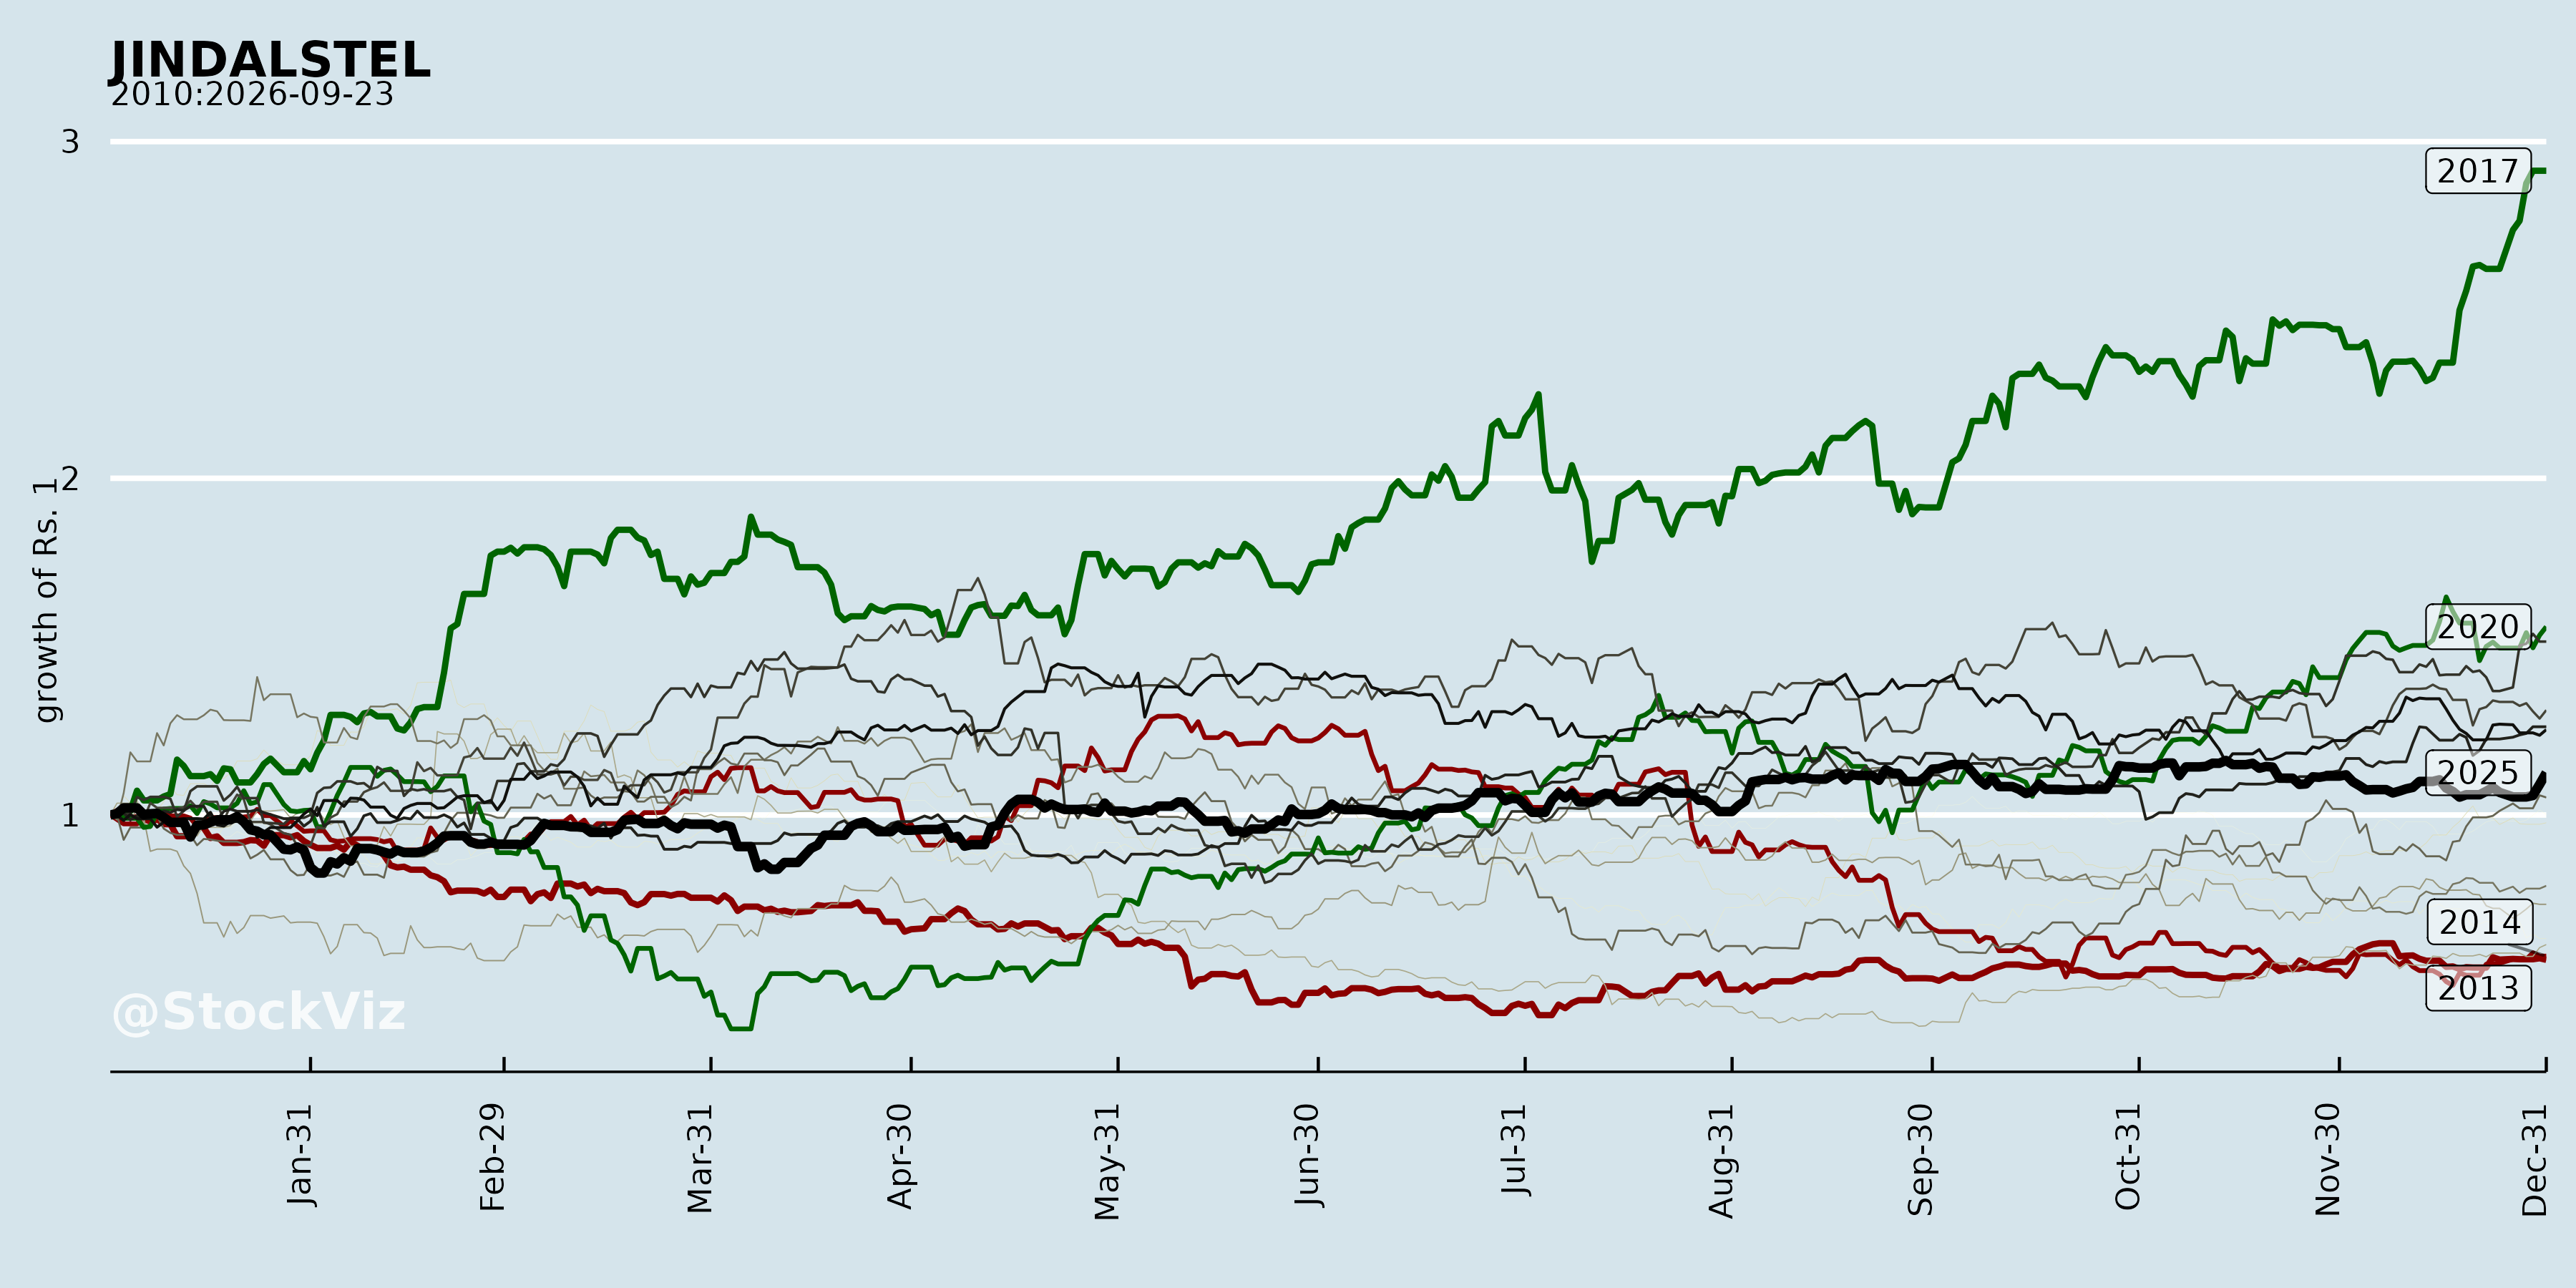
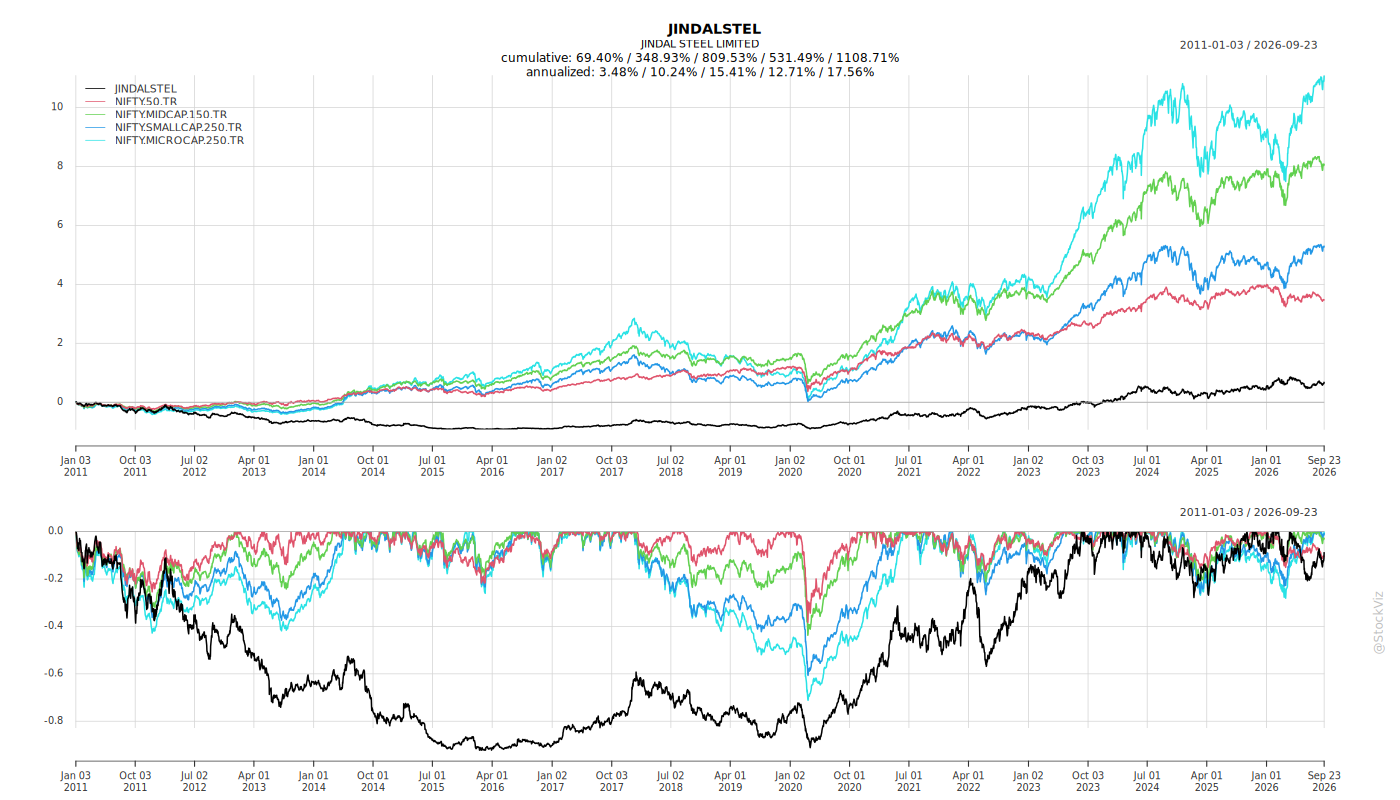
Cumulative Returns and Drawdowns
Fundamentals
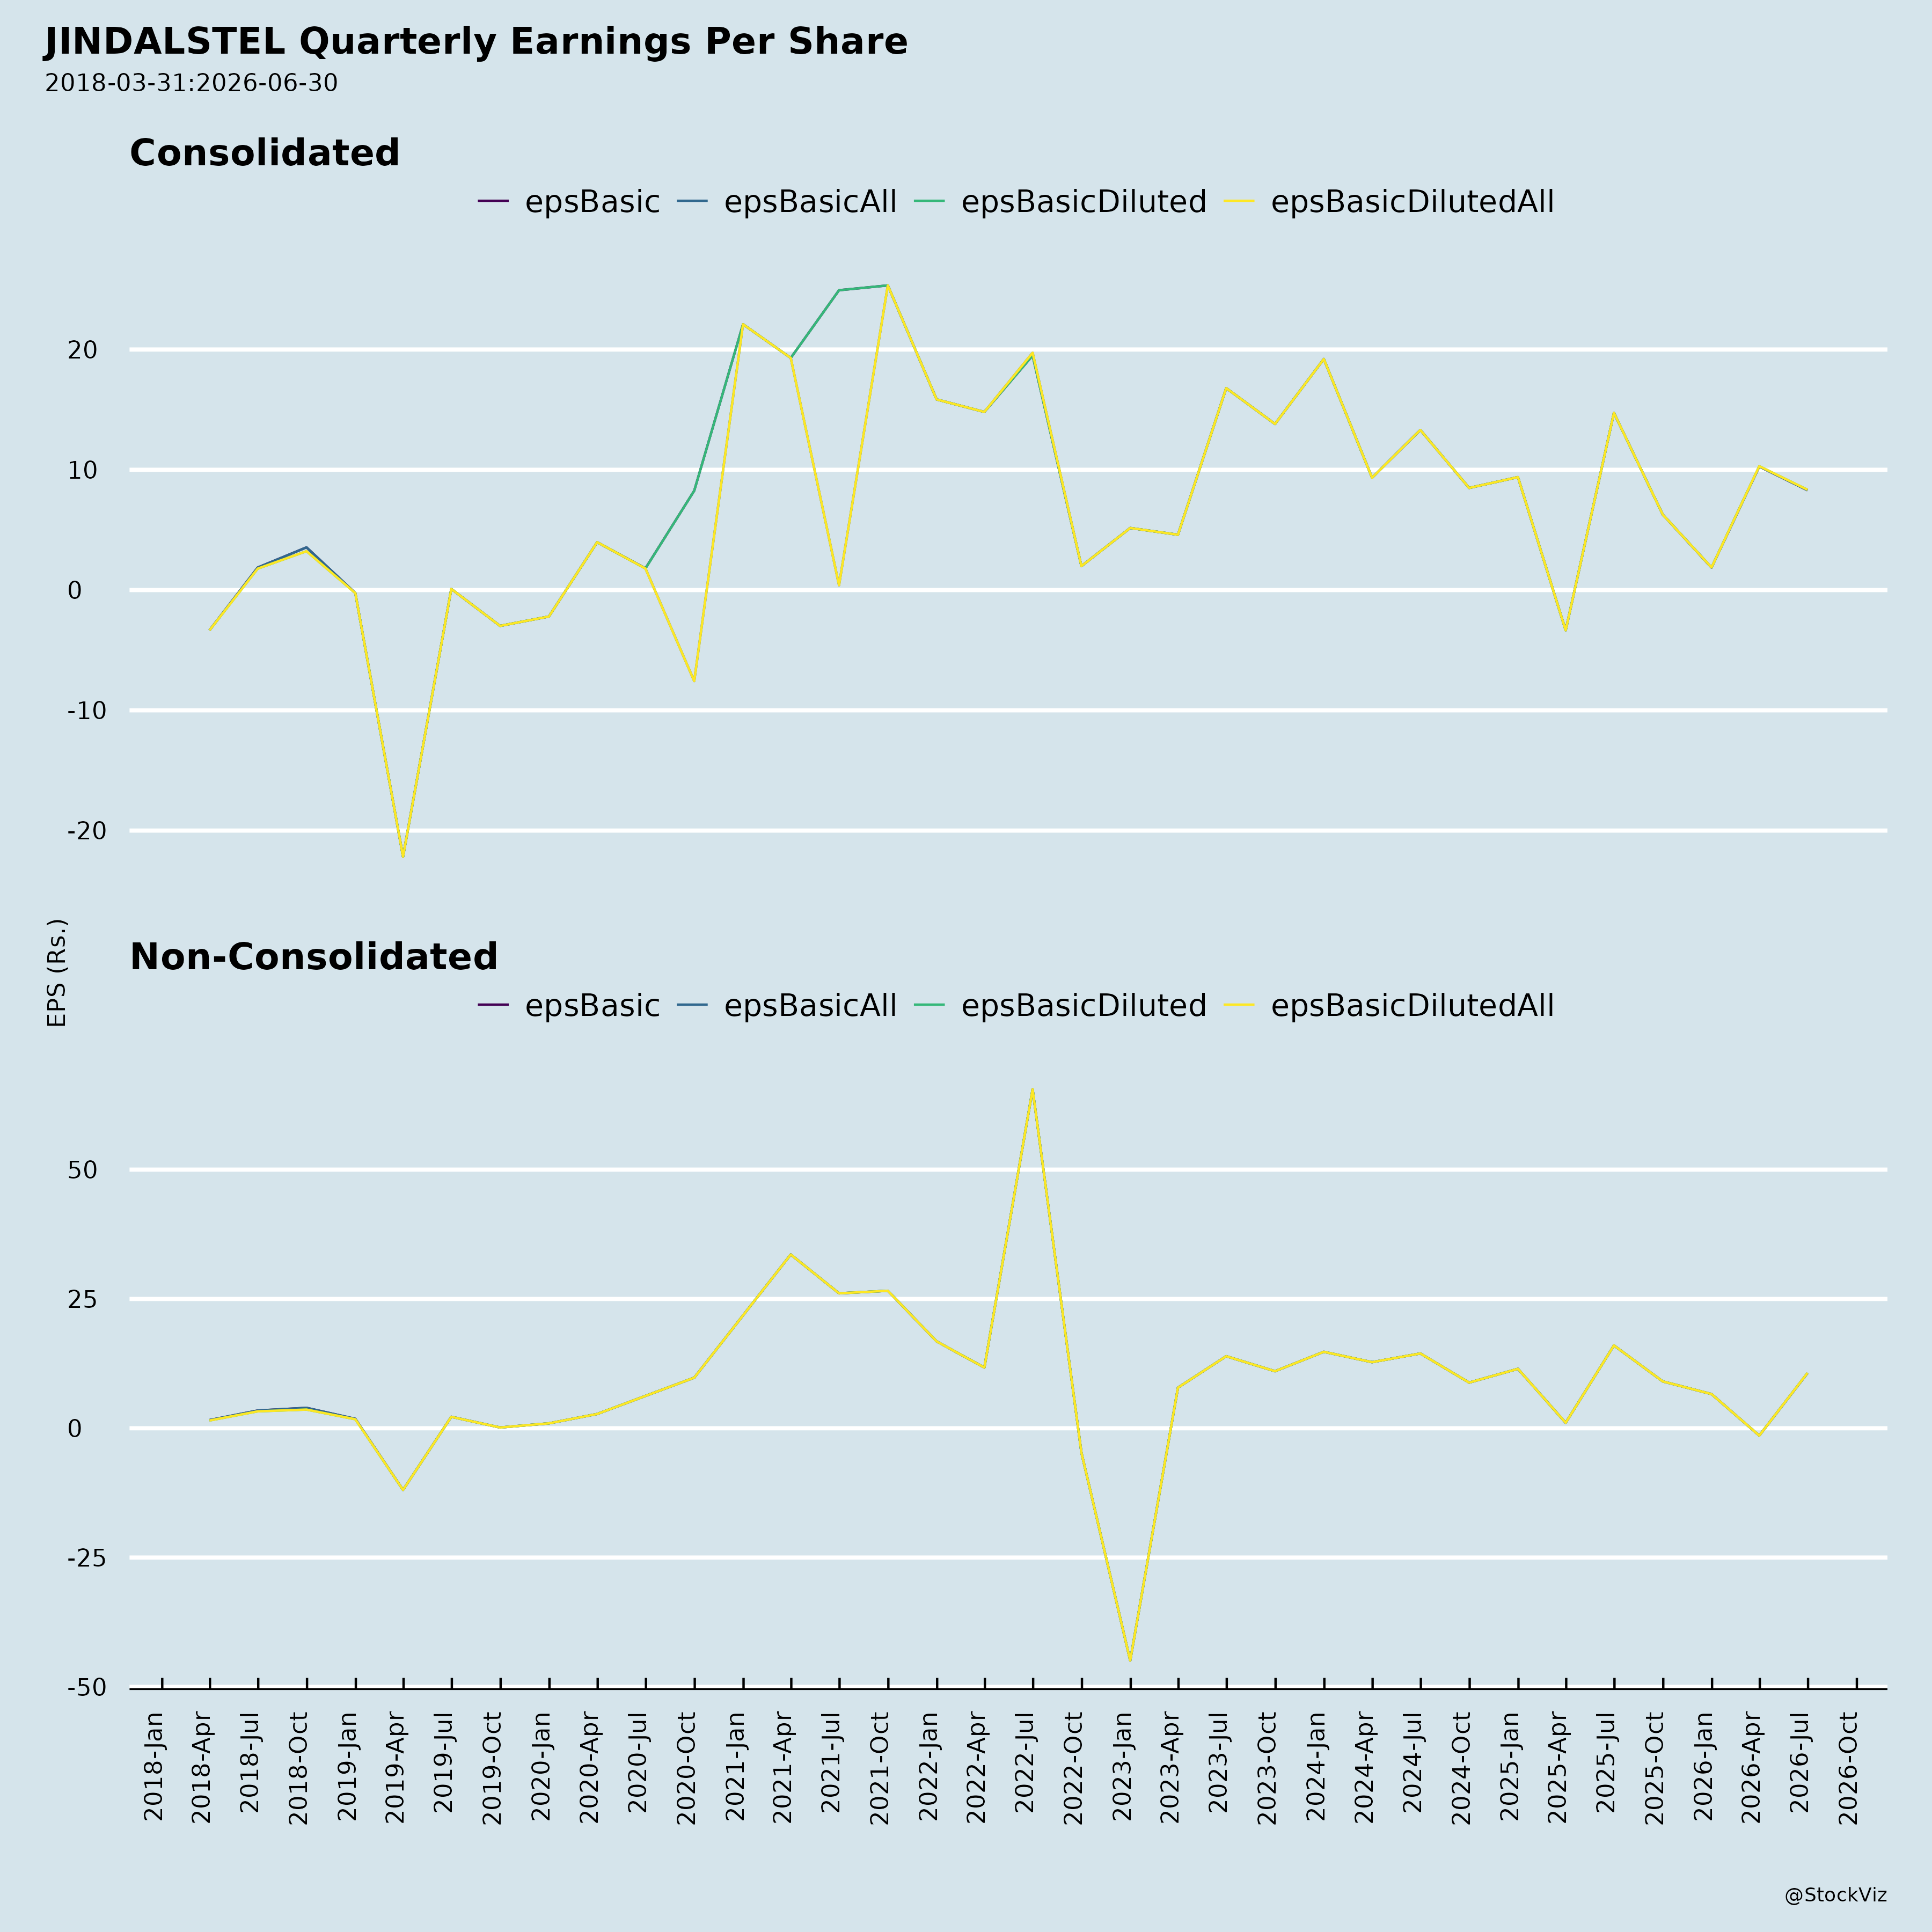
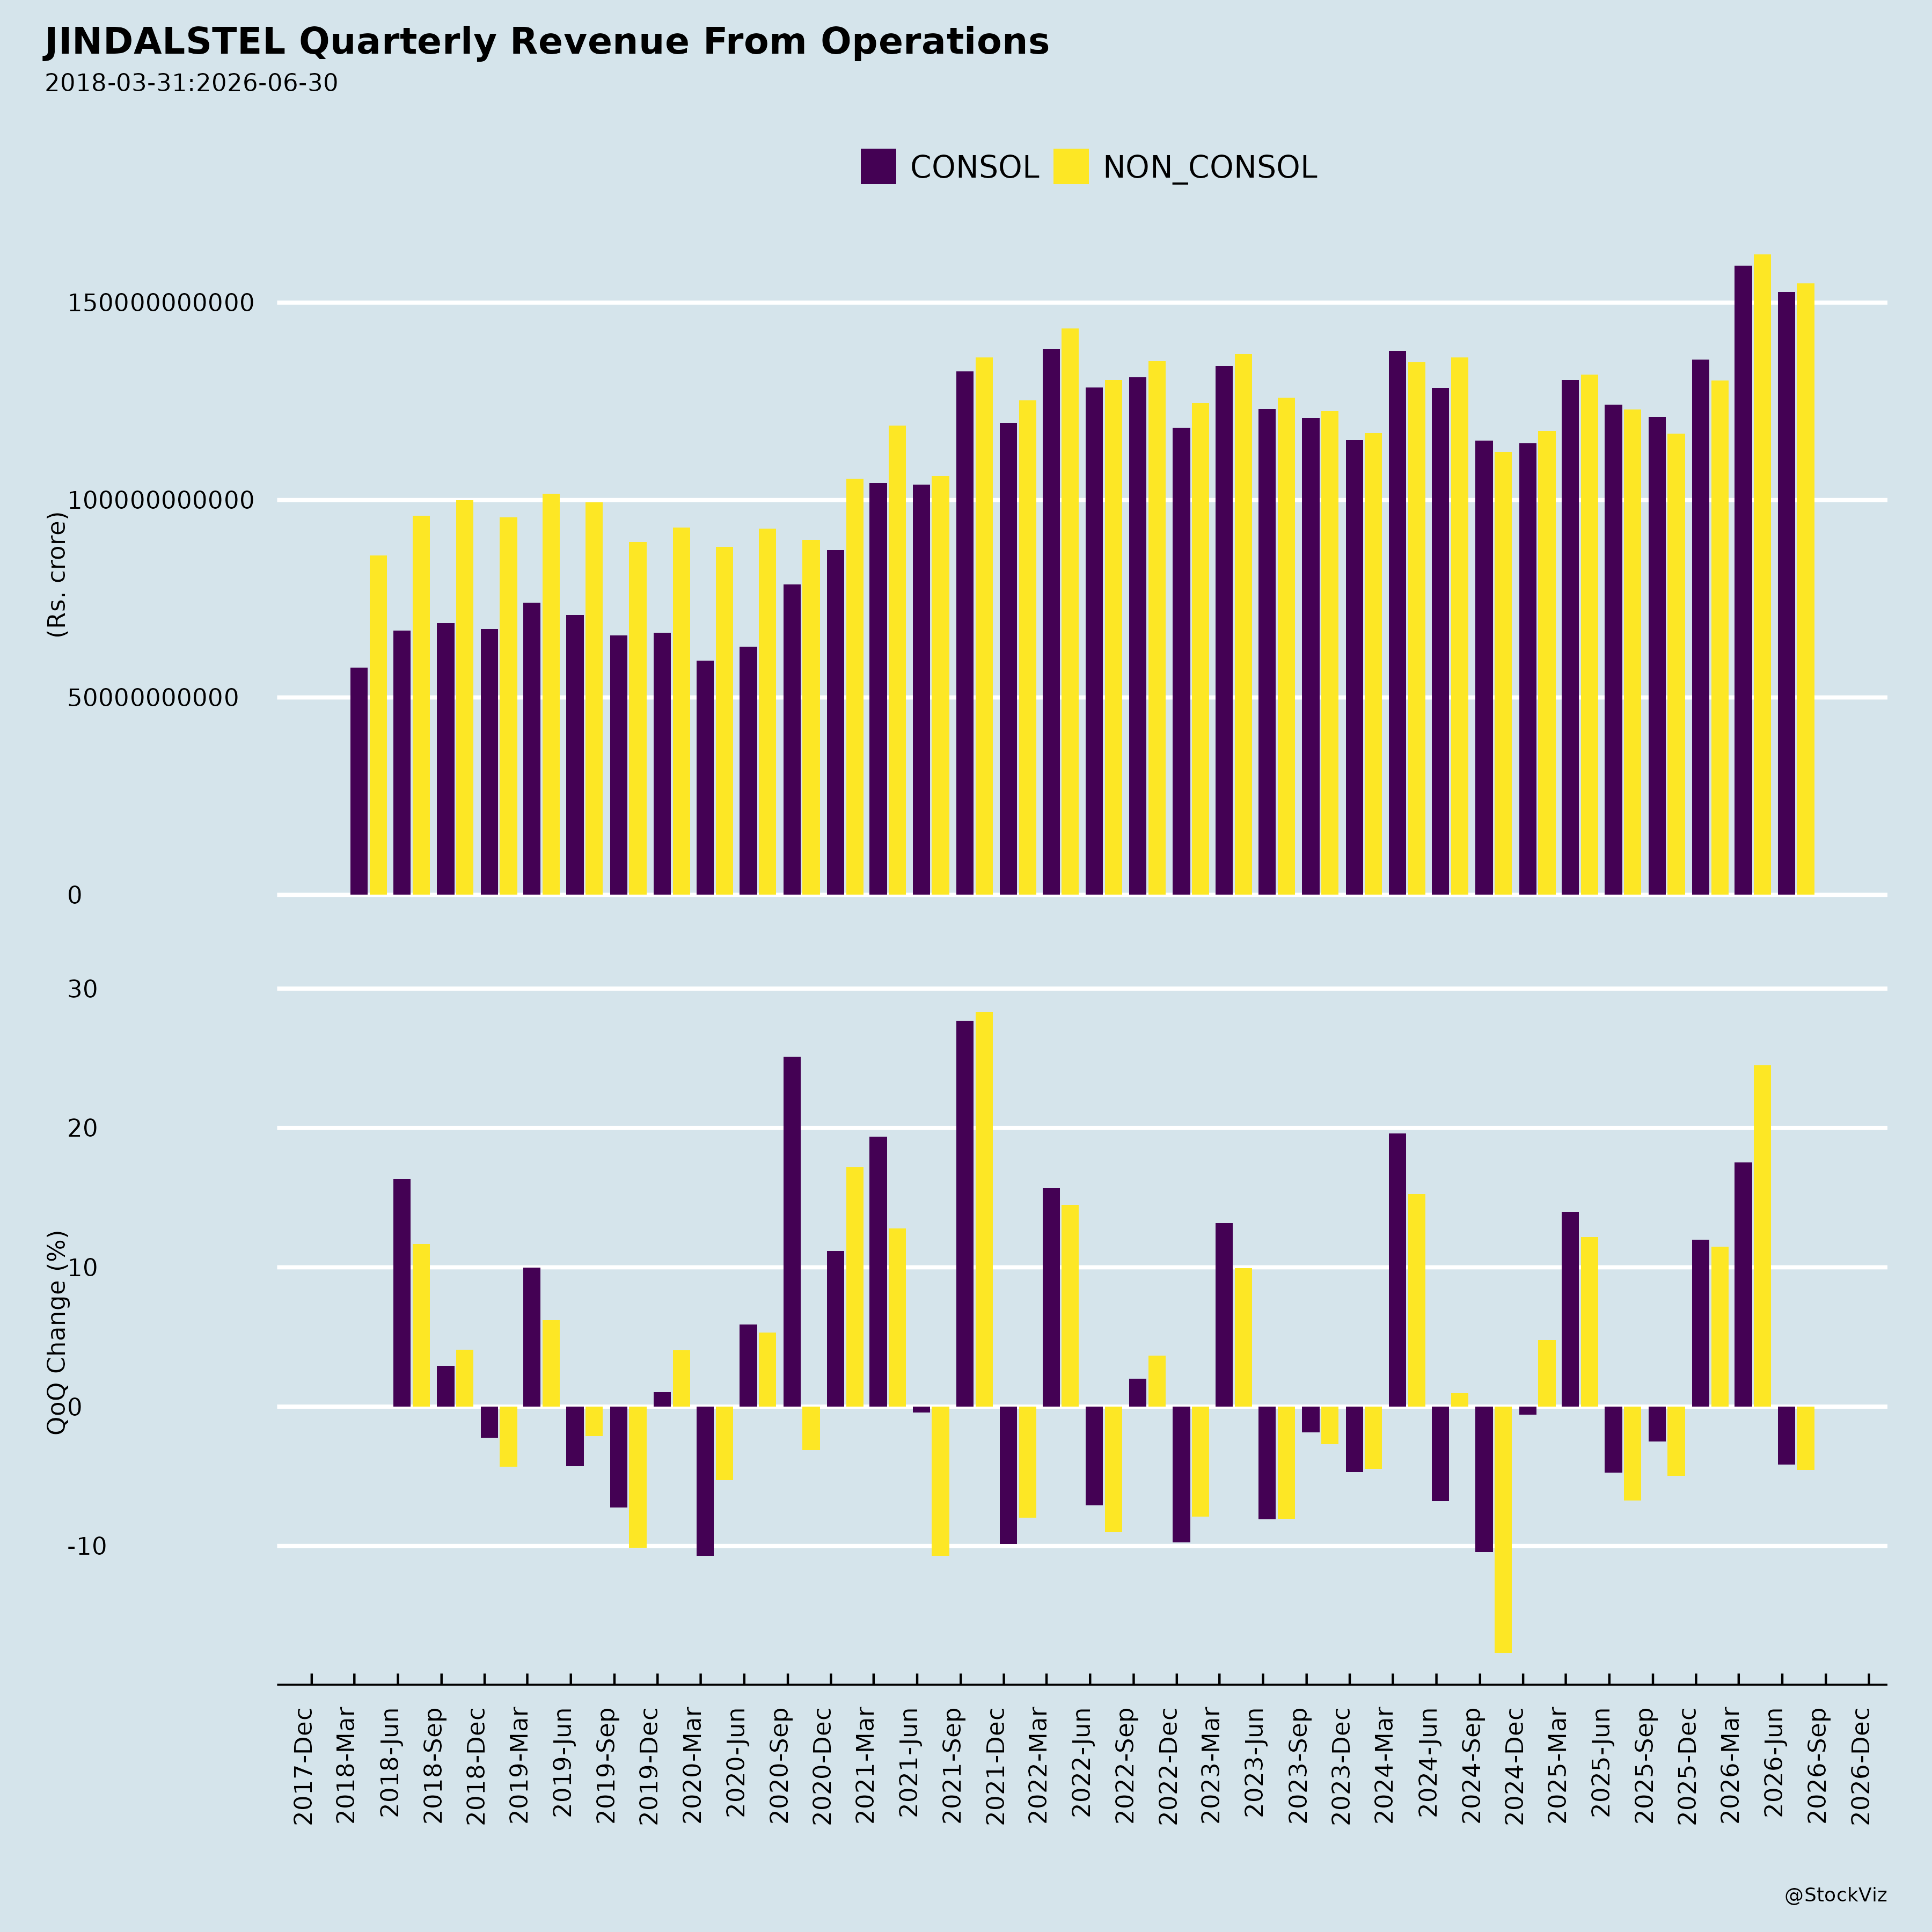
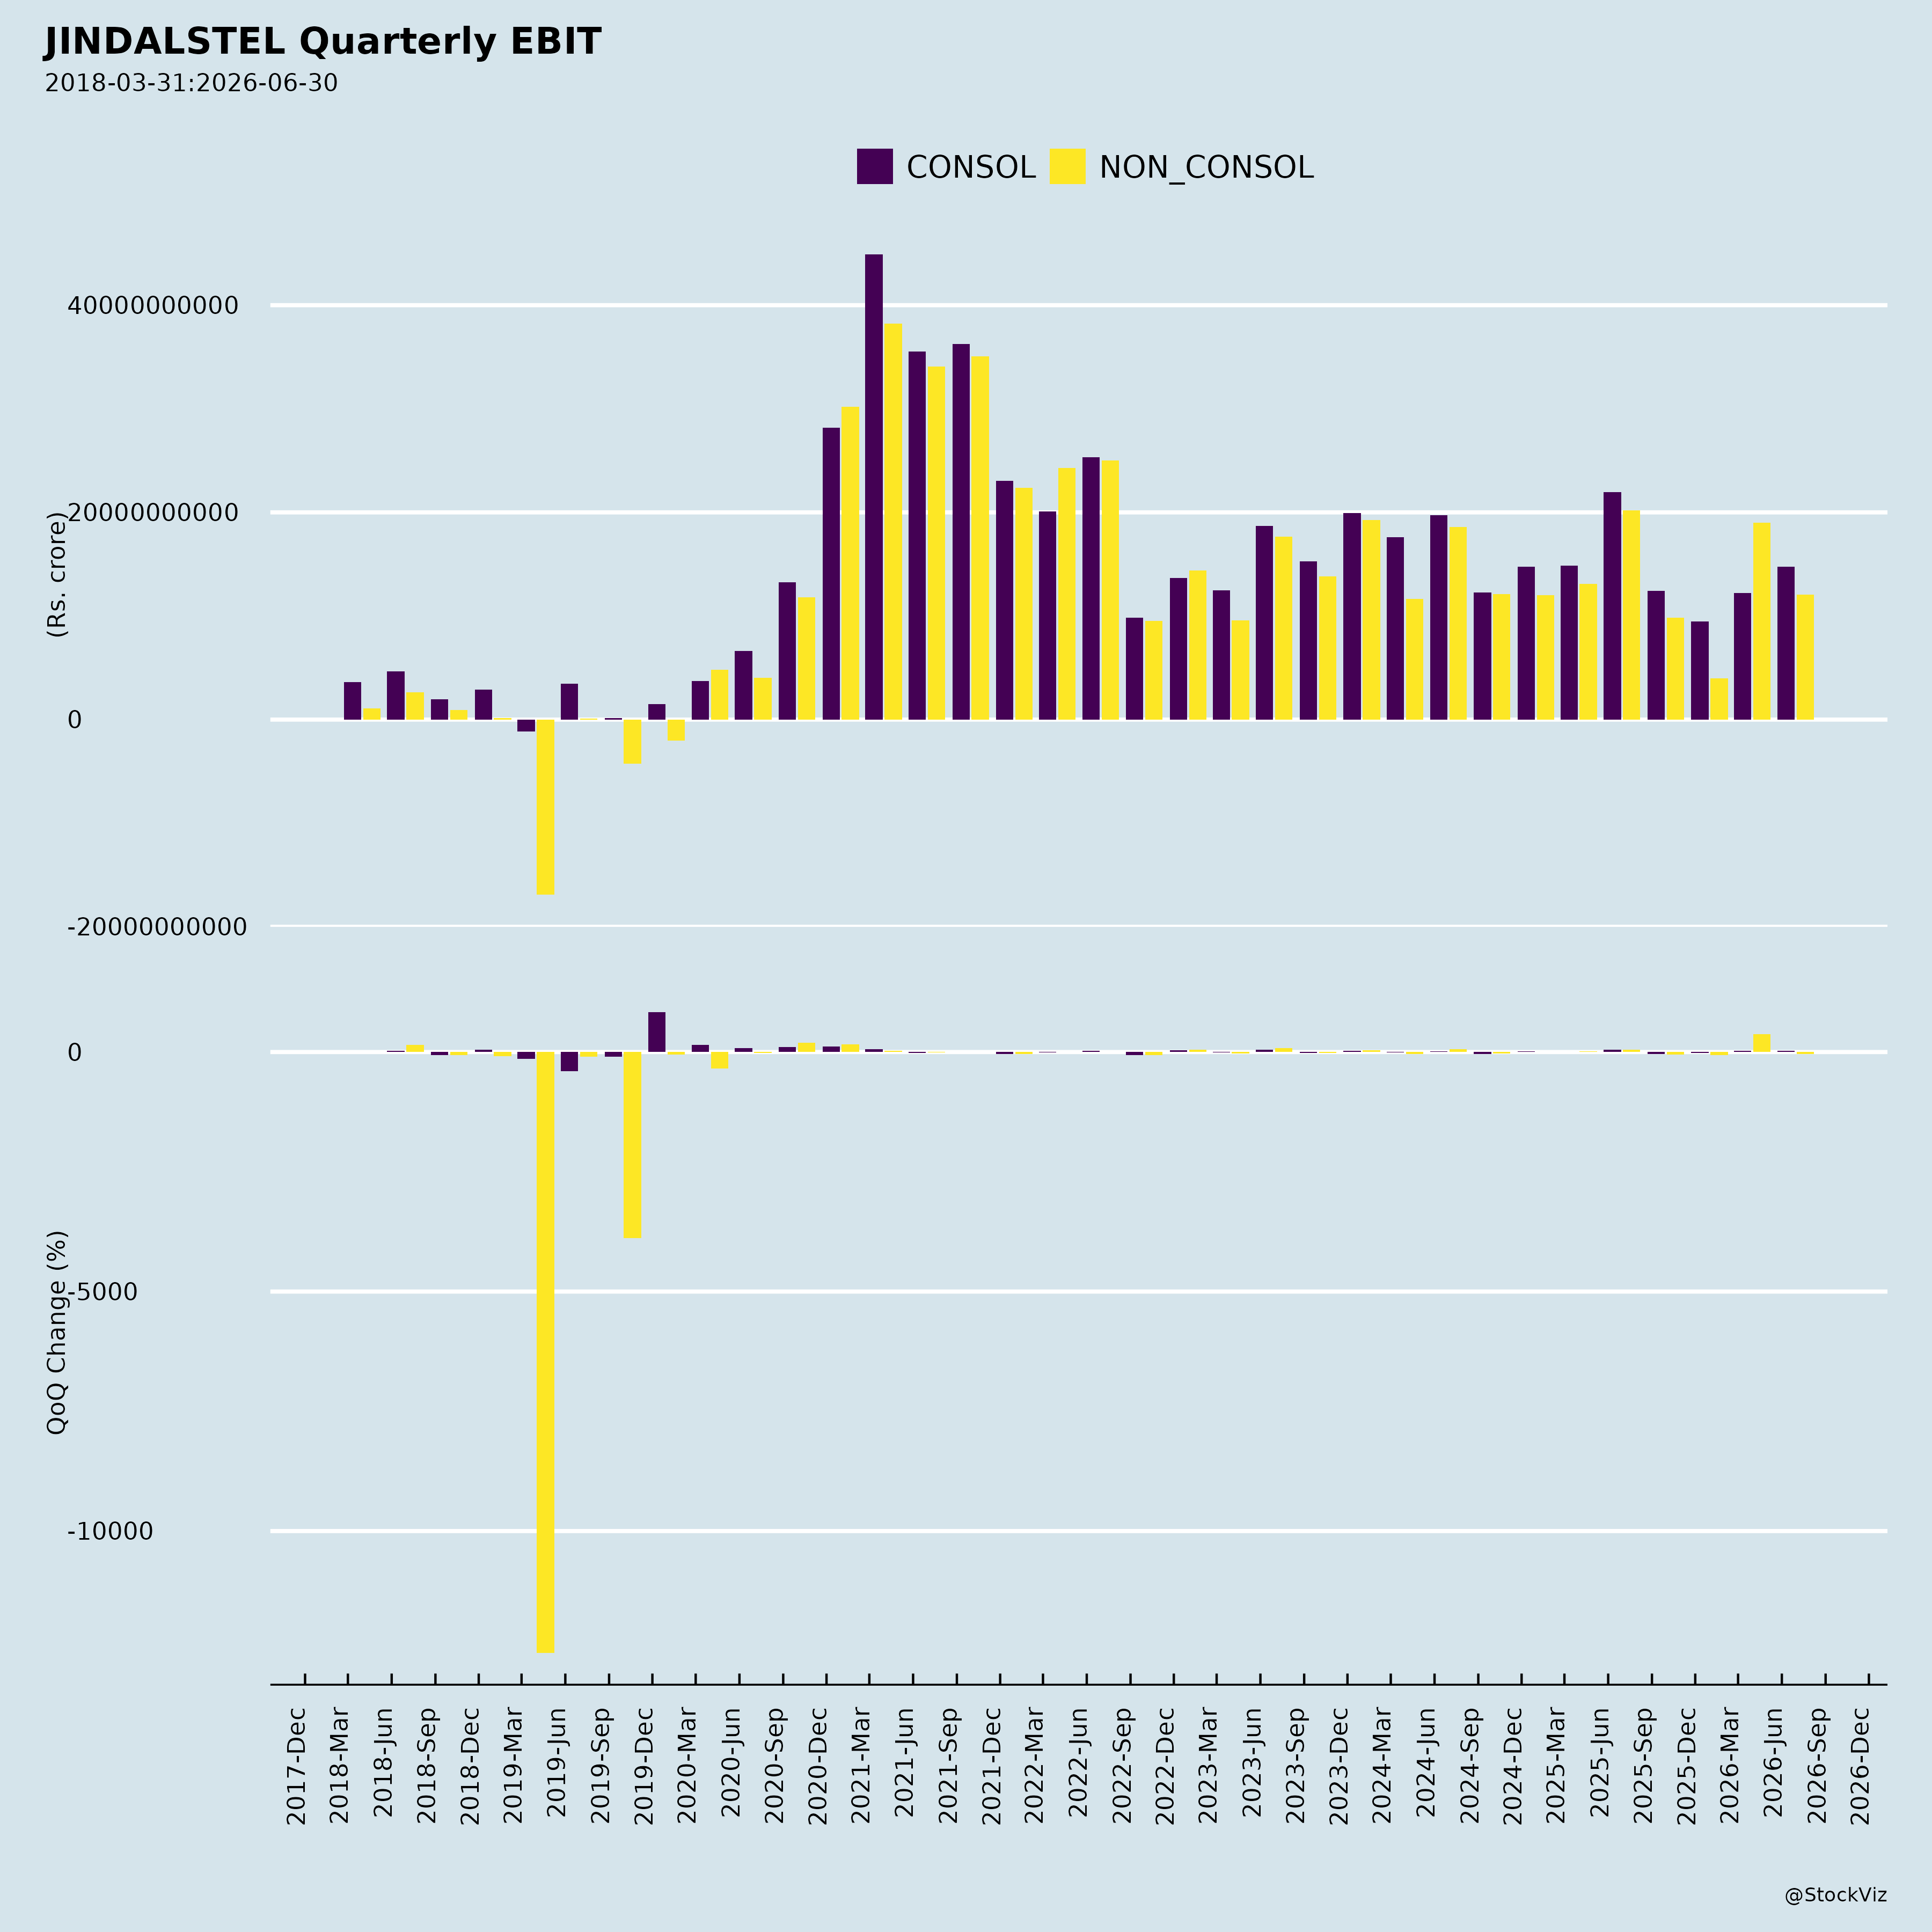
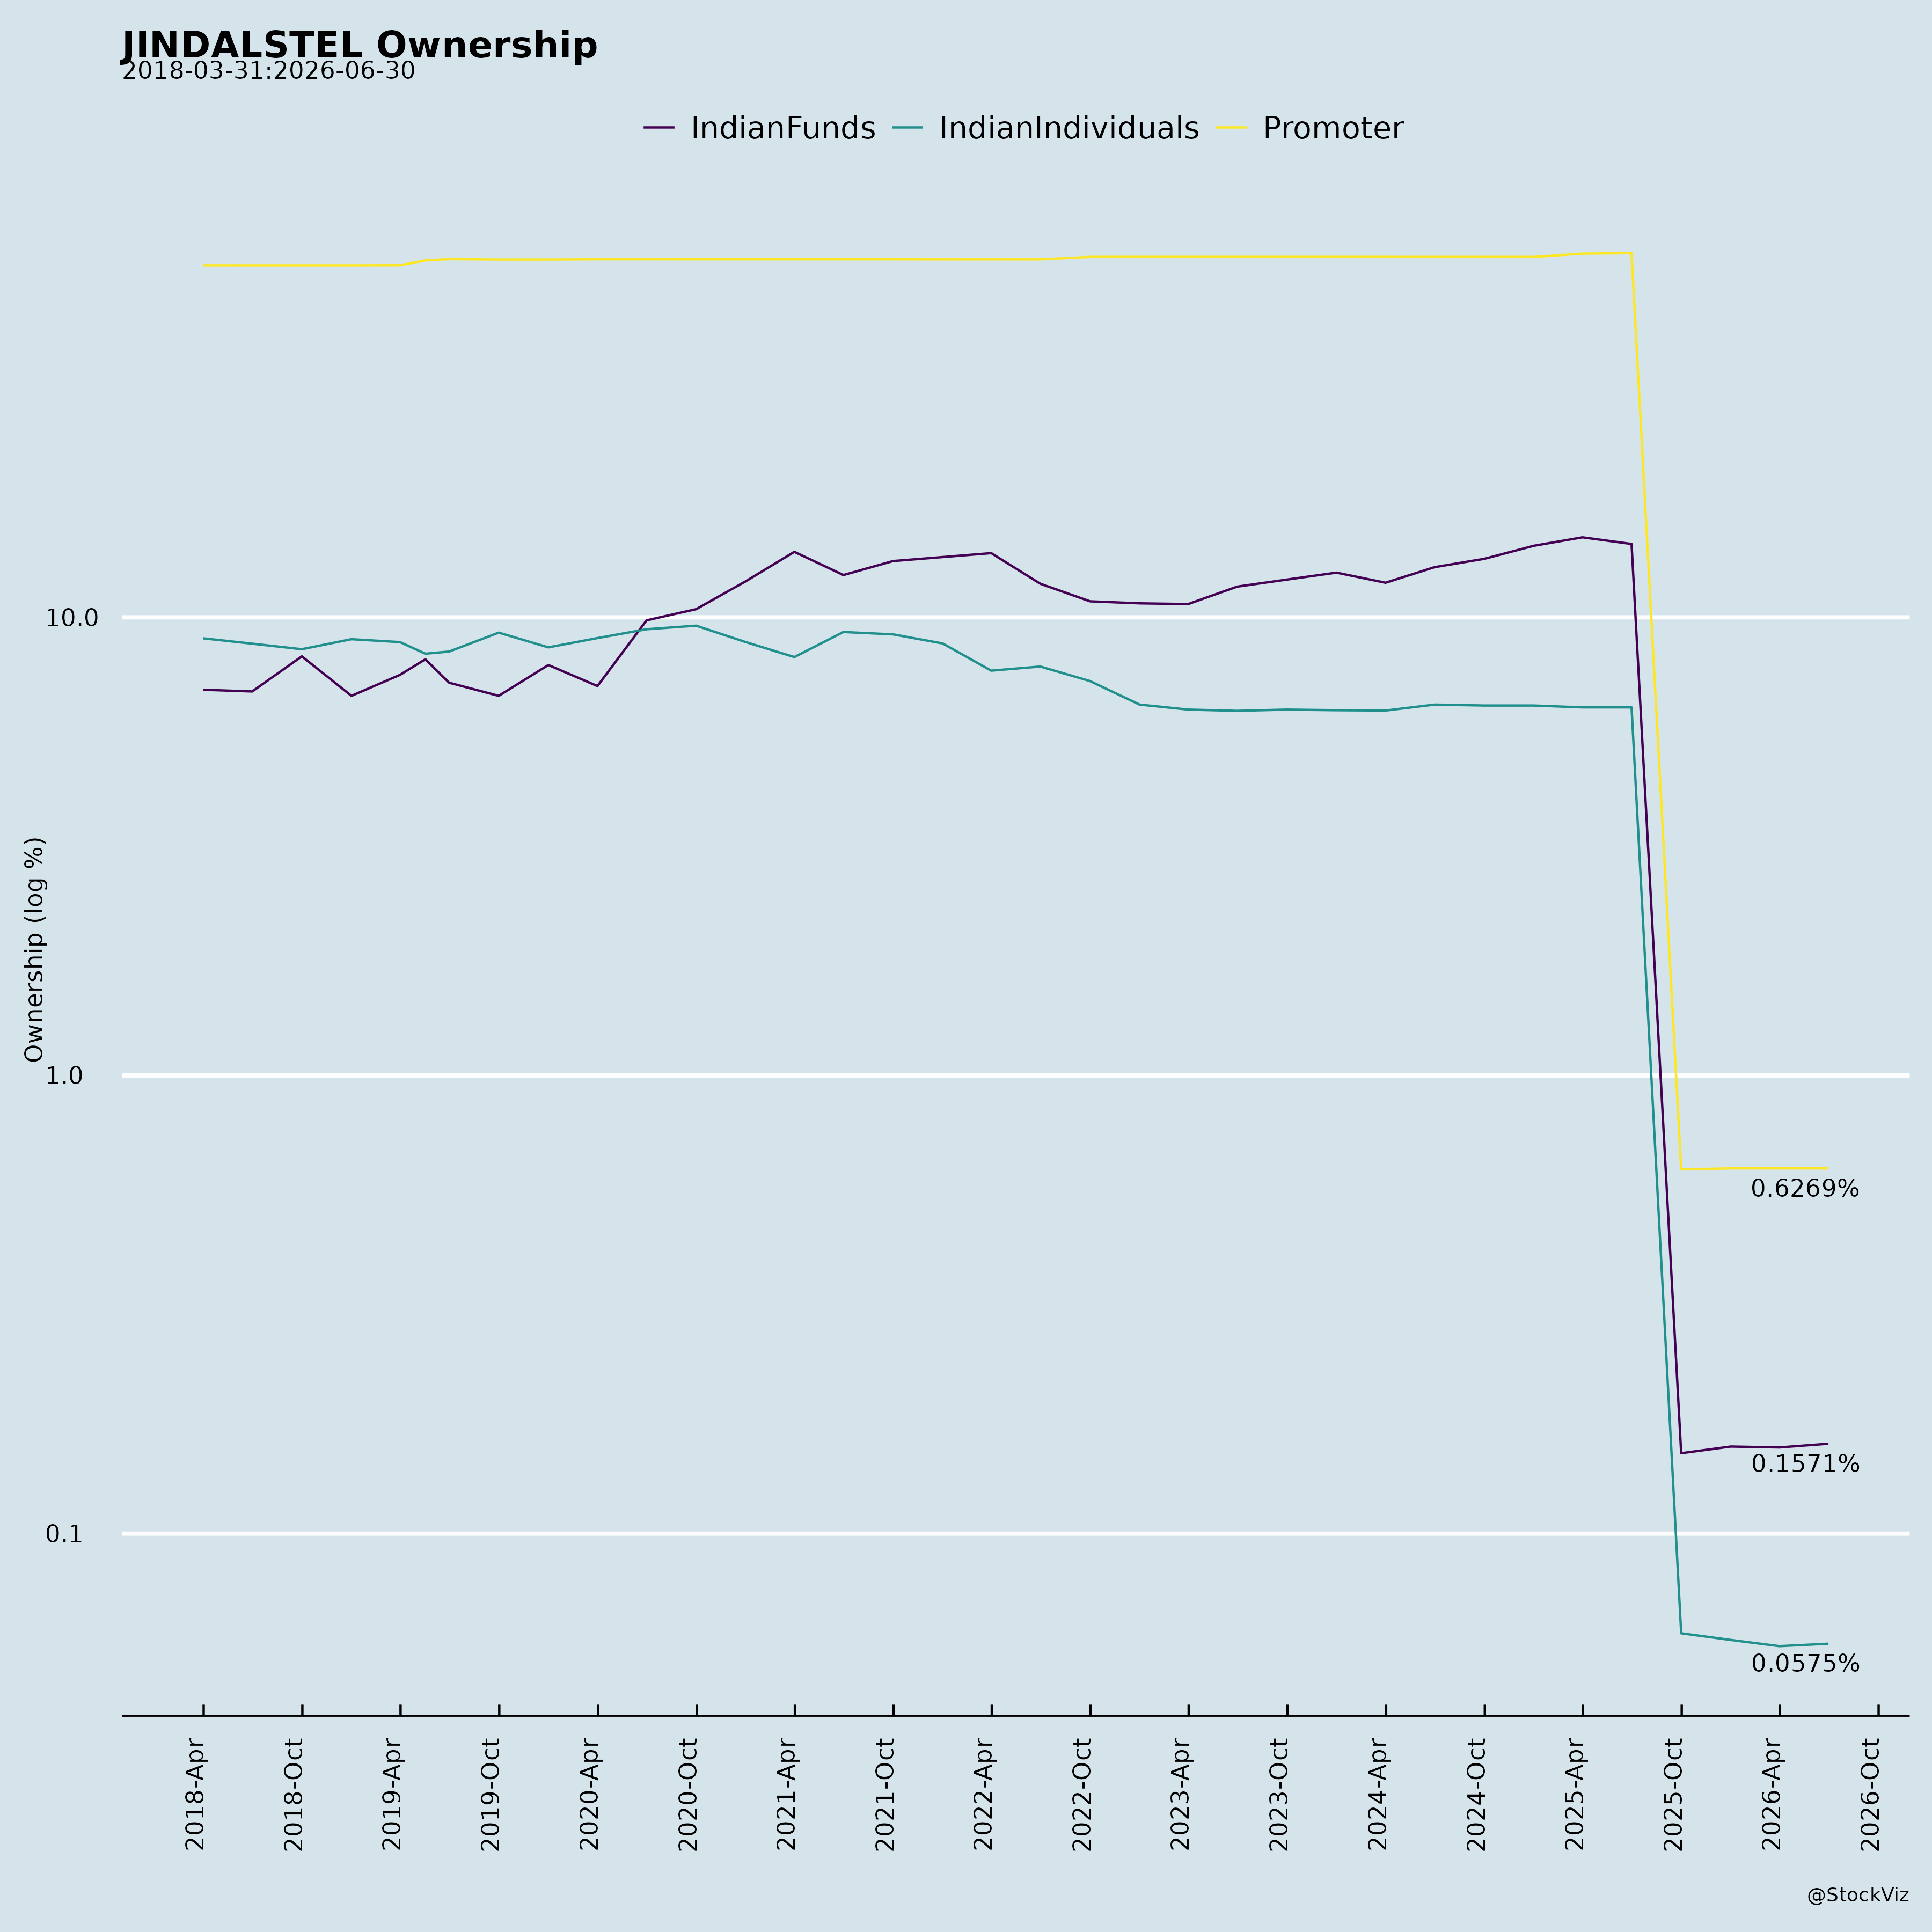
Ownership
Margined
AI Summary
asof: 2026-09-14
Jindal Steel Limited — Recent Corporate Announcements Analysis
1. Headwinds and Challenges
Weak demand environment in China. The Q1FY27 earnings presentation notes that China’s supply discipline is strengthening but its demand continues to weaken, with the property sector continuing to weigh on steel demand. India is positioned as the strongest growth market in the CY26 outlook, implying continued external demand weakness.
India turned net importer of finished steel. In Q1FY27, crude steel production declined 6% QoQ to 42.0 MT (though 3% higher YoY), finished steel consumption fell 7% QoQ to 41.5 MT (8% higher YoY), and finished steel exports contracted 12% QoQ to 1.6 MT (up 31% YoY). Finished steel imports rose 10% QoQ and 49% YoY to 2.1 MT. India remained a net importer for the second consecutive quarter, with net imports of 0.5 MT.
Input cost pressure. Raw material costs increased QoQ on account of higher coking coal cost. PHCC prices rose due to seasonal supply tightness in Australia and strong Chinese demand. Domestic iron ore prices remained elevated during the quarter before moderating towards the end. TMT weakened towards quarter-end due to seasonal weakness, shifting to a discount to HRC.
Sequential volume decline. Production volume was down sequentially due to a planned maintenance shutdown, and sales volume declined QoQ commensurate with production. Other operating costs increased QoQ due to lower fixed cost absorption from lower volumes.
Margin and profitability compression. Consolidated Adjusted EBITDA fell to ₹2,667 cr in Q1FY27 from ₹2,984 cr in Q1FY26, and Adjusted EBITDA per tonne fell to ₹11,937 from ₹15,680 a year earlier. Consolidated PAT declined to ₹844 cr from ₹1,496 cr in Q1FY26, partly on lower other income QoQ. Finance and depreciation costs increased in line with assets capitalised towards the end of the previous quarter, and the effective tax rate rose due to changes in the profit mix across entities with different tax rates.
Elevated leverage. Consolidated Net Debt stood at ₹15,927 cr with Net Debt/EBITDA (TTM) at 1.71x, up from 1.66x in Q4FY26 and 1.49x in Q1FY26.
Material risk themes identified in the BRSR. The company identifies as risks: economic value creation (commodity price volatility, demand fluctuations, high fixed costs, logistics constraints, limited innovation); supply chain management (dependence on limited input sources, ESG risks in the supplier base, logistics bottlenecks); biodiversity (expansion near ecologically sensitive areas); climate change and GHG emissions (carbon-intensive operations, evolving climate regulations, carbon pricing, limited scalability of decarbonisation technologies); air emissions; waste and circular economy; water management; local communities; human rights; and occupational health and safety.
Safety incidents. In FY2025-26, total recordable work-related injuries were 4 for employees and 16 for workers; fatalities were 1 for employees and 5 for workers. LTIFR for workers rose to 0.39 from 0.07 in FY2024-25, while for employees it fell to 0.04 from 0.15.
Attrition. Turnover of permanent employees rose to 16.09% in FY2025-26 from 12.90% in FY2024-25; permanent worker turnover rose to 5.67% from 4.17%.
Community grievances. 872 community requests were filed during FY2025-26, of which 58 were pending resolution at year-end. 568 customer complaints were filed, with 65 pending and marked “open for commercial settlement.”
Value chain assessment gaps. The company states it has not yet commenced assessment and data collection for health and safety practices and working conditions of value chain partners, with disclosure processes under development. Assessment of value chain partners for human rights parameters is also being initiated, with reporting targeted for subsequent years.
2. Tailwinds and Growth Prospects
Capacity and asset base. The company describes scaling up world-class integrated steel production capacity and has established India’s largest technologically advanced Hot Strip Mill with an annual production capacity of six million tonnes. The Q1FY27 presentation references expansion projects, with certain items marked as commissioned.
Value-added product mix. Share of value-added steel increased from 61% in Q4FY26 to 66% in Q1FY27. The company cites a most diversified product portfolio and industry-leading EBITDA per tonne.
Credit rating upgrade. CARE ratings upgraded the long-term credit rating from AA/stable to AA+/stable.
Mine ramp-up. Coal dispatch started from the Utkal B1 mine. The presentation notes the Thakurani-A1 iron ore block awarded to Jindal Steel in March 2026, with resources of approximately 50 mn tonnes (excluded from the stated asset base).
Strong liquidity and balance sheet. The company cites strong liquidity of INR 6,080 cr and a best-in-class balance sheet.
Decarbonisation and clean technology. The company operates the world’s first and largest coal gasification plant for steel-making, is adding renewable power in its journey to Net Zero, and has a 192 km eco-friendly slurry pipeline and 10 km coal pipe conveyor. It has committed to net zero carbon emissions by 2047, with an aspiration to reach this milestone by 2035. European operations are powered by 100% certified renewable electricity from hydroelectric sources, preventing over 5,000 tonnes of CO₂ emissions annually. Syngas deployment has expanded from the coal gasification-based DRI route to galvanising, colour coating and blast furnace applications, improving fuel flexibility and reducing dependence on imported natural gas, LPG and coking coal.
Specific emissions-reduction initiatives. Raigarh avoided ~40 tCO₂e in Q1FY27 through LNG-powered vehicles; an electric billet-transport pilot between Angul and Patratu avoided approximately 240 litres of diesel and up to 600 kg CO₂ per trip. The company is collaborating with IIT Bombay and the Ministry of Steel on an electrochemical CO₂-to-CO conversion process, and advancing circular carbon utilisation. It has commissioned 15 MW of rooftop solar capacity and expanded renewable energy procurement, installed a 205 TPH BF gas-fired boiler, and implemented waste heat recovery systems.
Digital and AI transformation. Enterprise AI transformation is being rolled out company-wide, unified by JARVIS (Jindal AI for Real time Visibility, Intelligence & Systems). AI agents are going live across people, processes and plants. Initiatives include integrated terminal operating systems for ports, digital twin expansion to SMS, AI-based prediction models for blast furnaces, CRM plant automation and SAP implementation, a customer self-service portal, and a unified procurement system.
Market reach. The company serves 28 states nationally and 35 countries internationally, with exports at 4.86% of total turnover. It serves defence and shipbuilding, railways, construction and infrastructure, energy (wind, hydro, thermal), oil and gas, general engineering, and OEMs, and maintains a retail presence through the JINDAL PANTHER range of rebars.
Social impact. The company reports positively impacting 14.6 million+ lives, with CSR programmes spanning health, education, skill development, water, sanitation, women’s empowerment and sustainable livelihoods. In Q1FY27 it reports 6,62,464 community members benefited, 3,23,604 provided with clean water, and 6,297 students provided with quality education, among other metrics.
Governance and recognition. The company maintains an Anti-Corruption and Anti-Bribery Policy with mandatory e-learning certification, a Code of Conduct with annual conflict-of-interest declarations, and a Board-level committee chaired by an Independent Director overseeing Health & Safety, CSR, Sustainability and Environment. It reports zero fines or penalties in FY2025-26 and zero disciplinary actions for bribery or corruption.
3. Key Risks
Commodity price and demand volatility. The BRSR identifies exposure to commodity price volatility, demand fluctuations, high fixed costs, logistics constraints and limited innovation as risks that may affect profitability and competitiveness, with negative implications including margin compression, earnings volatility and reduced shareholder value.
Supply chain concentration. Dependence on limited input sources, ESG risks in the supplier base and logistics bottlenecks may disrupt production and increase costs. Purchases from top 10 trading houses were 48.73% of total purchases from trading houses in FY2025-26, and sales to top 10 dealers/distributors were 31.55% of total dealer/distributor sales.
Climate transition and carbon costs. Carbon-intensive operations, evolving climate regulations, carbon pricing and limited scalability of decarbonisation technologies increase transition risks, with potential higher carbon costs, reduced competitiveness and higher financing costs.
Environmental compliance. Air emissions from coal-based processes and tightening environmental regulations may lead to non-compliance and stakeholder concerns. Water scarcity, inefficient usage and inadequate effluent treatment can disrupt operations and increase regulatory scrutiny. Inefficient waste segregation and recycling can result in environmental liabilities.
Community and social licence. Community opposition due to land use, environmental concerns, inadequate consultation or perceived inequity can affect business continuity, with potential project delays, compensation costs and reputational impacts.
Human rights and labour. Labour rights violations, inadequate diversity and inclusion, and weak supplier labour oversight can lead to legal and reputational issues. The company reports 14 human rights complaints filed in FY2025-26 (all resolved satisfactorily) and 14 POSH complaints (6 upheld), up from 10 POSH complaints in FY2024-25.
Occupational health and safety. Hazardous operating environments, inadequate safety culture and non-compliance with OHS standards can result in injuries, fatalities and operational disruptions, with compensation costs, production downtime, legal penalties and increased insurance costs.
Biodiversity. Expansion near ecologically sensitive areas, inadequate biodiversity assessments and poor stakeholder engagement can result in project delays and regulatory challenges. The company states none of its manufacturing facilities are located within notified ecologically sensitive or protected areas.
Leverage and financing. Net Debt/EBITDA (TTM) at 1.71x in Q1FY27, with finance costs rising in line with capitalised assets, represents a financial risk if EBITDA remains under pressure.
4. Management Guidance Versus Observed Business Performance
Net zero commitment. The company has committed to achieving net zero carbon emissions by 2047, with an aspiration to reach this milestone by 2035. Observed performance: Scope 1 and Scope 2 emission intensity per rupee of turnover was 0.067 kgCO₂e/Rs in FY2025-26 versus 0.068 in FY2024-25; emission intensity in terms of physical output was 2.68 metric tonnes CO₂e/TCS versus 2.74 in FY2024-25. Total Scope 1 emissions were 35.63 million tonnes CO₂ equivalent in FY2025-26 versus 32.69 in FY2024-25, and Scope 2 was 0.69 versus 0.66. Scope 3 emissions were reported at 47.25 million tonnes CO₂ equivalent for FY2025-26, with no prior-year comparative. The company reports 100% wastewater recycling and reuse through Zero Liquid Discharge systems.
PAT Scheme targets. The company states it has successfully met energy reduction targets prescribed under completed PAT cycles, receiving 26,460 ESCerts under PAT Cycle-I and 7,798 ESCerts under PAT Cycle-II for the Raigarh facility. It is covered under PAT Cycle-VII, with target status to be disclosed upon final confirmation from the Bureau of Energy Efficiency.
Growth and capacity expansion. The company describes scaling up integrated steel production capacity and references expansion projects, with certain items marked as commissioned. Observed performance: Q1FY27 steel production was 2.40 MT versus 2.65 MT in Q4FY26 and 2.09 MT in Q1FY26; steel sales were 2.23 MT versus 2.62 MT in Q4FY26 and 1.90 MT in Q1FY26. The sequential decline was attributed to a planned maintenance shutdown.
Value-added mix. Share of value-added steel increased from 61% in Q4FY26 to 66% in Q1FY27, which the company cites as supporting higher ASP.
Financial performance versus prior periods. Q1FY27 gross revenue was ₹17,834 cr versus ₹19,399 cr in Q4FY26 and ₹14,336 cr in Q1FY26. Adjusted EBITDA was ₹2,667 cr versus ₹2,647 cr in Q4FY26 and ₹2,984 cr in Q1FY26. Adjusted EBITDA per tonne was ₹11,937 versus ₹10,093 in Q4FY26 and ₹15,680 in Q1FY26. PAT was ₹844 cr versus ₹1,041 cr in Q4FY26 and ₹1,496 cr in Q1FY26. Standalone Adjusted EBITDA was ₹2,227 cr in Q1FY27 versus ₹1,705 cr in Q4FY26 and ₹2,859 cr in Q1FY26; standalone PAT was ₹1,086 cr versus a loss of ₹143 cr in Q4FY26 and ₹1,624 cr in Q1FY26.
Liquidity and leverage. The company cites strong liquidity of INR 6,080 cr and Net Debt/EBITDA at 1.71x. Observed: Net Debt was ₹15,927 cr in Q1FY27 versus ₹16,019 cr in Q4FY26 and ₹14,400 cr in Q1FY26; Net Debt/EBITDA (TTM) was 1.71x versus 1.66x in Q4FY26 and 1.49x in Q1FY26.
Capital investment. The company describes prudent capital investment primarily funded through internal accruals. Observed: finance costs increased in line with assets capitalised towards the end of the previous quarter, and consolidated finance cost (net) was ₹548 cr in Q1FY27 versus ₹442 cr in Q4FY26 and ₹297 cr in Q1FY26.
ESG performance reporting. The BRSR states that for detailed information on annual performance against specific commitments, goals and targets, along with reasons where the same are not met, reference should be made to the integrated report. The report notes that all policies are evaluated internally at regular intervals, with no independent external assessment of policy working.
Broker Narrative
The narrative evolved from a technical Sell call in 2021—warning of RSI divergence and double-top patterns after a massive rally—to a fundamentally-driven Buy call in 2026 focused on structural improvements like VASP mix and captive ore. Early technical fears of a market top were completely invalidated as the stock rallied another 288%, while the latest optimism relies on forward-looking operational catalysts like the slurry pipeline and post-monsoon demand recovery despite severe near-term cost headwinds.
Broker Timeline
47 broker calls · 2021-02-15 to 2026-07-27
Copyright © 2023 SAS Data Analytics Pvt. Ltd. All rights reserved.