GAIL
Equity Metrics
January 13, 2026
GAIL (India) Limited
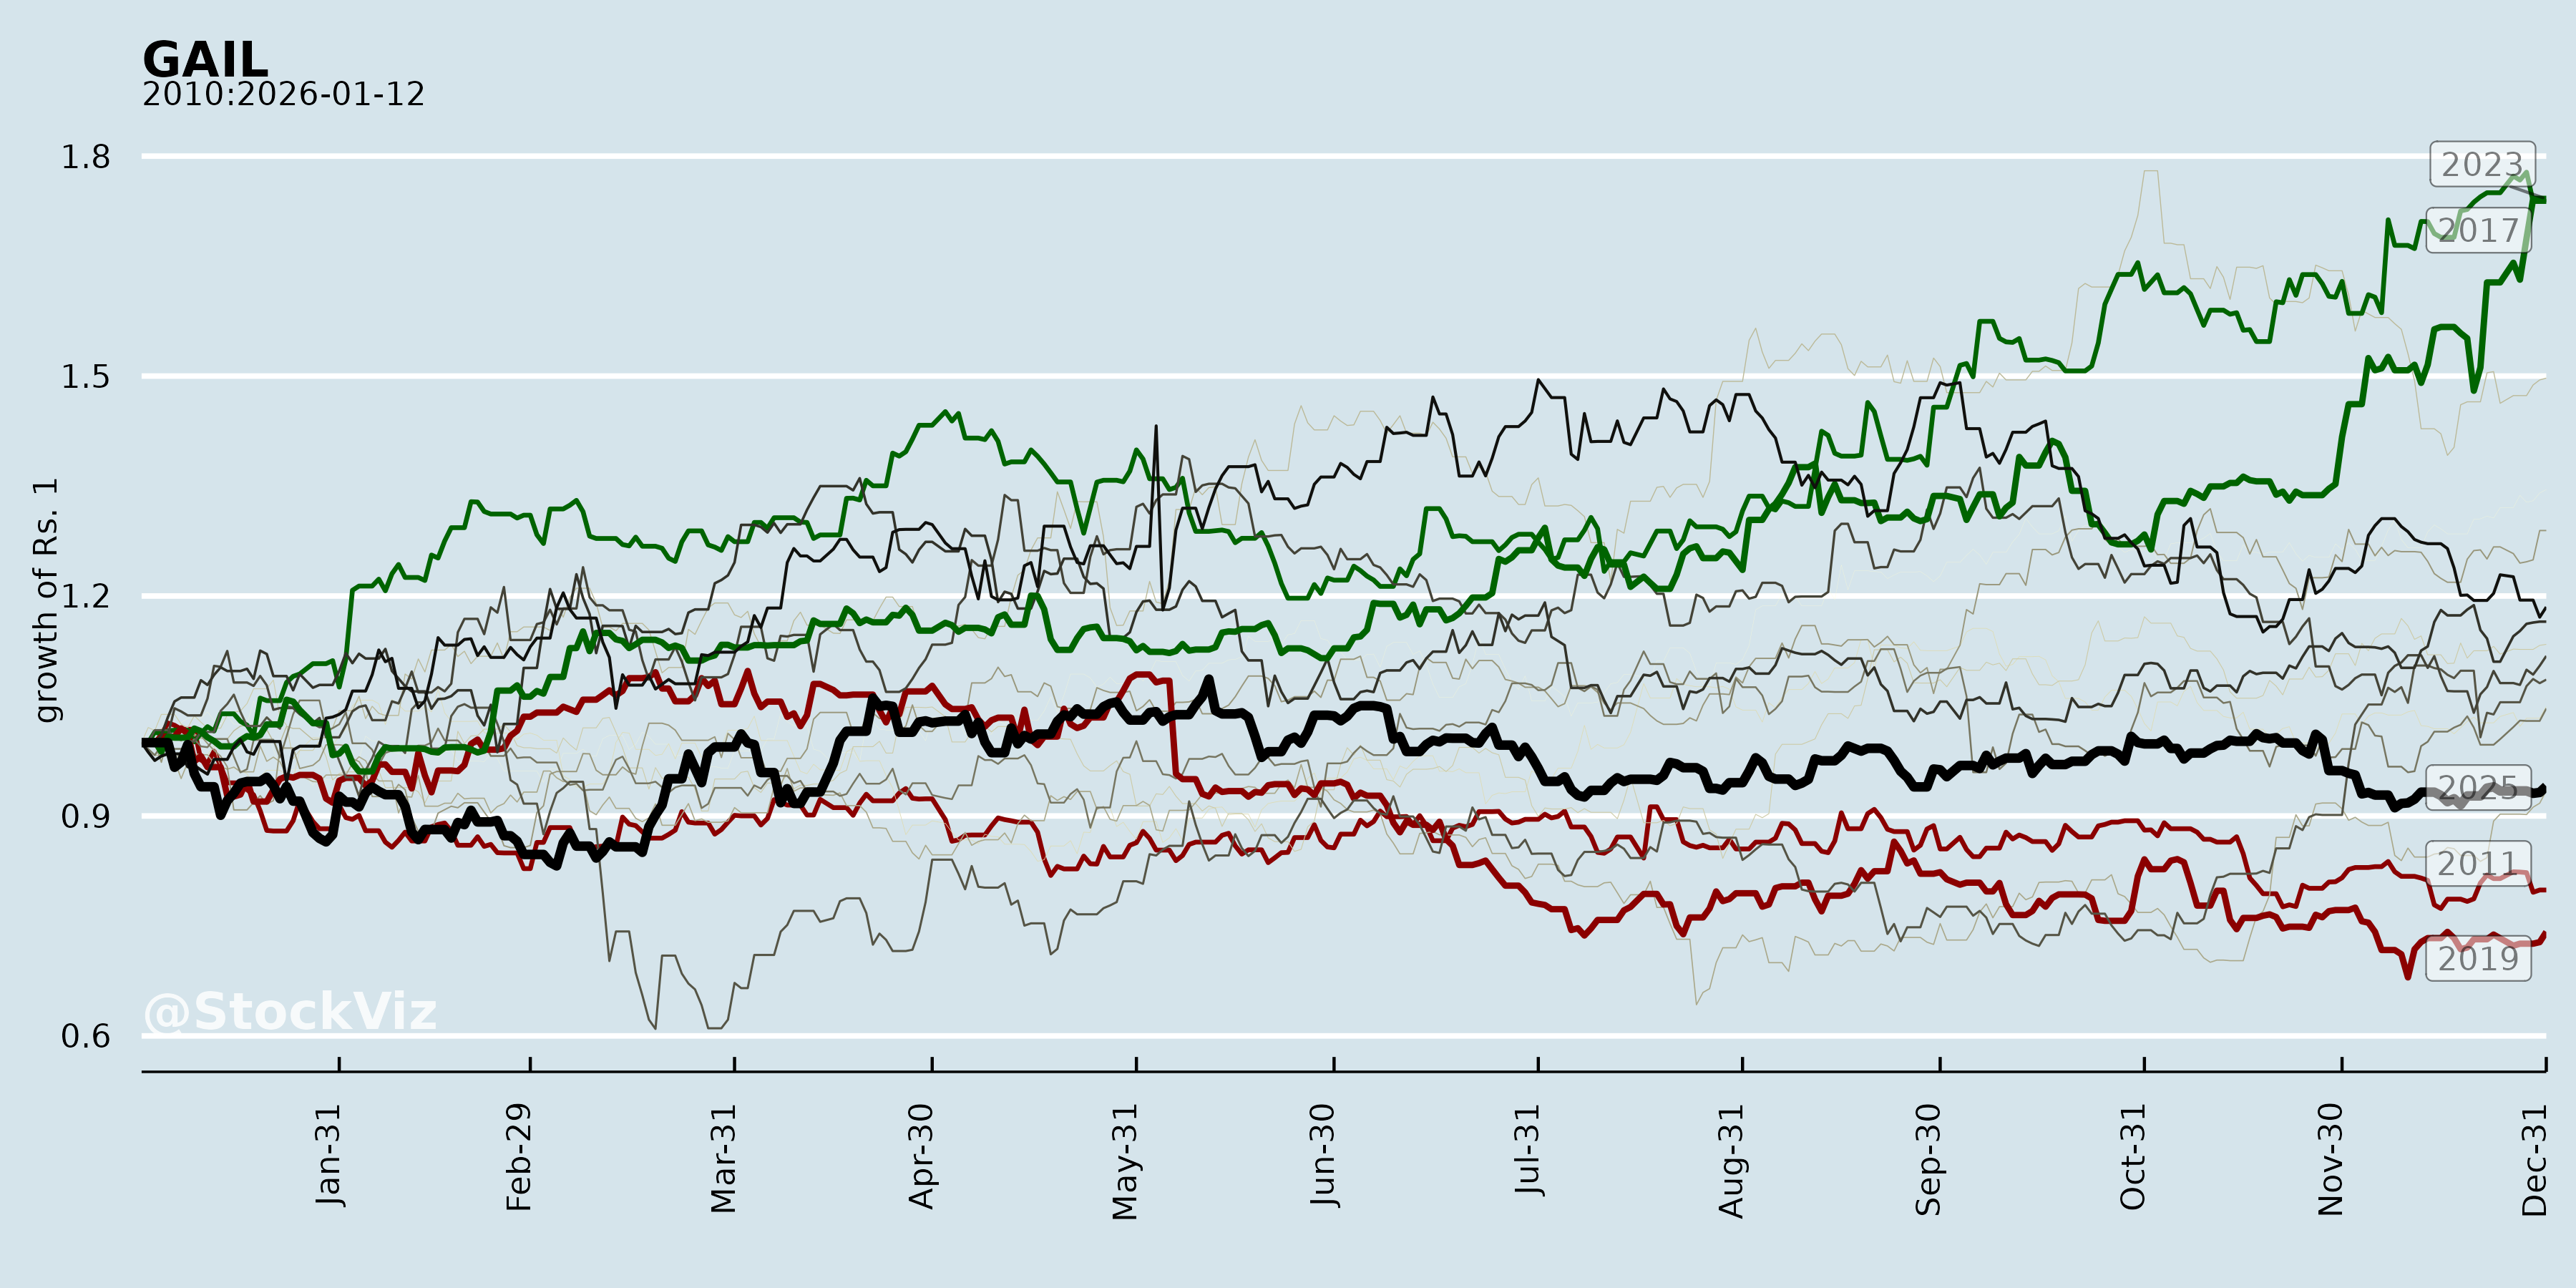
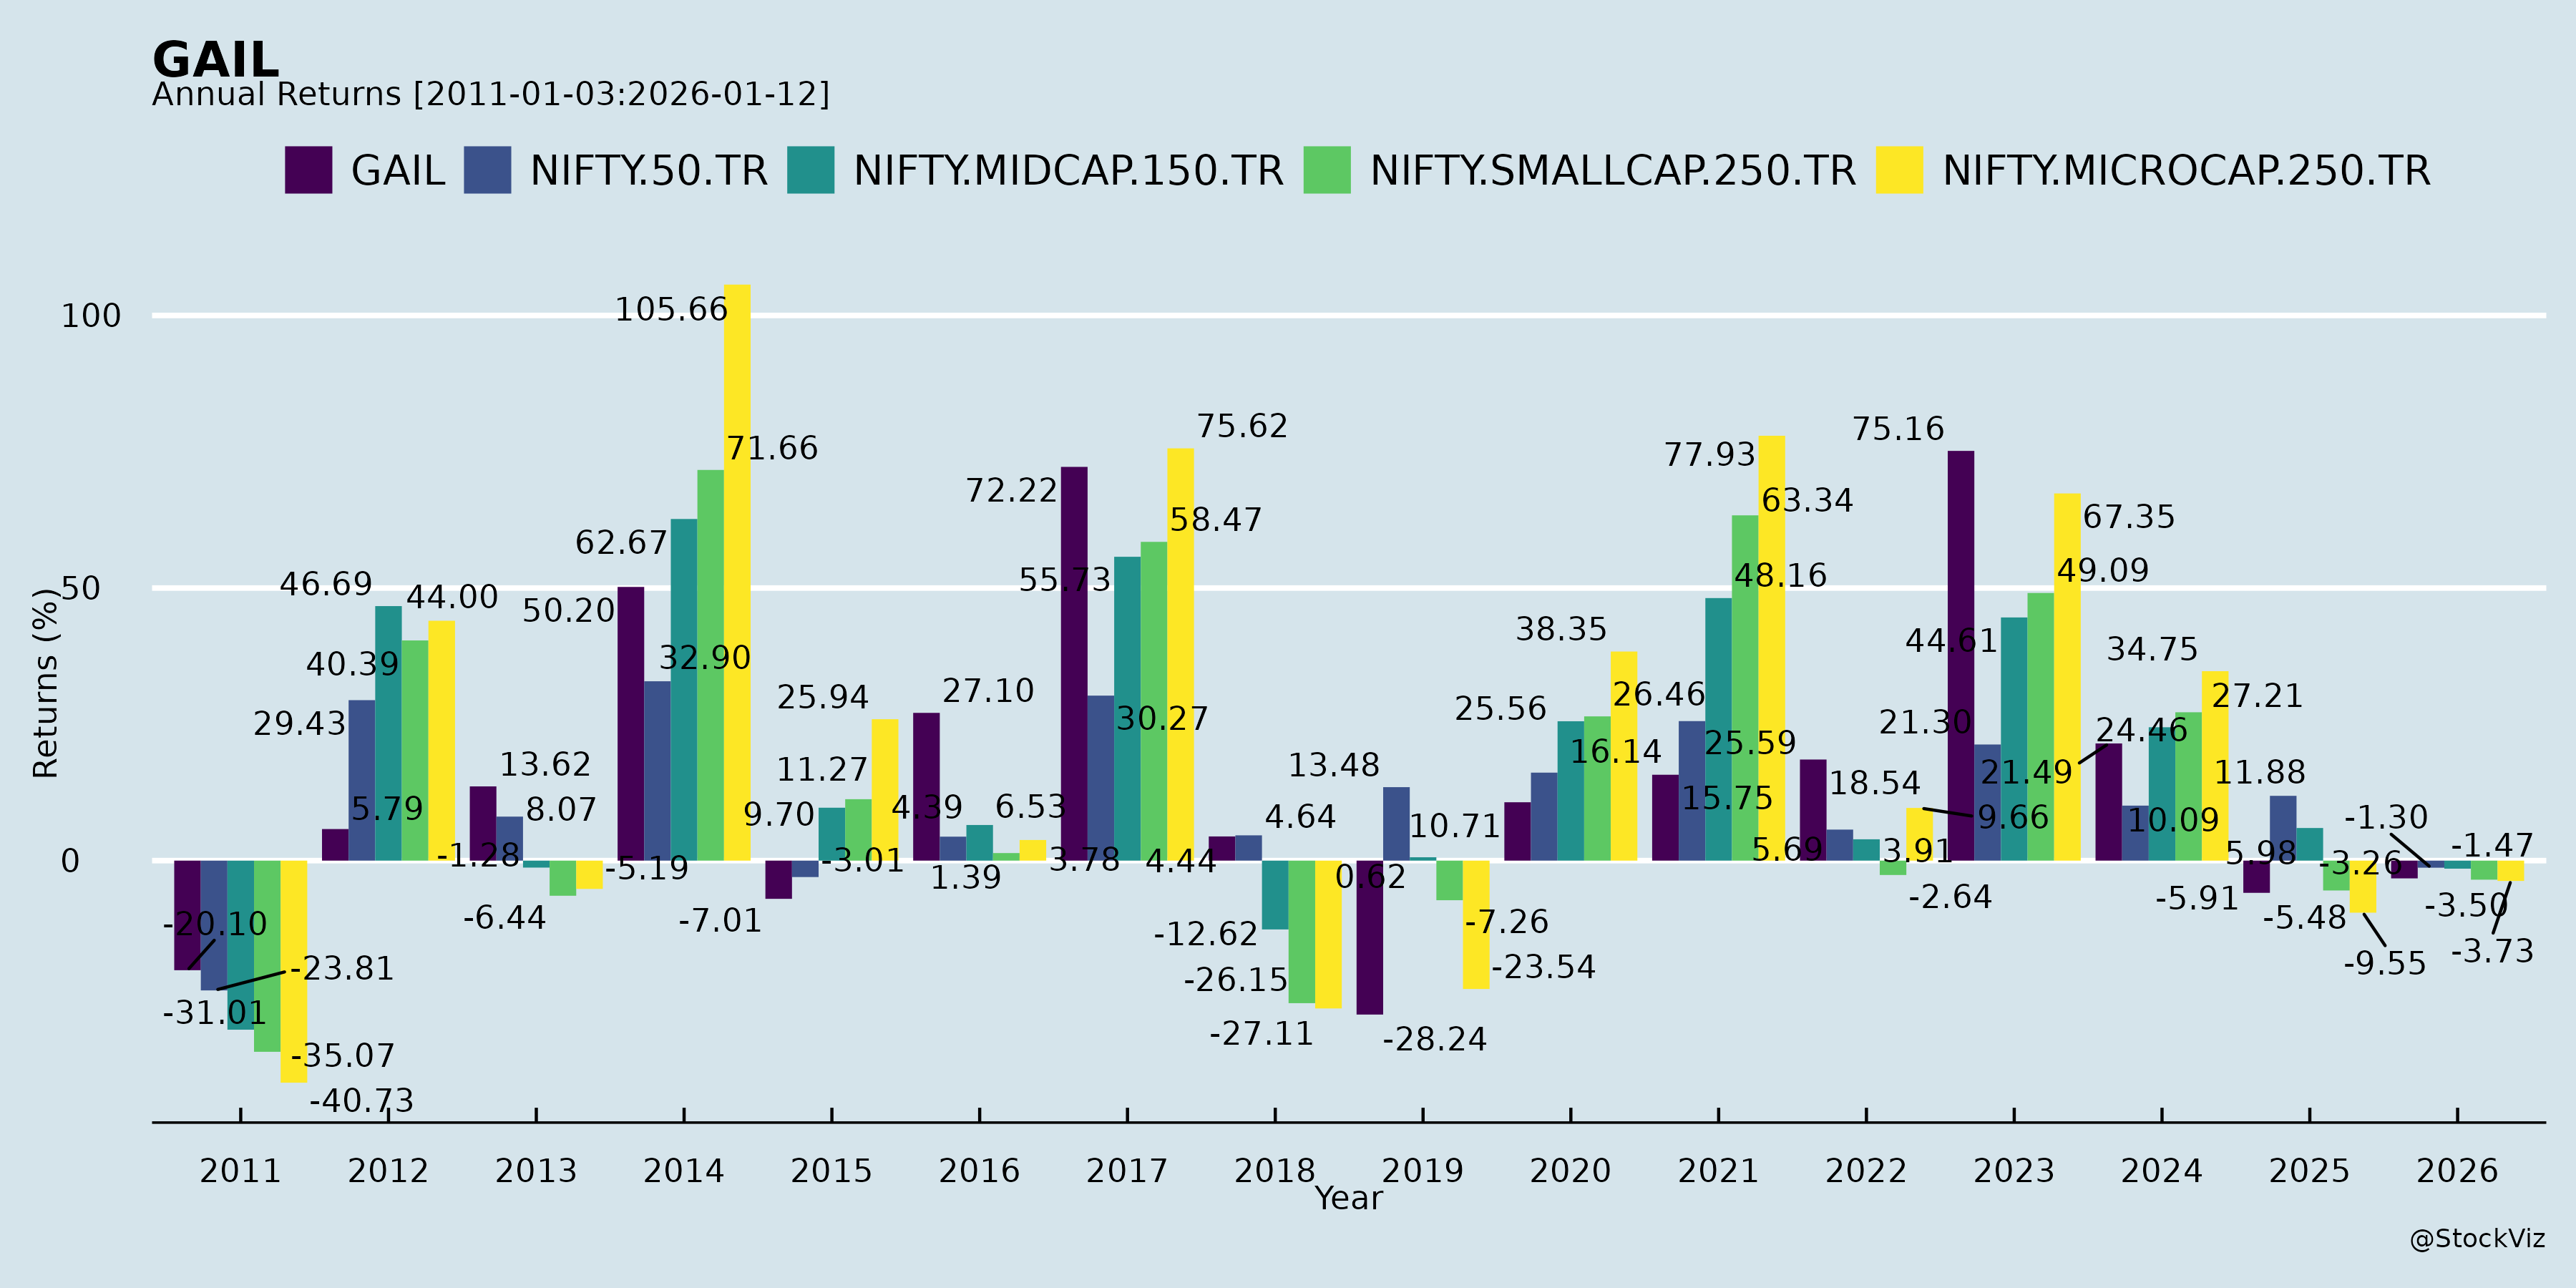
Annual Returns
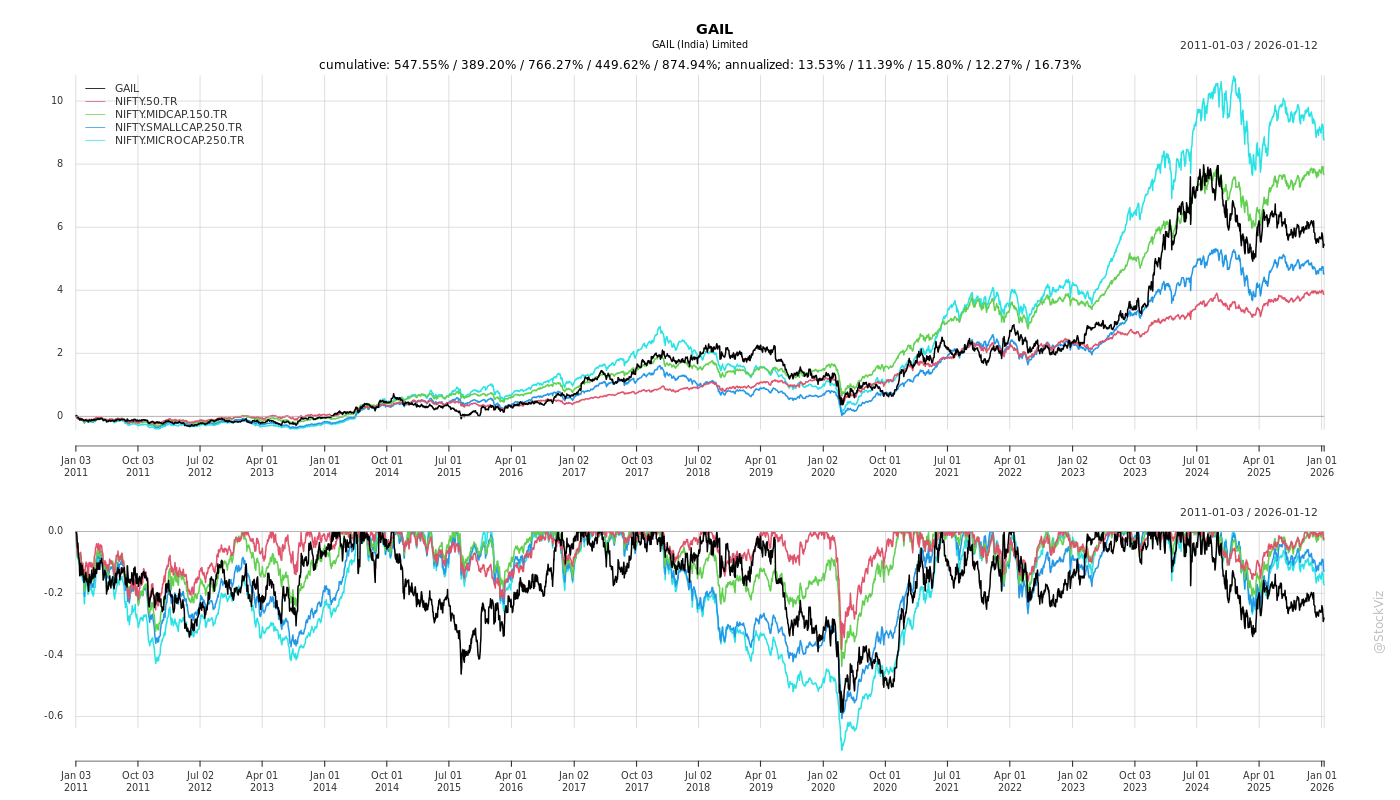
Cumulative Returns and Drawdowns
Fundamentals
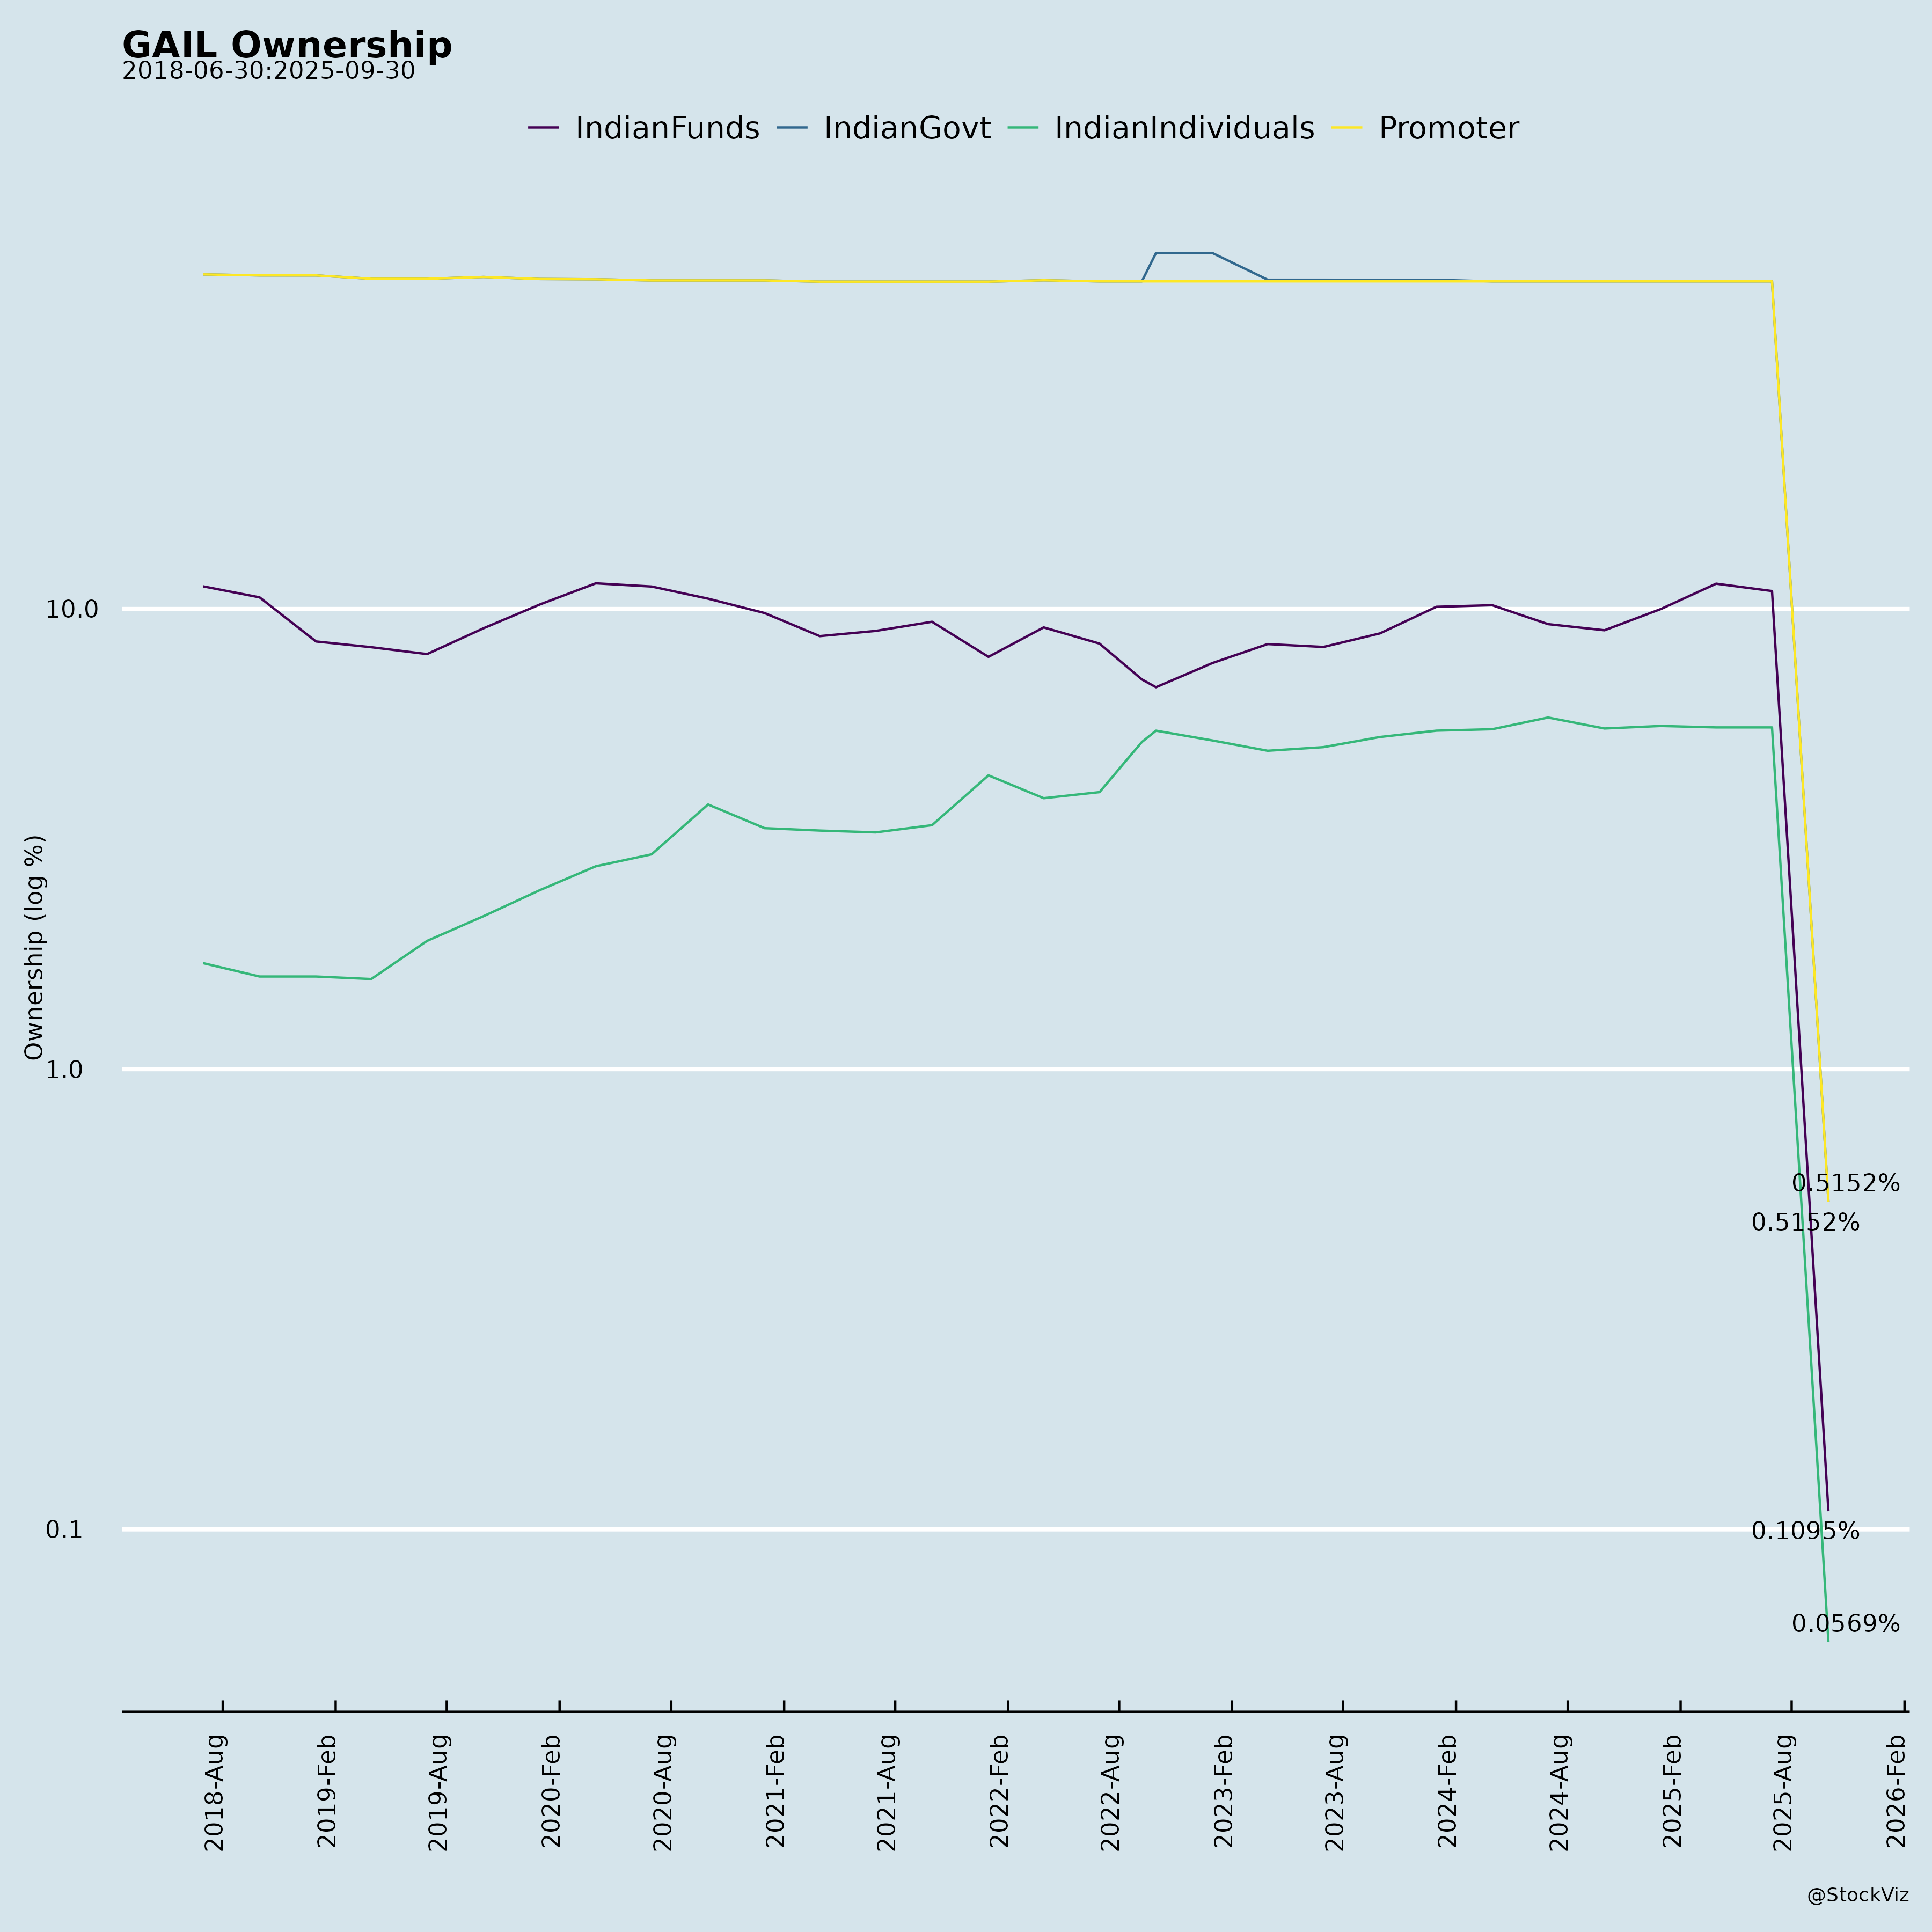
Ownership
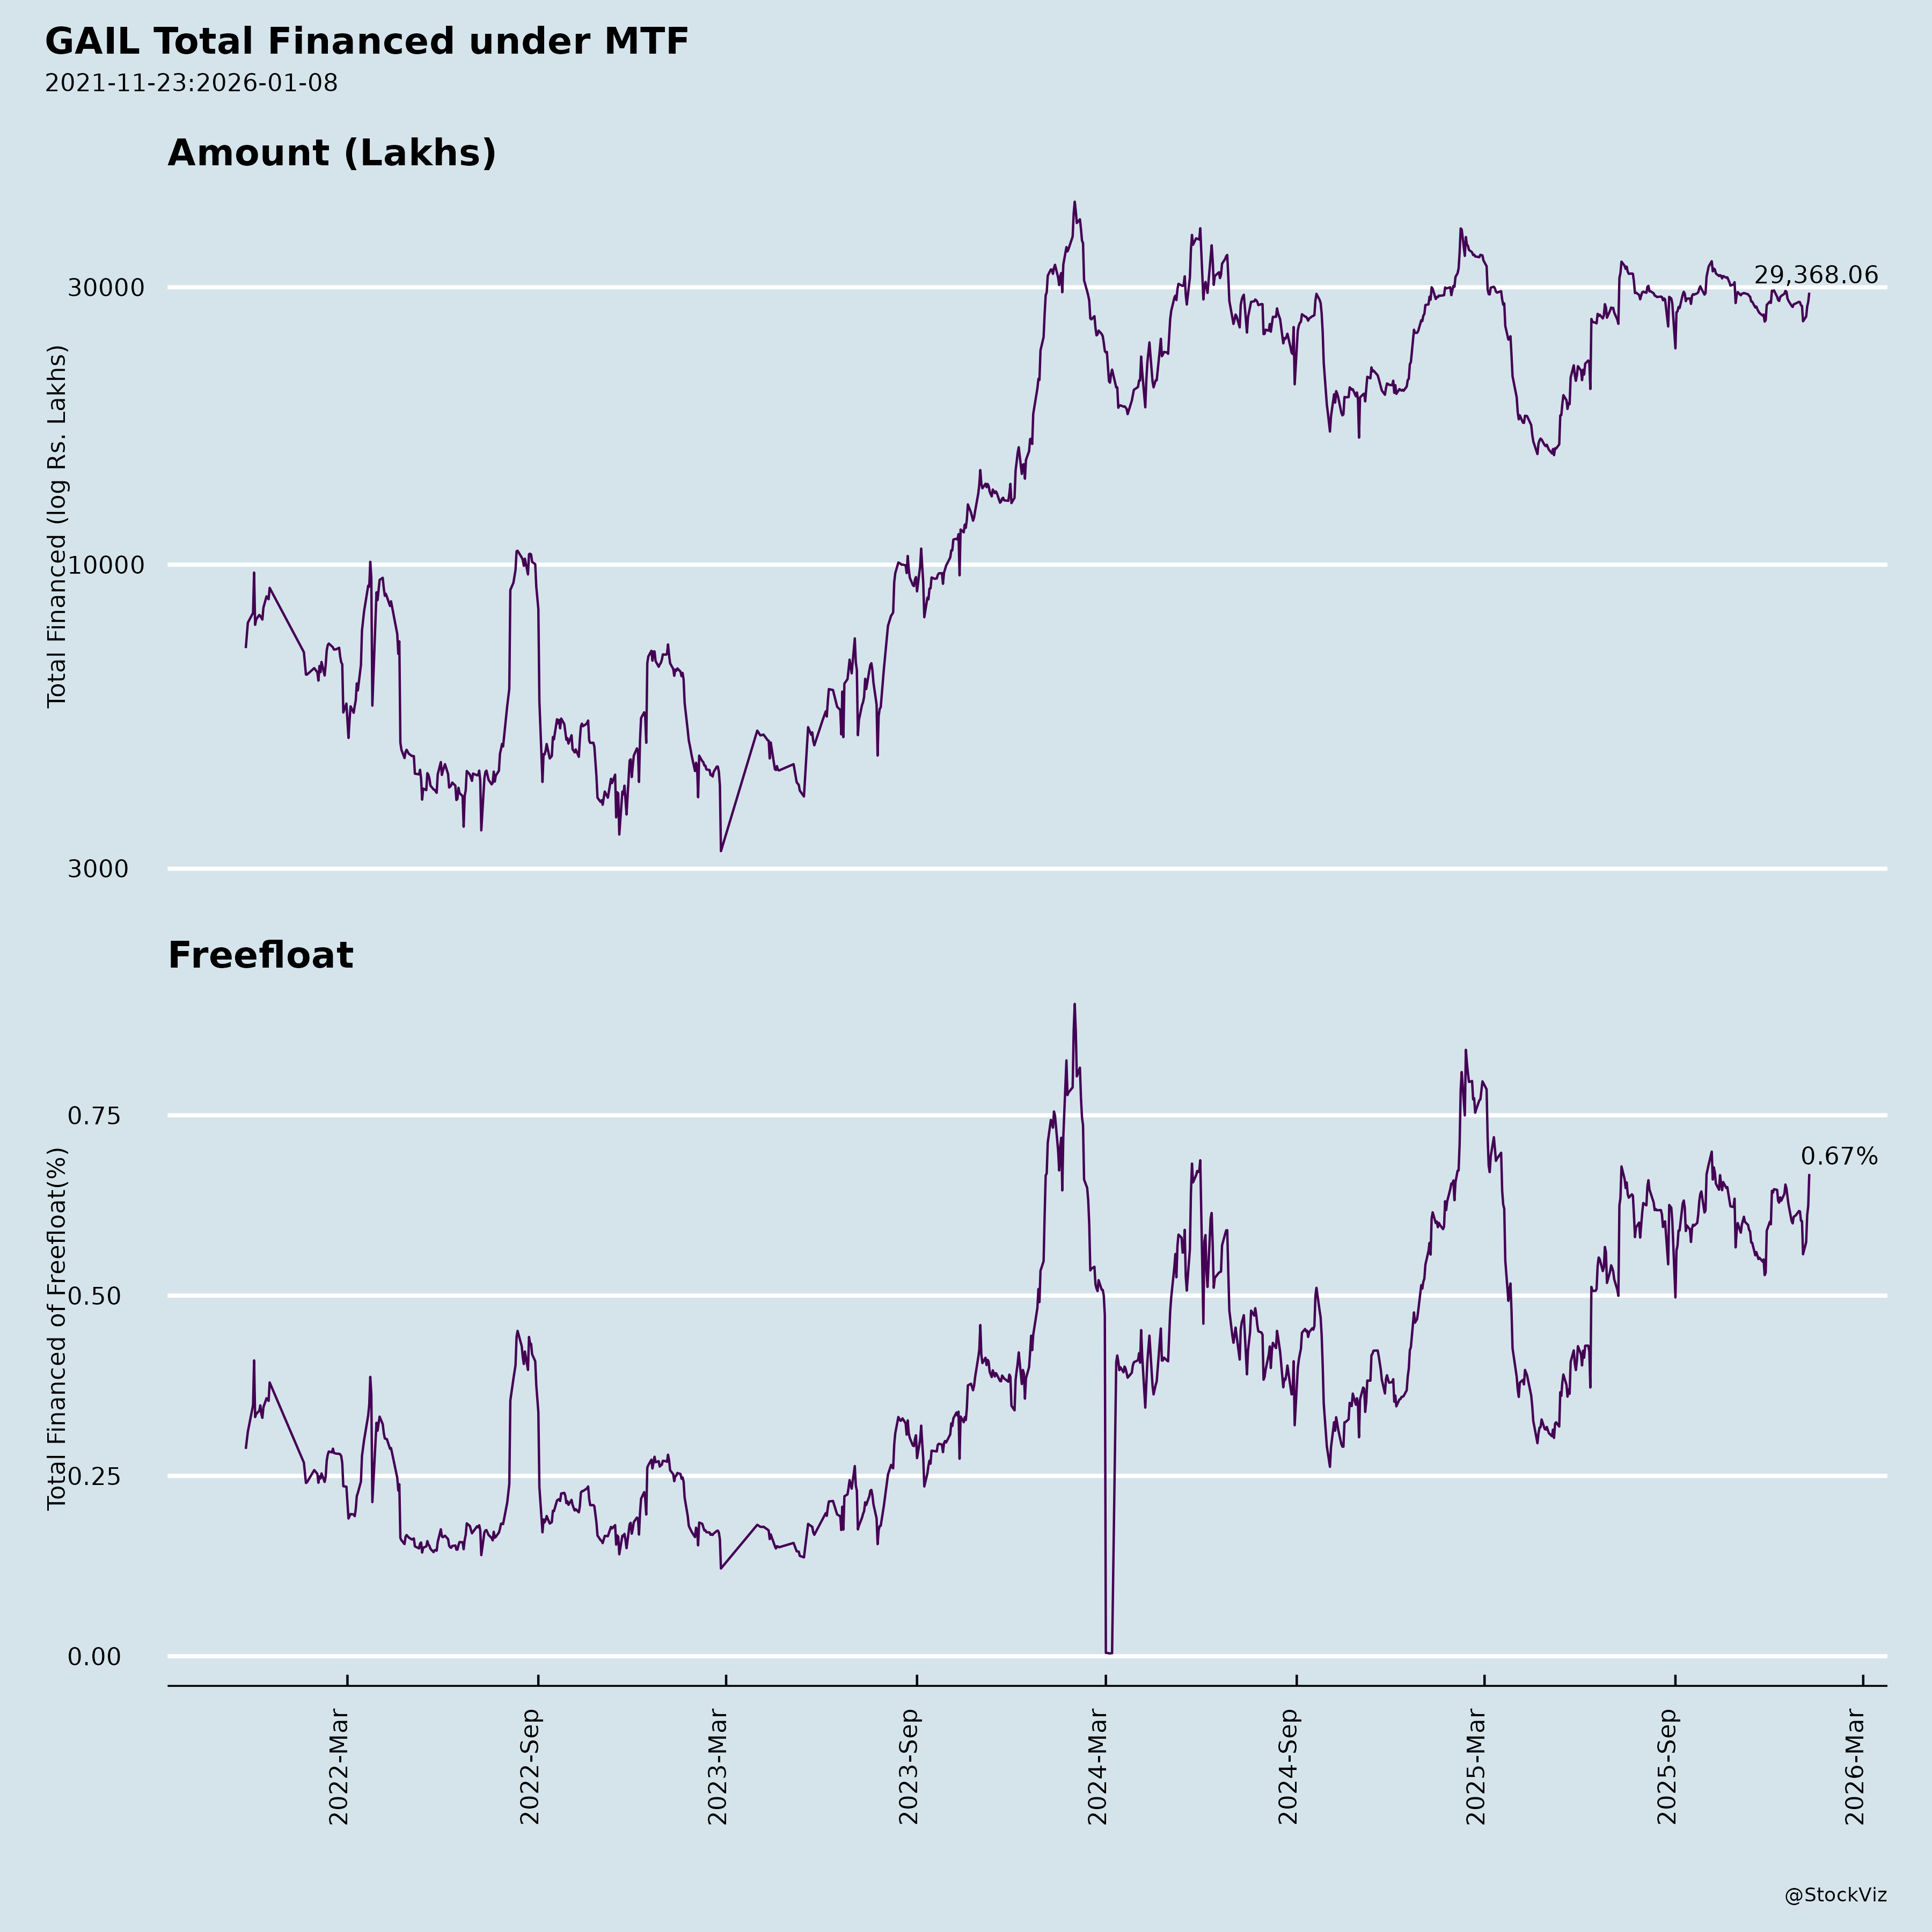
Margined
AI Summary
asof: 2025-12-03
GAIL (India) Limited: Analysis of Headwinds, Tailwinds, Growth Prospects, and Key Risks
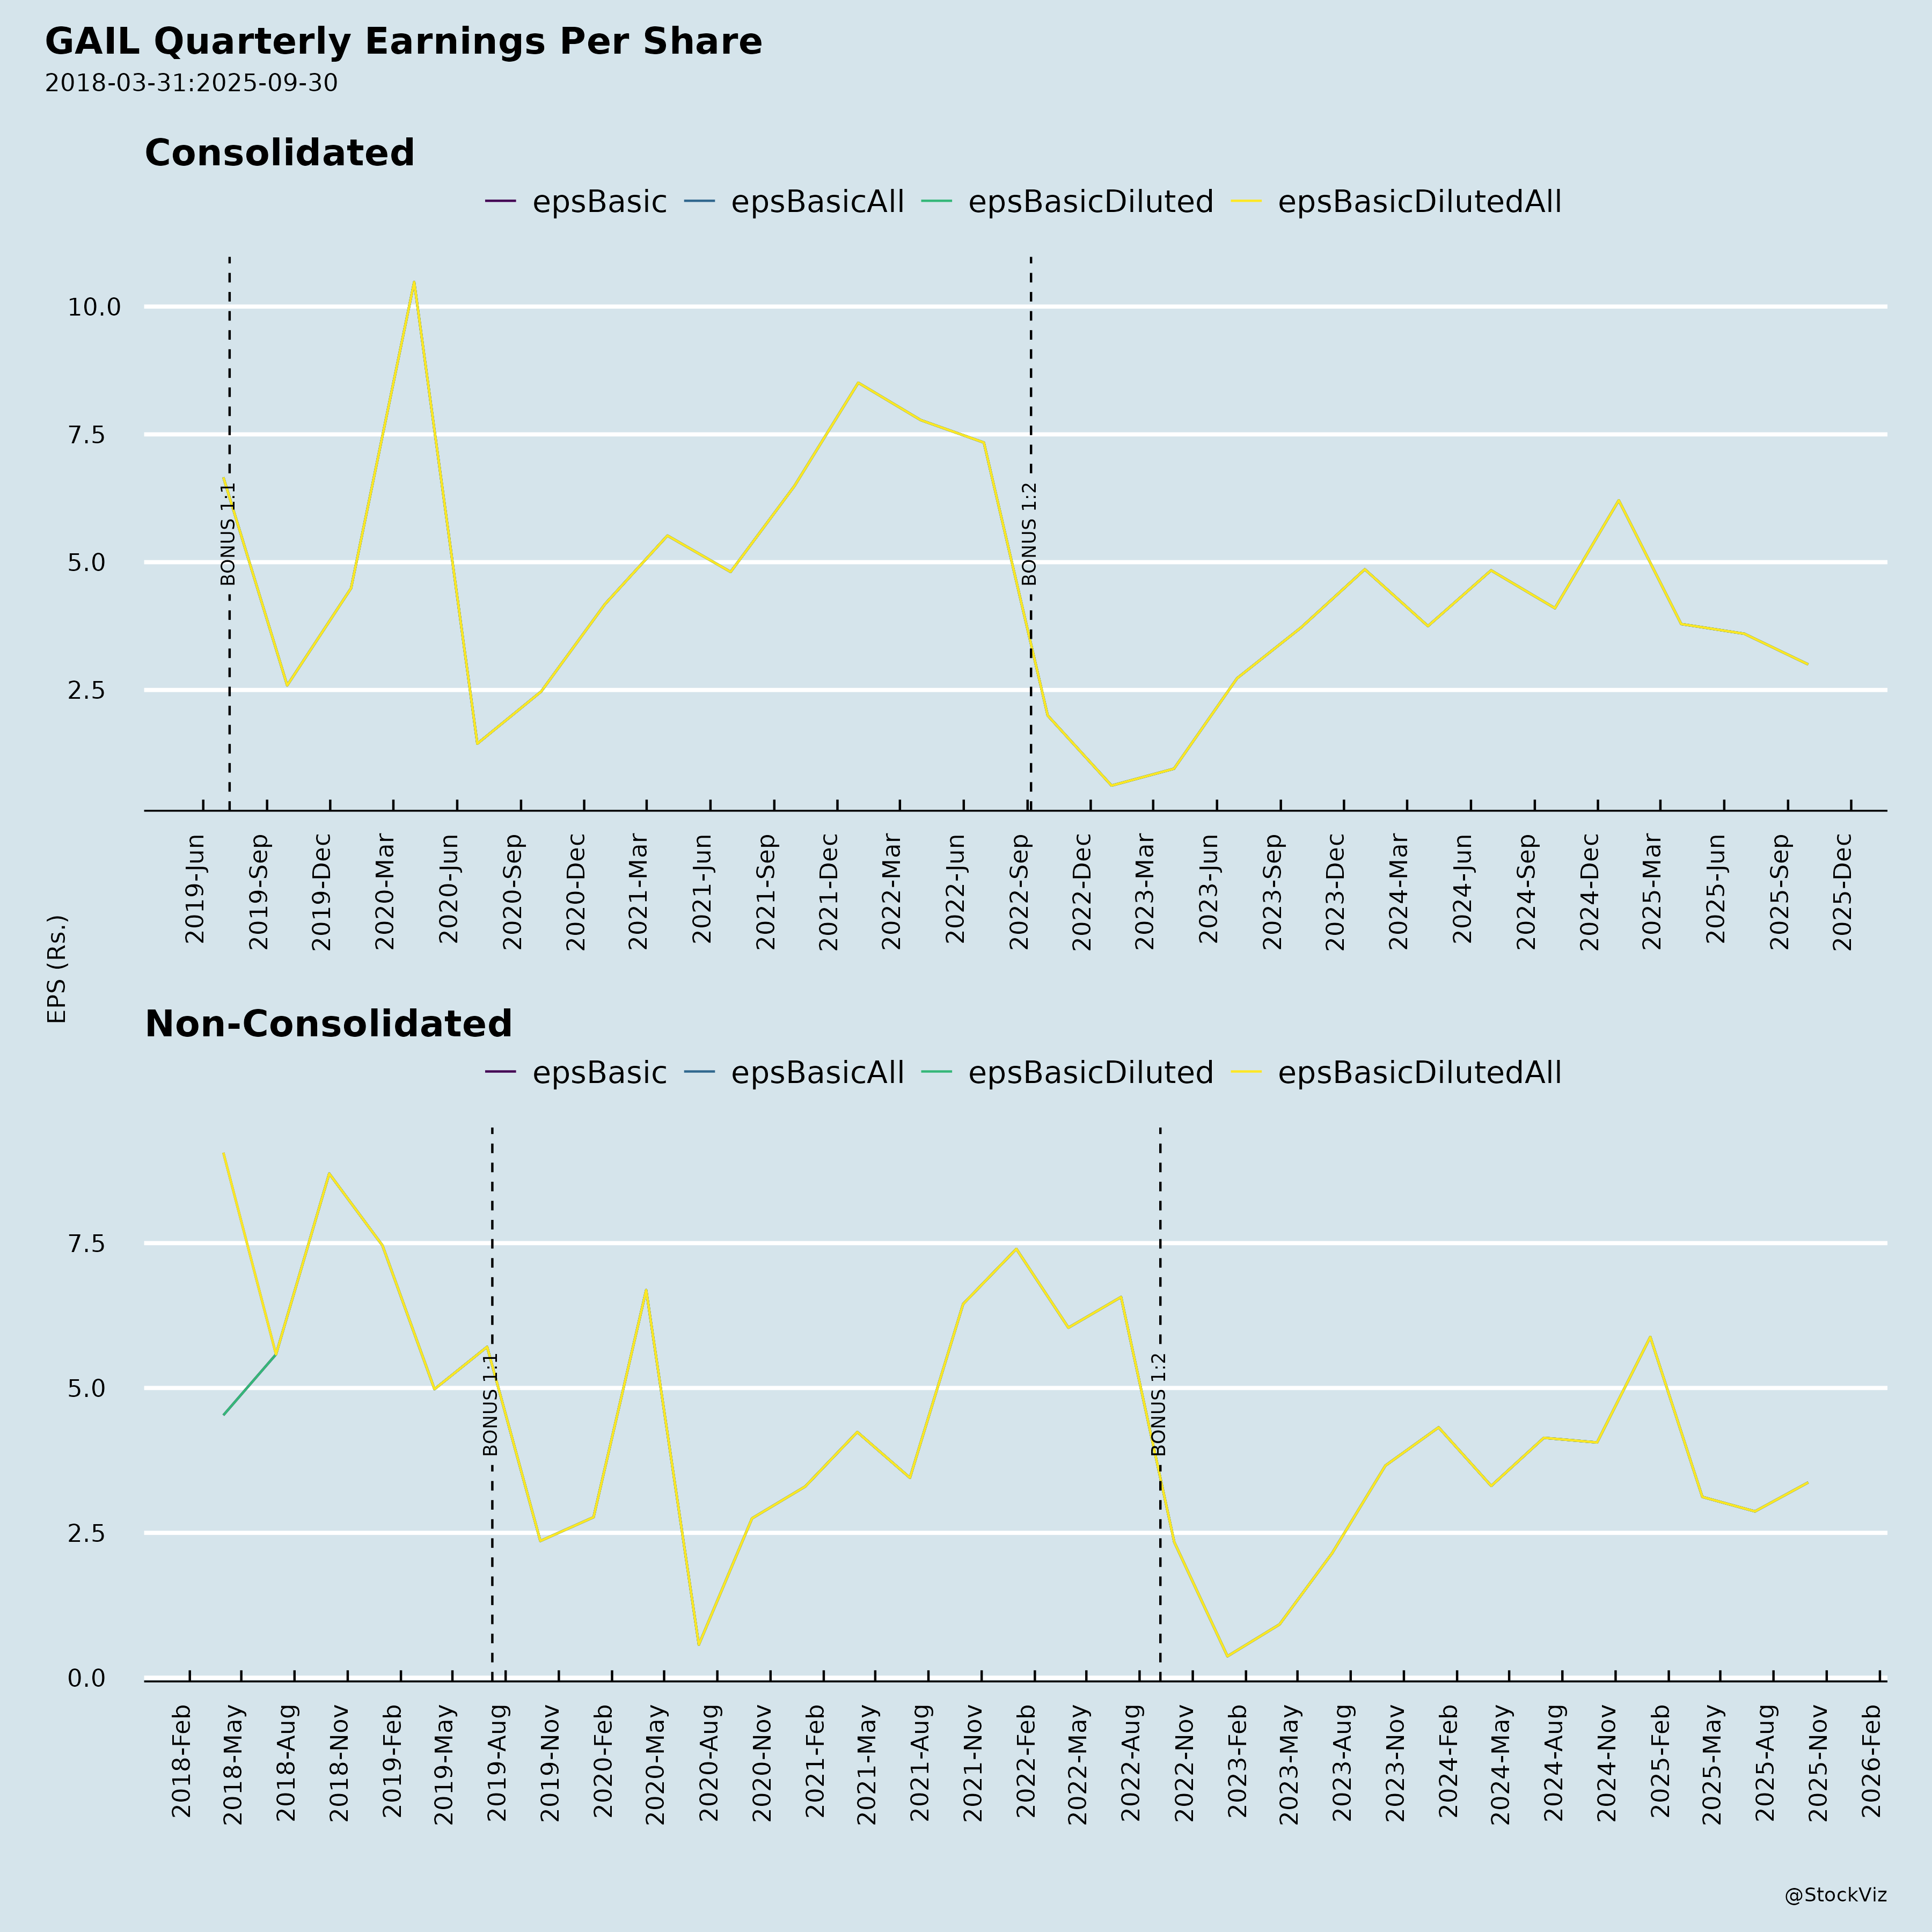
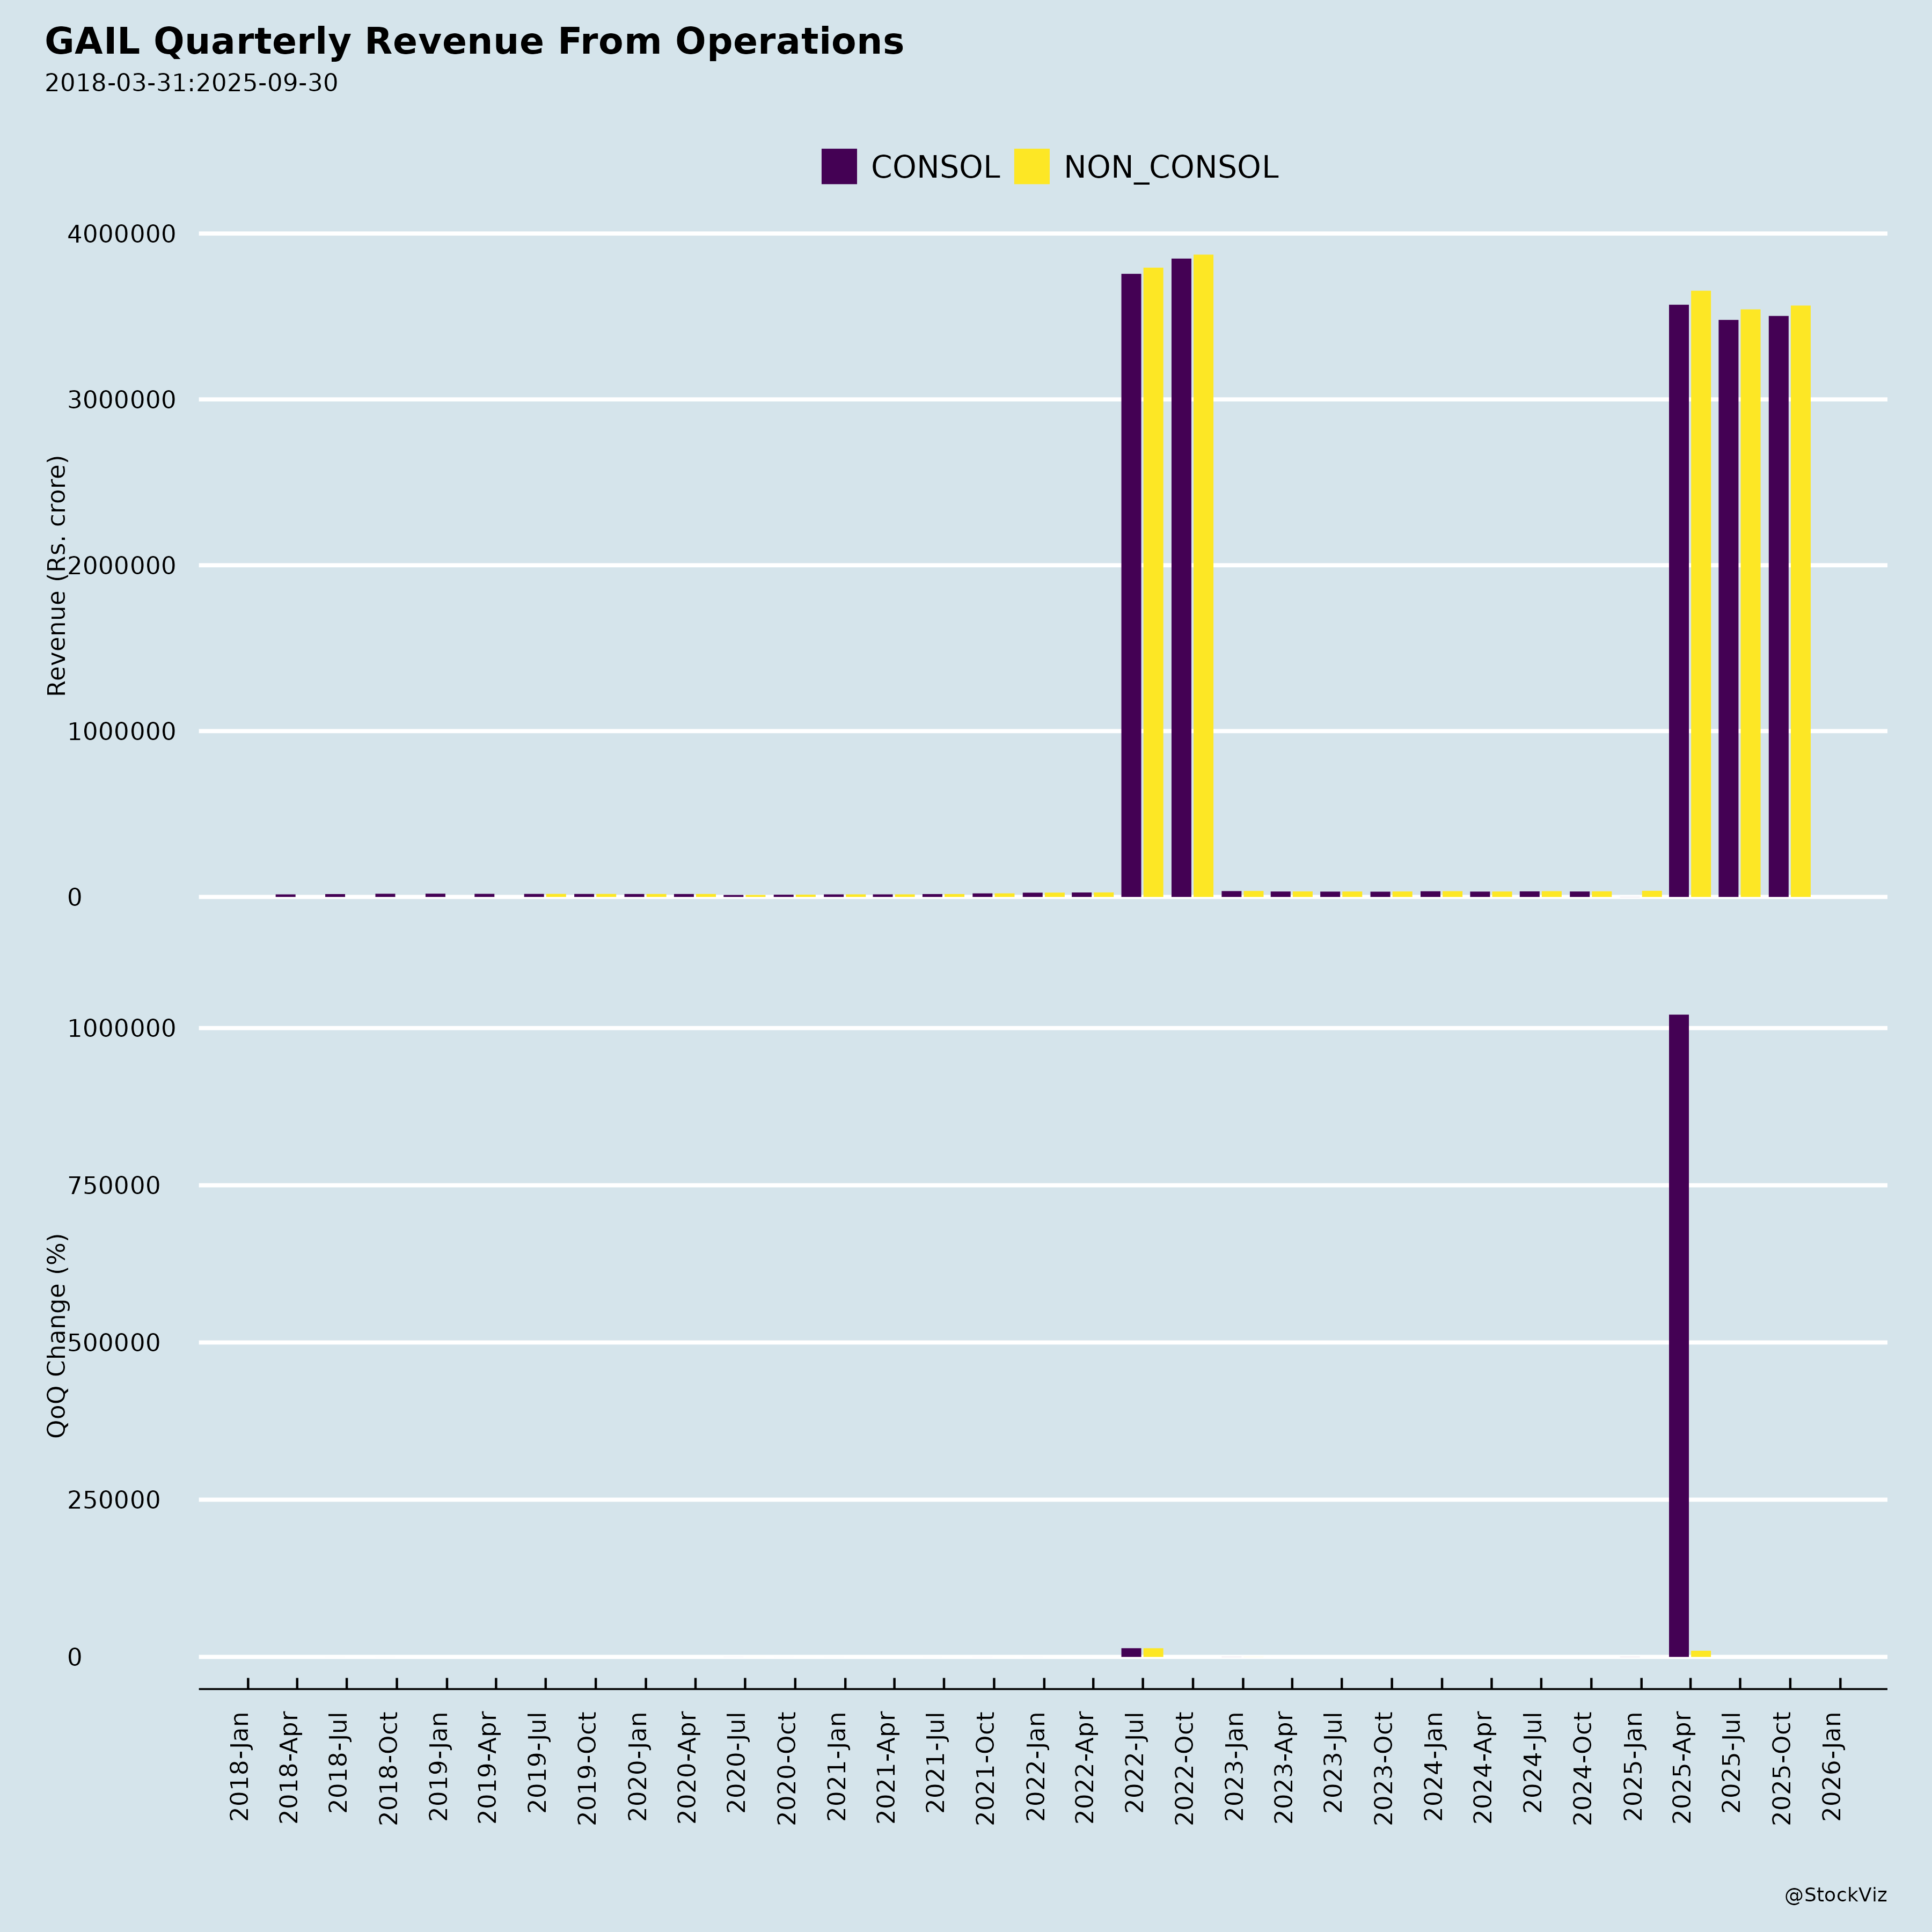
Overview: GAIL, India’s largest natural gas transmission and marketing company, reported solid H1 FY26 results (standalone revenue ₹69,824 Cr, up ~5% YoY; PAT ₹4,104 Cr, down ~24% YoY). Consolidated revenue ₹71,087 Cr (up ~3% YoY), PAT attributable to owners ₹4,343 Cr (down ~26% YoY). Key positives include tariff hikes and volume growth, offset by profitability pressures and regulatory overhangs. Below is a structured summary based on the provided filings (Q2/H1 FY26 results, tariff order, earnings presentation, etc.).
Tailwinds (Positive Catalysts)
- Tariff Uplift: PNGRB approved interim levelized tariff of ₹65.69/MMBTU (+12% from ₹58.61/MMBTU) for INGPL network effective Jan 1, 2026; positive P&L impact ~₹1,200 Cr (true-up in FY28). Supports transmission segment margins.
- Volume Growth: H1 FY26 gas transmission 122.11 MMSCMD (+ve QoQ); marketing 105.47 MMSCMD (+8% YoY). Petrochem/LHC sales up QoQ (209/223 TMT vs 177/198 TMT).
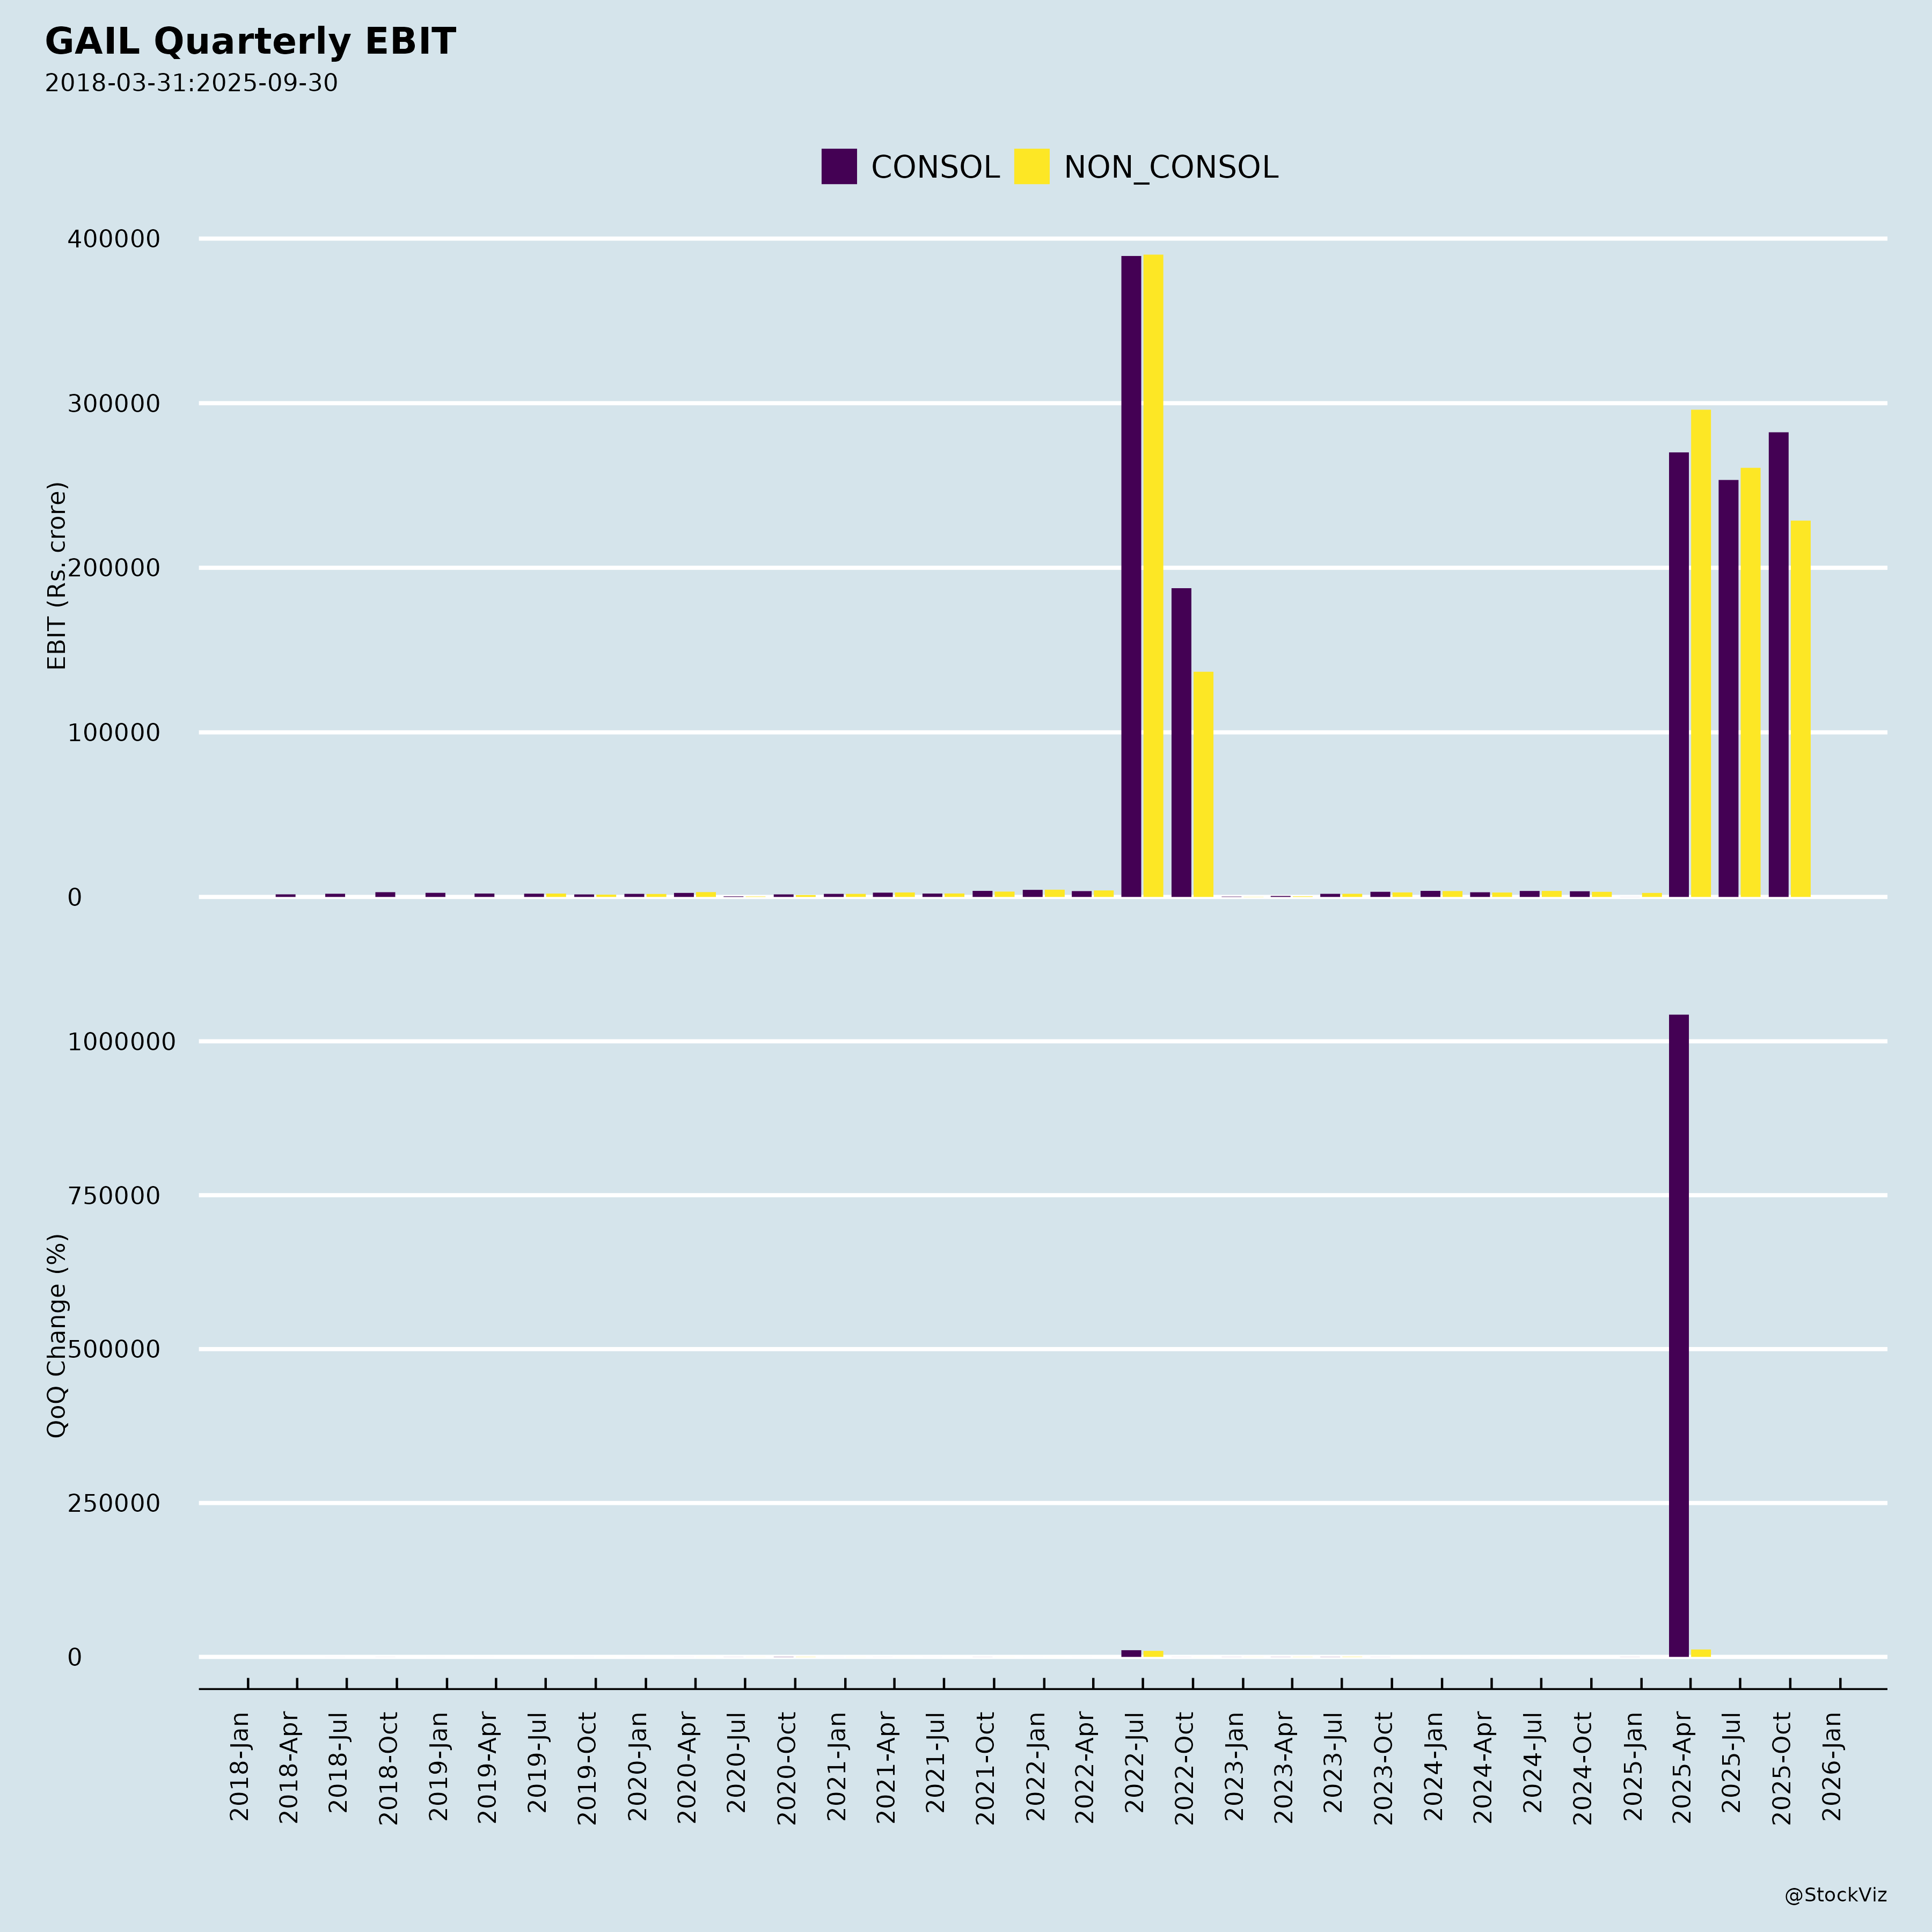
- Financial Resilience: Standalone turnover H1 ₹69,824 Cr (+5% YoY); gross margins stable; net worth ₹66,688 Cr; low debt (D/E 0.23x). Consolidated EBITDA H1 ₹6,378 Cr.
- Capex Momentum: H1 spend ₹4,838 Cr (pipelines 43%, renewables/CBG 25%, city gas 20%); FY26E ₹10,700 Cr. New projects: SAPL pipeline commissioned; Vijaipur-Bina (~₹450 Cr, 3-yr timeline).
- Sector Tailwinds: India’s gas demand push (transport, homes, industry); APM/RLNG mix stable (72%/26% transmission).
Headwinds (Challenges)
- Profitability Pressure: Standalone PAT H1 ₹4,104 Cr (-24% YoY); Q2 ₹2,217 Cr (up QoQ but EBITDA margins dipped to ~6-7%). Consolidated PAT down due to lower JVs/associates contribution.
- Input Cost Volatility: Higher RLNG/spot exposure (26-35% in marketing/transmission); LHC/polymer sales growth but pricing softness.
- Regulatory Delays: Limited interim tariff adjustment (only SUG/capacity; full true-up FY28); withdrawn 6/8 PNGRB appeals (no impact) but 2 pending.
- Macro/Operational: Lower APM/NAPM volumes; Q2 other expenses up (₹2,298 Cr).
Growth Prospects
- Infrastructure Expansion: Pipeline capex focus (₹1,400 Cr FY26E); city gas equity (₹2,500 Cr); petrochemicals (₹2,000 Cr). Target: 15-20% gas share in energy mix by 2030.
- Diversification: Renewables/Net Zero (12% FY26 capex); E&P/CBG/power; overseas (RIL/BP MDP 2-13%). H1 marketing sector mix: Power/Fertilizer/Industrial steady.
- Volume/EBITDA Upside: Gas marketing +8% YoY; transmission steady. Consensus: FY26 revenue ~₹1.4-1.5 Tn; PAT ₹9,000-10,000 Cr (tariff + volumes).
- Strategic: Maharatna status aids funding; strong balance sheet (cap employed ₹94,140 Cr); analyst meets signal investor engagement.
Key Risks
| Risk Category | Details | Potential Impact |
|---|---|---|
| Regulatory | PNGRB tariff true-ups delayed to FY28; 2 provisional orders under APTEL. | Margin volatility; ₹1-2K Cr deferred revenue. |
| Legal/Contingent | CESTAT Naphtha duty ₹3,705 Cr (SC appeal admitted, ₹152 Cr deposited); NFCL dues ₹840 Cr (recovery via subsidy/assets). | Cash outflow if adverse (~₹4K Cr total). |
| Commodity | RLNG/spot price spikes (26-35% exposure); calorific value adjustments. | EBITDA erosion (seen in H1). |
| Operational | E&P unreviewed (₹567 Cr H1 revenue); subsidiaries/JVs unreviewed (~₹11K Cr revenue). | Earnings surprises. |
| Execution | Capex delays (CWIP ₹20K Cr); forex (cash flow hedges loss ₹155 Cr H1). | ROCE pressure (stable ~16%). |
| Macro | Gas demand slowdown; competition in city gas/petrochem. | Volume growth <10% YoY. |
Investment Summary: Moderate Buy/Accumulate. Tailwinds from tariffs/volumes/capex outweigh headwinds; growth intact via infra/diversification. Risks mitigated by strong BS/low leverage, but monitor regulatory/legal outcomes. Target upside 15-20% from current levels (assuming FY26 PAT ₹9.5K Cr, 18x PE). Q3 results key for tariff integration.
Copyright © 2023 SAS Data Analytics Pvt. Ltd. All rights reserved.