AWL
Equity Metrics
September 24, 2026
Adani Wilmar Limited
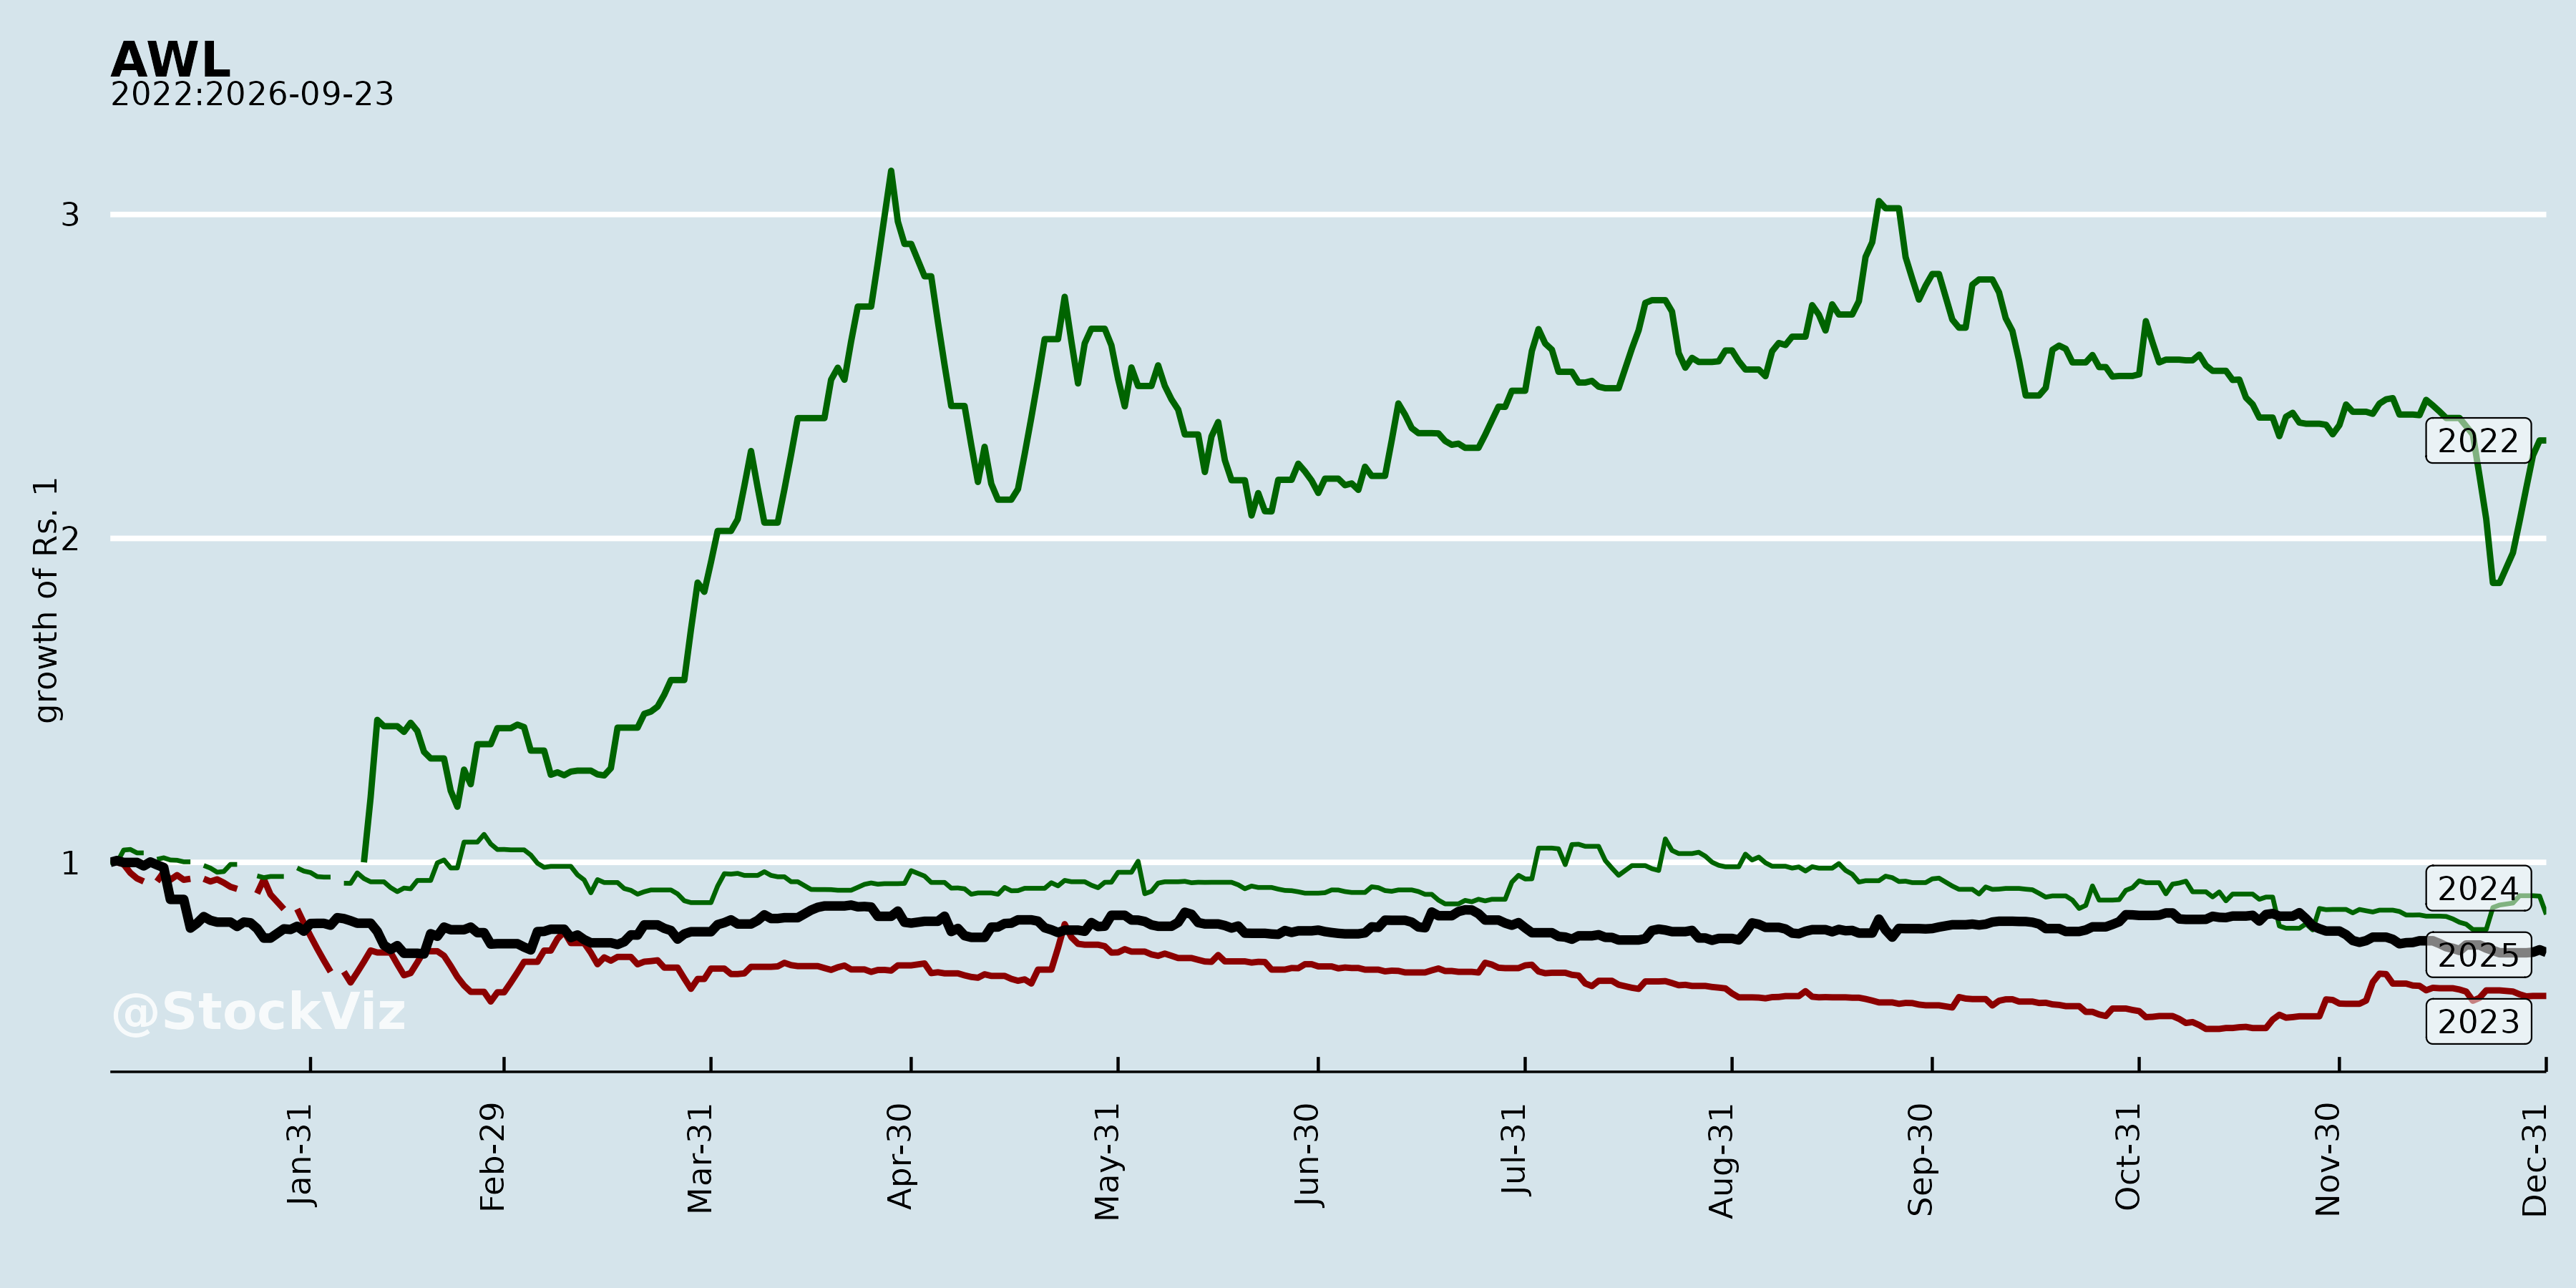
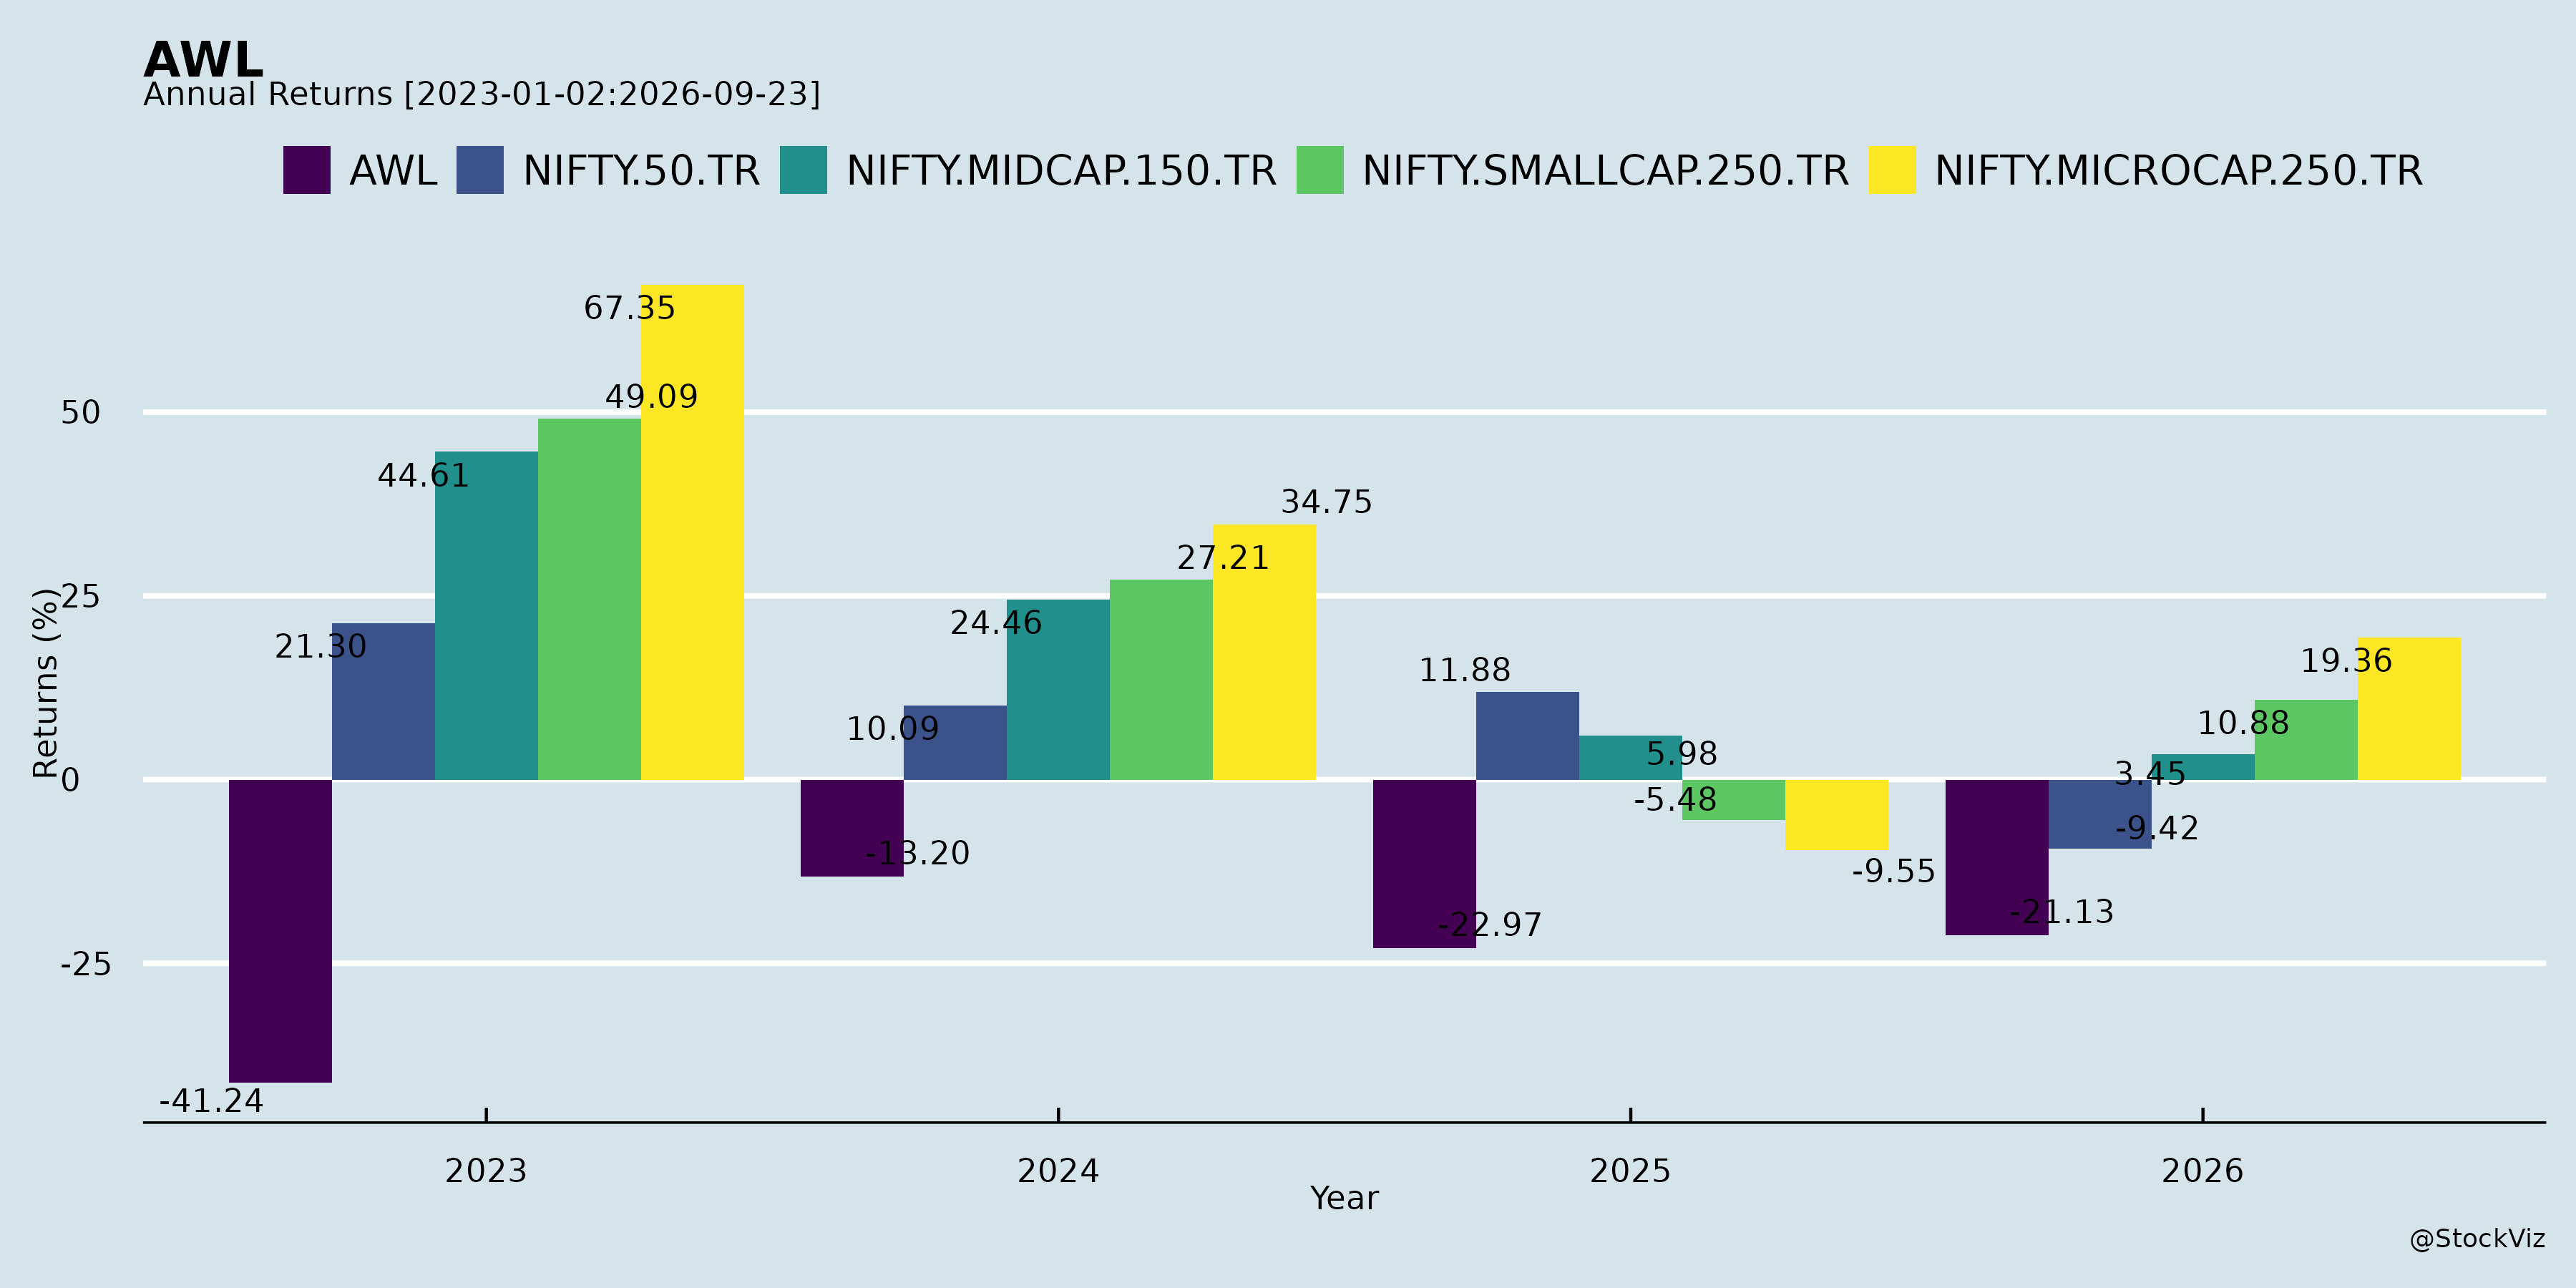
Annual Returns
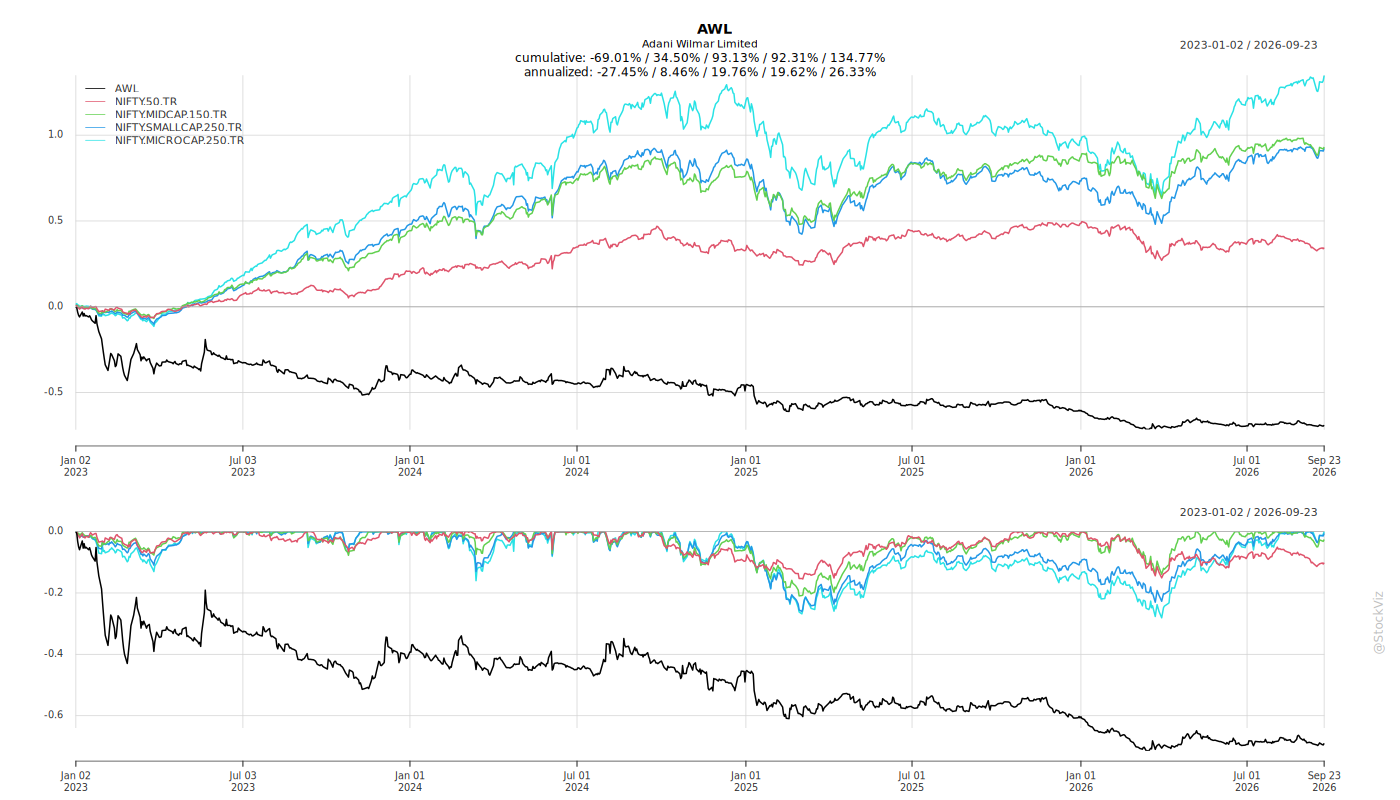
Cumulative Returns and Drawdowns
Fundamentals
Ownership
Margined
AI Summary
asof: 2026-09-16
AWL Agri Business Limited — Q1FY27: Headwinds, Tailwinds, Risks and Guidance vs Performance
1. Headwinds and Challenges
Macro and input-cost pressures (as of the Q1FY27 presentation): - Sea freight costs doubled at the peak of geopolitical disruptions and remain ~50% above pre-war levels despite recent moderation. - Nepal duty-free inflow into India continues. - Elevated global energy prices have led to higher consumption of edible oils for biodiesel production. - Indonesia B50 is expected to divert volumes out of annual palm oil demand from July, tightening export diversion. - Monsoon deficit / El Niño risk: rainfall was 32% below normal as of 15 June, raising concerns on supply and rural demand. - Standardized packaging: edible oil pack sizes will be standardized as per the latest Government of India notification.
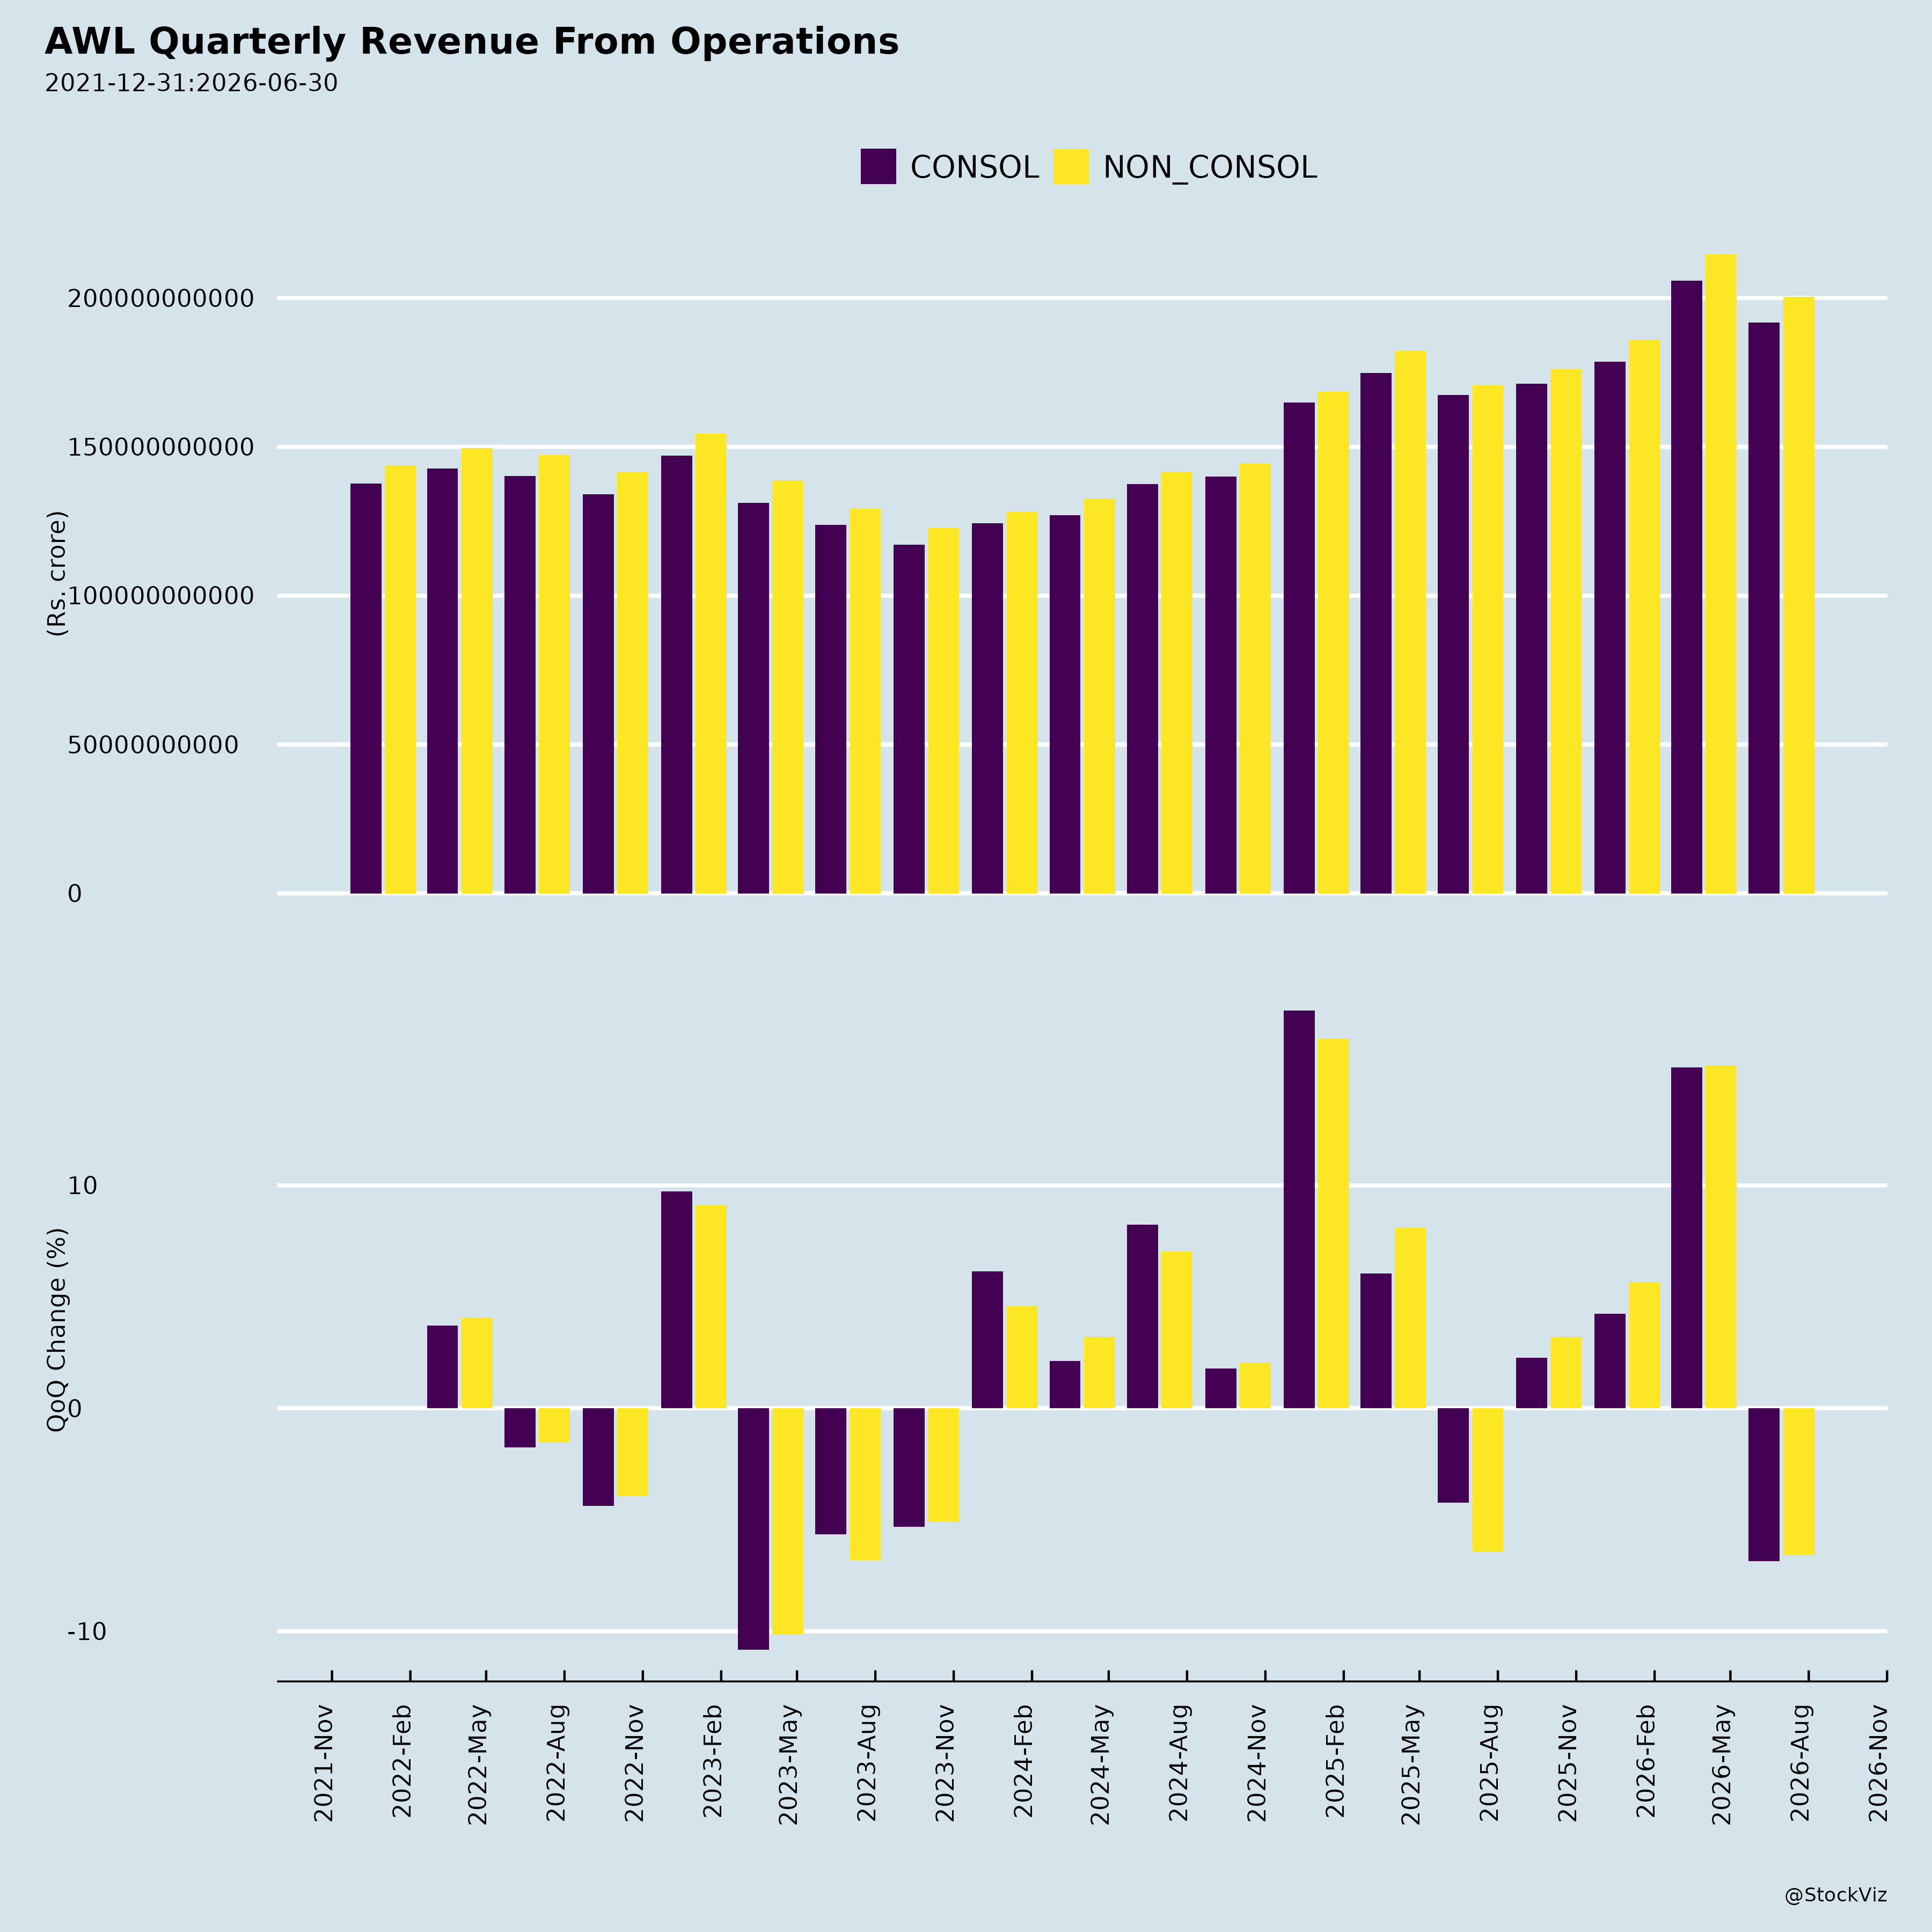
Business-level challenges: - Edible oil volume growth was modest at 2% YoY (0.98 MMT) amid continued global edible oil price volatility; the segment’s QoQ volume declined 20% and revenue declined 12% QoQ. - Fortune brand (Oil & Foods) recorded a low single-digit decline in volume growth YoY, even as alternate-channel volume for the brand grew 27% YoY. - Food & FMCG segment results (PBT-level segment results) declined 3% YoY to ₹72 crore in Q1FY27, even as segment EBITDA rose 9% YoY to ₹104 crore. - Food & FMCG ROCE remains low at 6% (LTM Jun’2026), with the business described as being in an investment phase; the segment’s ROCE was 1% in FY25 and 7% in FY26. - Unallocable expenses rose 61% YoY to ₹61 crore (and 24% QoQ), weighing on PBT. - Total volumes declined 9% QoQ to 1.7 MMT and revenue declined 7% QoQ to ₹20,048 crore.
2. Tailwinds and Growth Prospects
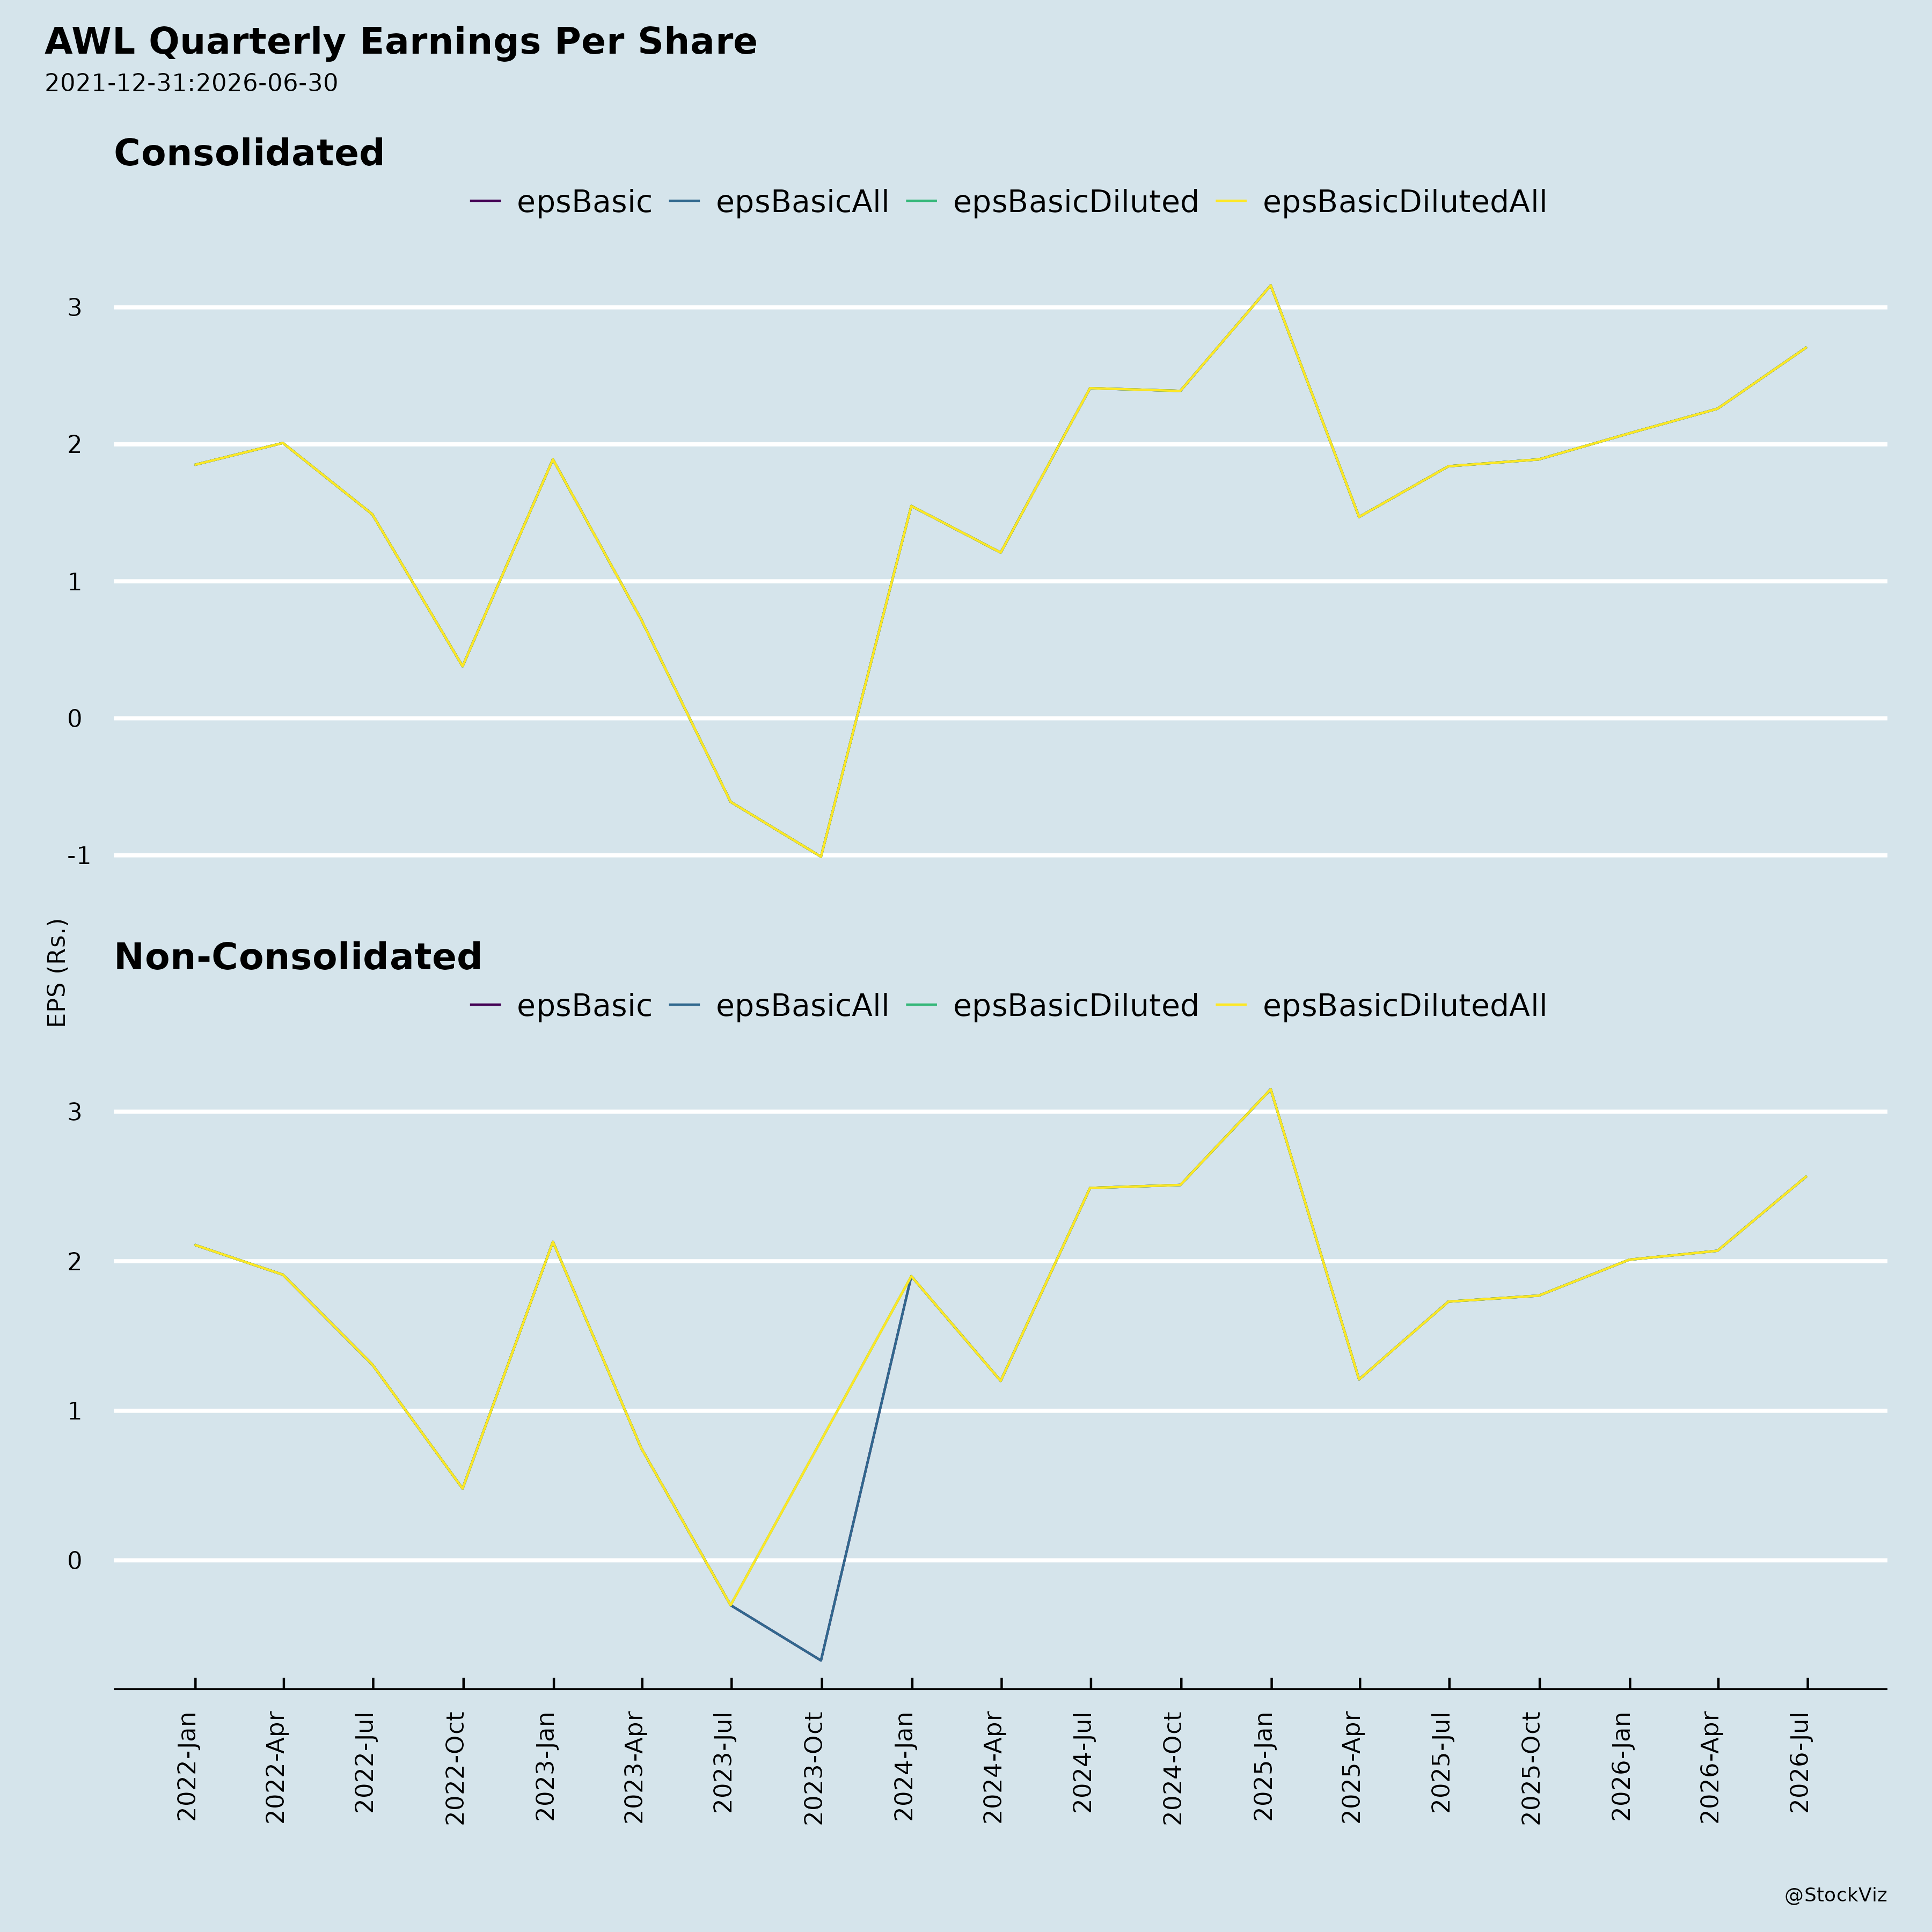
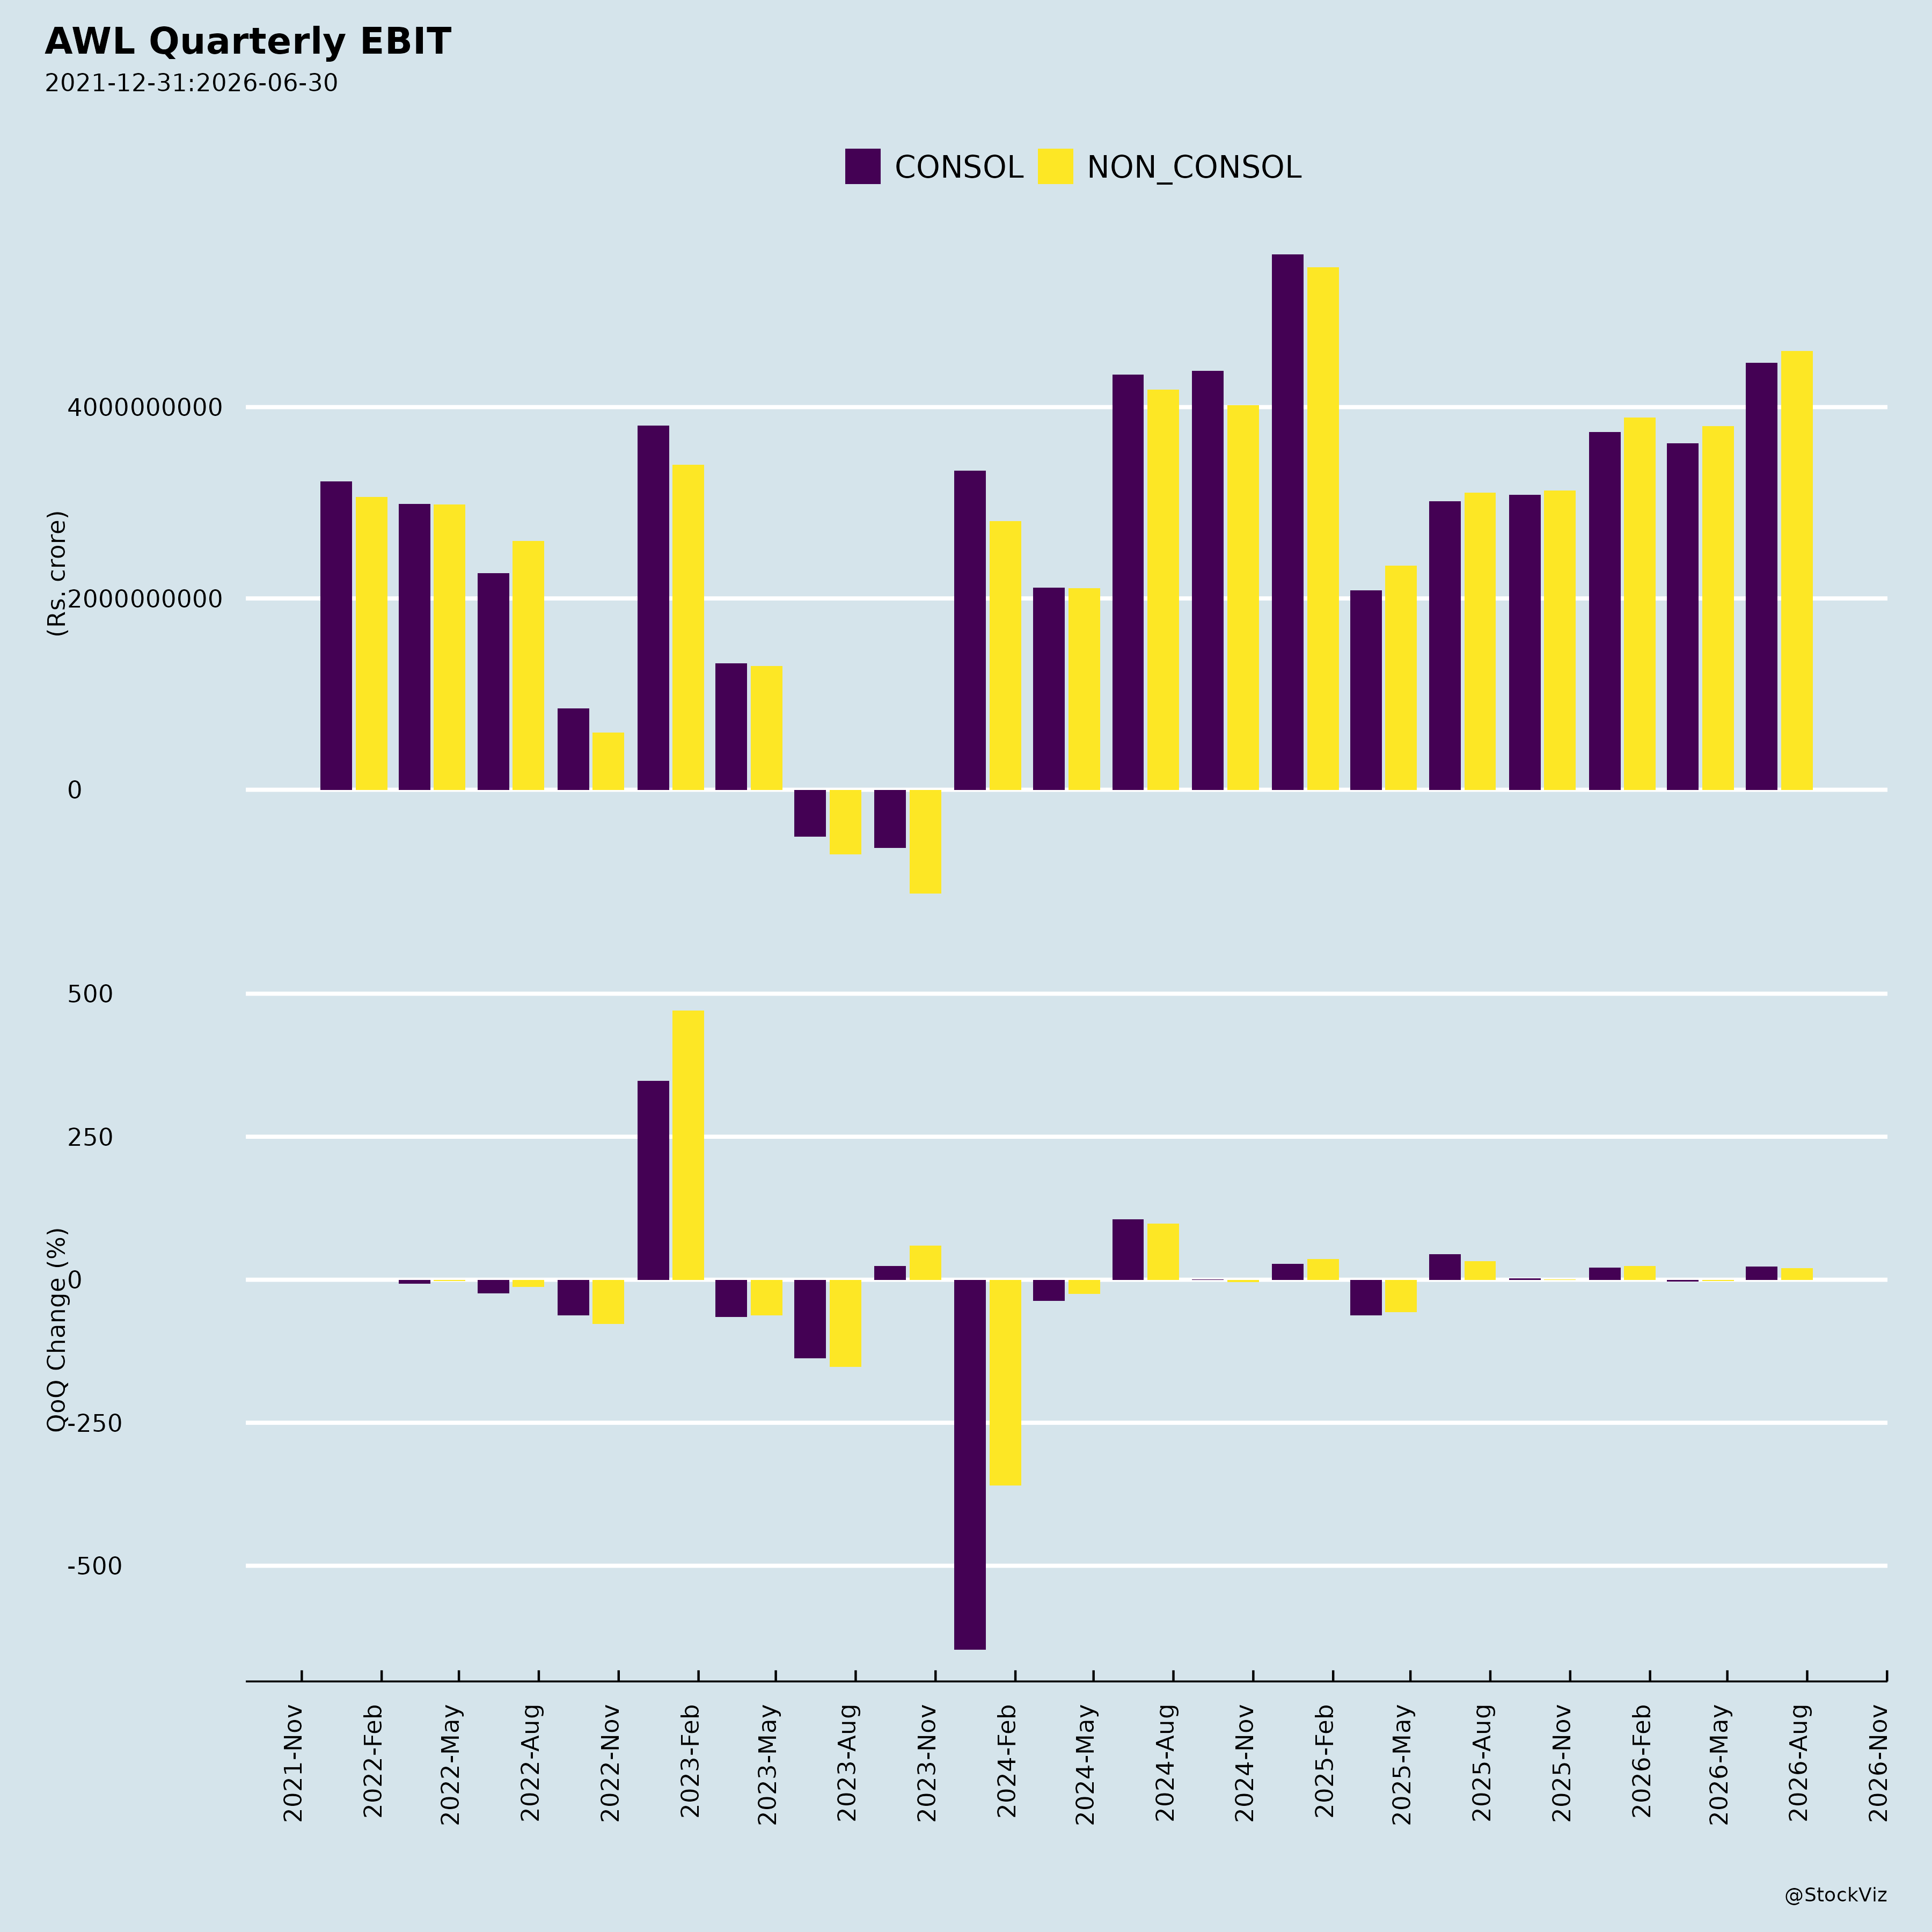
Overall Q1FY27 performance: - Revenue of ₹20,048 crore, up 18% YoY; EBITDA (excl. other income) of ₹693 crore, up 34% YoY; underlying volume growth of 7% YoY. - PBT up 51% YoY to ₹478 crore; PAT up 48% YoY to ₹351 crore. - Normalized gross profit of ₹2,134 crore (up 21% YoY); normalized EBITDA of ₹693 crore (up 34% YoY).
Food & FMCG: - Revenue of ₹1,726 crore, up 22% YoY; EBITDA crossed ₹100 crore at ₹104 crore (up 9% YoY); EBITDA margin at 6%, against an 8-quarter average margin of 3–4%. - Underlying volume growth of 18% YoY, driven by rice, pulses, sugar, poha and home & personal-care products. - Fortune & Kohinoor continued to deliver double-digit revenue growth; continued gains in basmati rice market share alongside stable wheat flour share (per Nielsen). - Alternate channels (e-commerce, quick commerce, modern trade) growing north of 25% YoY. - GD Foods (Tops — sauces & condiments): revenue growth of 23% YoY, UVG of 18% YoY, material margin of 52%; General Trade +25% and alternate channels +12%; ongoing cost optimization expected to support margin expansion. - Management expects continued scaling of the Food & FMCG business to drive further margin improvement over the next five years.
Edible Oil: - Revenue of ₹15,465 crore, up 15% YoY; EBITDA of ₹492 crore, up 33% YoY; EBITDA per ton of ₹5,030, up 30% YoY. - Growth led by strong demand for palm (high-teens) and mustard (high-single-digit) oils; market leadership and stable market share maintained; improved pricing discipline and premiumization supported profitability.
Industry Essentials: - Revenue of ₹2,857 crore, up 28% YoY; volume of 0.41 MMT, up 13% YoY; EBITDA of ₹176 crore, up 47% YoY; EBITDA per ton of ₹4,349, up 30% YoY. - Oleochemicals & Specialty Chemicals (~40% of segment revenue) delivered double-digit growth with healthy high-single-digit operating margins; revenue growth 29% YoY, volume growth 15% YoY. - Supported by improved realizations and favorable product mix.
Brand and channel momentum: - Kohinoor: volume growth 38% YoY; HoReCA channel volume growth 31%. - Kings: volume growth 27% YoY; branded exports channel volume growth 86%. - Alternate channels: revenue up 21% YoY, volume up 33% YoY; quick commerce value and volume up 64% and 56% YoY respectively; Q-com is 33% of alternate-channel volume. - Combined market share across e-com & q-com: edible oil ~29%, nuggets ~46%, sugar ~17%, maida ~21%, besan ~28%. - Distribution: total reach >26 lakh outlets (per Nielsen); direct reach >9.70 lakh outlets, up 5,000+ QoQ; rural coverage of 63,000+ rural towns.
Strategic portfolio expansion: - Addition of the Madhur brand strengthens AWL’s presence in packaged sugar and supports the long-term strategy of scaling branded Food & FMCG, leveraging AWL’s distribution network.
Capital allocation and returns: - Segment ROCE (LTM Jun’2026): Edible Oil 14%, Food & FMCG 6%, Industry Essentials 15%, Total 10%. - As the Food business matures, ROCE is expected to reach 25%+; the Food business is in an investment phase, targeting 20–25%+ ROCE at company level as it matures. - Limited investment required in the Edible Oil business in recent years despite continuous growth; capital is being allocated to the Food business.
3. Key Risks
- Commodity price and volatility risk: edible oil prices remained broadly stable versus March 2026, with a marginal increase in sunflower oil offset by slight declines in palm and soya oil; the segment operates amid continued global edible oil price volatility.
- Derivative exposure: the company enters into commodity derivative instruments to manage commodity price risk; the net impact of realized and unrealized loss/(gain) is classified under ‘Other Expenses/Other Income’. For Q1FY27 the loss was ₹67.29 crore, versus gains of ₹104.47 crore in Q4FY26, ₹153.34 crore in Q1FY26 and ₹212.53 crore in FY26.
- Regulatory risk: standardization of edible oil pack sizes per Government of India notification; the New Labour Codes effective November 21, 2025 led to a one-time past service cost (₹25.83 crore consolidated, ₹25.02 crore standalone) recognized in the previous financial year as an exceptional item, with no further impact in Q1FY27.
- Geopolitical and trade-flow risk: sea freight elevated, Nepal duty-free inflows continuing, Indonesia B50 diversion, and biodiesel-driven edible oil demand.
- Weather/rural demand risk: monsoon deficit and El Niño risk (rainfall 32% below normal as of 15 June).
- Competitive and pricing environment: intense competition and pricing environment in the market, as noted in the safe harbour statement.
- Execution and strategy risk: ability to implement business strategies successfully, maintain and manage key customer relationships and supply chain sources, and respond to changes in regulatory environments, political instability, international oil prices and input costs, and new or changed priorities of the trade.
- Forward-looking statement risk: the company cannot guarantee that forward-looking statements will be realized and does not undertake to update them.
- Audit scope considerations: the consolidated review relies on other auditors for certain subsidiaries and joint ventures; 4 of 7 subsidiaries and an associate are located outside India, and certain entities’ interim financial results were not reviewed by any auditors (management-certified, deemed not material to the Group).
4. Management Guidance vs Observed Business Performance
Food & FMCG margin trajectory: - Guidance/expectation: average long-term EBITDA margins of 3–4%, with continued scaling expected to drive further improvement over the next five years; as the Food business matures, ROCE is expected to reach 25%+, targeting 20–25%+ ROCE at company level. - Observed: Q1FY27 EBITDA margin of 6%, above the 8-quarter average of 3–4%; segment ROCE at 6% (LTM Jun’2026), up from 1% in FY25 and 7% in FY26 — still well below the 25%+ aspiration, consistent with the stated investment phase.
GD Foods (Tops) margin expansion: - Guidance/expectation: ongoing cost optimization initiatives expected to support margin expansion. - Observed: Q1FY27 revenue growth of 23% YoY, UVG of 18% YoY, material margin of 52%; broad-based channel growth (GT +25%, alternate +12%).
Edible Oil profitability: - Observed: EBITDA per ton of ₹5,030, up 30% YoY, with improved pricing discipline and premiumization supporting healthy profitability despite volatile conditions; volumes grew 2% YoY while maintaining market leadership and stable share.
Industry Essentials: - Observed: revenue +28% YoY, volume +13% YoY, EBITDA +47% YoY, EBITDA per ton +30% YoY; Oleochemicals & Specialty Chemicals delivered double-digit growth with healthy high-single-digit operating margins, supported by improved realizations and favorable product mix.
Overall company: - Observed: revenue +18% YoY, EBITDA (excl. OI) +34% YoY, PBT +51% YoY, PAT +48% YoY; QoQ declines in volume (-9%), revenue (-7%) and gross profit (-9%), while EBITDA (excl. OI) rose 10% QoQ and PAT rose 20% QoQ.
Disclosure framework change: - Effective Q1FY27, Food & FMCG performance is presented on a margin basis, while Edible Oils & Industry Essentials continue to be presented on a per-ton basis. Company-level disclosures (normalized gross profit and EBITDA) remain consistent with earlier disclosures. Since Q4FY24, derivative gain/loss has been reclassified from ‘Cost of Material Consumed’ to ‘Other Income/Other Expenses’, with normalized gross profit and EBITDA presented accordingly.
Dividend and governance: - The 28th AGM (July 7, 2026) approved a final dividend of Re. 1 per equity share (100%) for FY2025-26, along with adoption of standalone and consolidated financial statements, re-appointment of directors, material related party transactions for FY2026-27, re-appointment of Mr. Ravindra Kumar Singh as Whole Time Director for three years effective November 1, 2026, ratification of cost auditor remuneration, and payment of commission to Non-Executive Independent Directors.
Broker Narrative
The narrative shifted from an initial Reduce warning about one-off operational/hedge shocks, edible-oil margin pain, and raw-material risk, to a long series of Buy calls premised on volume recovery and foods scaling, and finally to a Hold that acknowledged persistent input-cost inflation, weak rural demand, and competitive share loss. Early concerns about edible-oil profitability and raw-material volatility remained central; the later optimism moved toward alternate channels, industry essentials, and Bangladesh recovery rather than the earlier broad volume-led recovery.
Fears that came true
- Raw-material volatility, flagged as a key future risk, materialized as elevated input costs/raw-material inflation pressured margins in the last report.
- Edible-oil profitability contraction persisted: EBITDA margin fell 35 bps YoY and branded edible oils lost ~50 bps share to FTA imports and a narrower palm-soya differential.
- The risk of failing to scale the foods business materialized: Food & FMCG volumes declined 10% YoY due to the loss of the government rice business and intense regional competition in atta.
Optimism that failed
- The early expectation of sustained volume-led recovery failed: branded edible-oil volumes were hurt by weak rural demand and trade-down to smaller packs, while Food & FMCG volumes declined.
- The stable 19.5% edible-oil market share did not hold, as the last report noted a ~50 bps share loss in branded oils.
- The repeated optimism that demand would normalize and drive positive returns failed: every Buy call after the first report ended in DISAPPOINTMENT with large negative actual returns.
- Foods & FMCG momentum faded: earlier 28% YoY revenue growth and margin expansion were replaced by a 10% YoY volume decline and competitive pressure in atta.
Broker Timeline
12 broker calls · 2023-08-03 to 2025-11-10
Copyright © 2023 SAS Data Analytics Pvt. Ltd. All rights reserved.